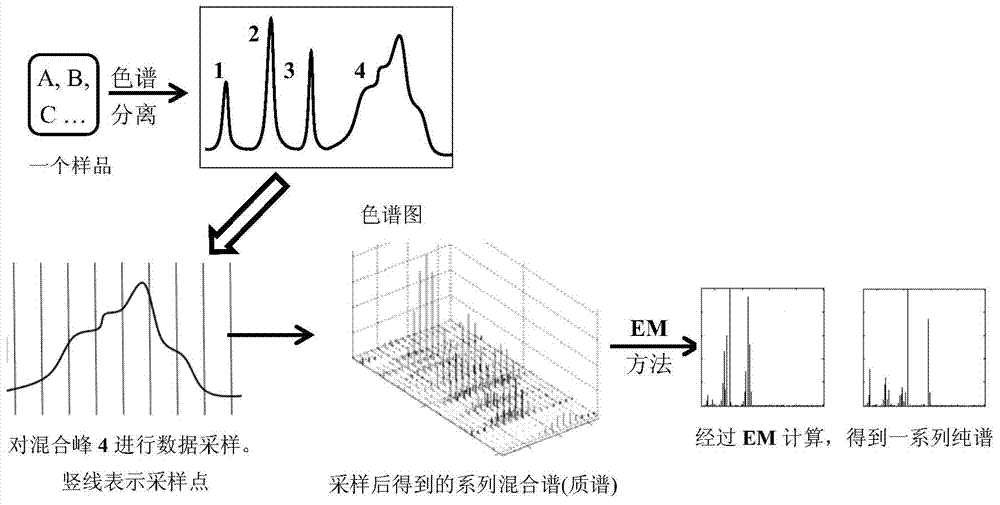
Method for analyzing mixture component
A mixture and algorithm technology, applied in the field of chemical analysis, can solve problems such as inability to meet, and achieve the effect of low cost, low personnel requirements, and low personnel requirements
- Summary
- Abstract
- Description
- Claims
- Application Information
AI Technical Summary
Problems solved by technology
Method used
Image
Examples
Embodiment 1
[0115] Embodiment 1: Apply the method of the present invention to analyze aviation kerosene on the gas chromatography-mass spectrometry analyzer
[0116] 1. Experimental conditions
[0117] An aviation kerosene sample (purchased in the market) was analyzed on an Agilent gas chromatography-mass spectrometry analyzer. The chromatographic column model was HP5-MS. The temperature control was first at 30°C for 5 minutes, and then the temperature was raised from 30°C to 300°C , the heating rate is 10°C / min. Since aviation kerosene is a complex mixture, it mainly contains many alkane and aromatic components with similar structures, and many components belong to isomers, so the degree of mixing is very complicated; Hyphenated analyzers cannot be completely separated.
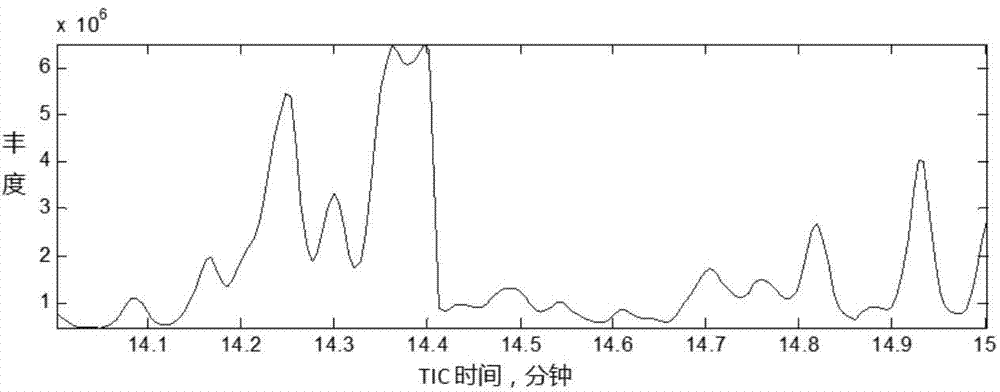
[0118] The mixture is analyzed by the above-mentioned instrument to obtain a TIC (Total Ion Current) spectrum, of which the TIC spectrum at 14 to 15 minutes from the peak is shown in image 3 . Data sampling was per...
Embodiment 2
[0130] Embodiment 2: Apply the method of the present invention to analyze volatile substances on a gas chromatography-mass spectrometry analyzer
[0131] 1. Experimental conditions:
[0132] A aviation kerosene sample (obtained by a conventional method experiment) obtained by hydrogenation of seaweed oil was analyzed on an Agilent gas chromatography-mass spectrometry analyzer. , and then increase the temperature from 30°C to 300°C at a rate of 10°C / min.
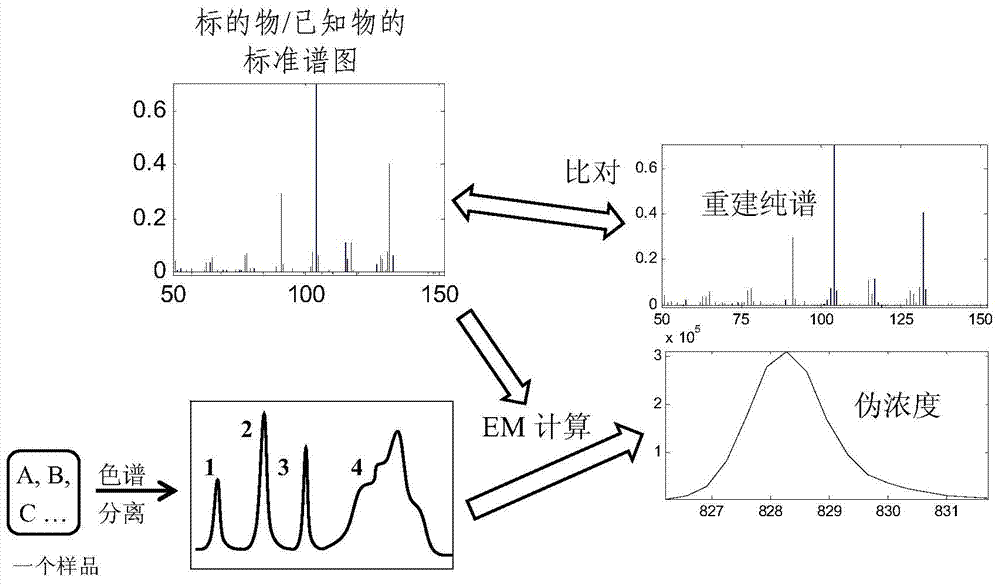
[0133] The mixture is analyzed by the above-mentioned instrument to obtain a TIC (Total Ion Current) spectrum, among which the TIC spectrum from the peak of 800 to 850 seconds is shown in Figure 8 . Figure 8 It can be seen that there is a peak in the interval from 827 to 832 seconds, but the peak shape is asymmetrical. I don't know if this peak is a peak of pure components. Therefore, data sampling was performed on the spectra from 827 to 832 seconds, and a total of 17 data samples were taken. The obtained series of mixt...
Embodiment 3
[0157] Embodiment 3: MREM algorithm applies the method of the present invention to analyze volatile substances on a gas chromatography-mass spectrometry analyzer
[0158] On the same data as in Example 2, the MREM method was applied, and the same results as in Example 2 were obtained.
[0159] MREM method application parameters:
[0160] Peak lock interval: the entire interval, m / z=50~150 (that is, it is not specified whether to use a specific peak, it is not necessary to specify a specific peak, let the MREM method find it by itself). Number of locked peaks: only one locked at a time.
[0161] Optimization method: simulated annealing method for local optimization (reference ③ above).
[0162] Optimization times: 30 times.
[0163] When using the MREM algorithm, in the data of Example 2, after using the above parameters, 30 reconstructed pure spectra can be obtained. After removing the same reconstructed pure spectra, the same result as in Example 2 is obtained, that is, 4 ...
PUM
 Abstract
Description
Claims
Application Information
 - R&D
- Intellectual Property
- Life Sciences
- Materials
- Tech Scout
- Unparalleled Data Quality
- Higher Quality Content
- 60% Fewer Hallucinations
Browse by: Latest US Patents, China's latest patents, Technical Efficacy Thesaurus, Application Domain, Technology Topic, Popular Technical Reports.
© 2025 PatSnap. All rights reserved.Legal|Privacy policy|Modern Slavery Act Transparency Statement|Sitemap|About US| Contact US: help@patsnap.com


