
Method for realizing semi-quantitative analysis to trace mixture by use of surface enhanced raman spectroscopy

A surface-enhanced Raman and quantitative analysis technology, which is applied in Raman scattering, material excitation analysis, etc., can solve problems such as a surprising amount of work, achieve accurate identification methods, and reduce spectral data.

Active Publication Date: 2015-09-16
广西三环高科拉曼芯片技术有限公司
View PDF8 Cites 18 Cited by
  • Summary
  • Abstract
  • Description
  • Claims
  • Application Information

AI Technical Summary

Problems solved by technology

For a mixture of two chemical substances, it is often necessary to change nearly ten kinds of ratios to measure the Raman spectrum; for a mixture of three or more chemical substances, it is necessary to change at least dozens of ratios for testing, and the workload is amazing

Method used


Image

  • Method for realizing semi-quantitative analysis to trace mixture by use of surface enhanced raman spectroscopy
  • Method for realizing semi-quantitative analysis to trace mixture by use of surface enhanced raman spectroscopy
  • Method for realizing semi-quantitative analysis to trace mixture by use of surface enhanced raman spectroscopy

Examples


Embodiment 1

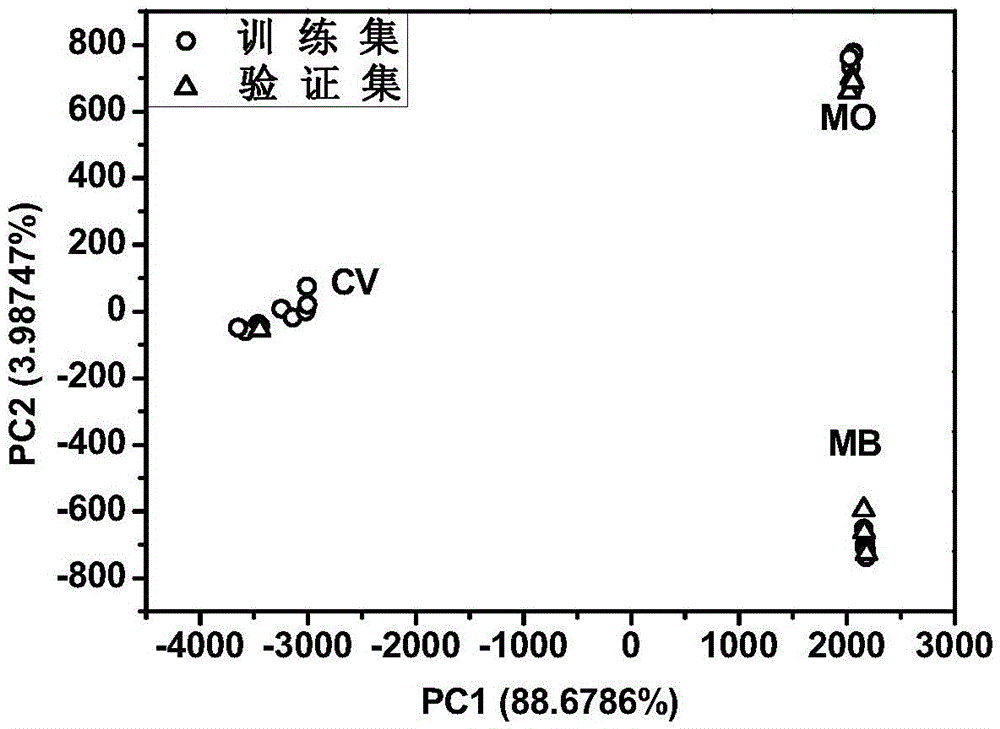
[0053] In order to prove that the principal component analysis method in this invention can determine the mixed solution components of completely different chemical substances, three dyes methyl orange (MO), methylene blue (MB) and crystal violet (CV) are selected as modeling substances. The experimental and analysis steps are as follows:

[0054] 1. Prepare the concentration of the three dyes as 5×10 -6 Aqueous solution of M.

[0055] 2. Take 3mL each of MO, MB, and CV solutions, and the soaking area is about 25mm 2 SERS basis for half an hour. After soaking, put the SERS substrate flat on a glass slide to dry, and the dye molecules have been adsorbed on the substrate.

[0056] 3. Use the BWTEK portable Raman spectrometer to measure the Raman spectrum of the dye molecule. The laser wavelength is 785nm, the power is 300mW, and the integration time is 5s. Randomly select 10 positions on each sample to measure the spectrum, and the difference in the measured spectra is very...

Embodiment 2

[0076]In order to prove that the principal component analysis method in this invention can determine the mixed solution composition of chemical substances similar in structure and Raman spectrum, choose three homologues 2-chlorobiphenyl (2-CB), 3 -Chlorobiphenyl (3-CB) and 4-chlorobiphenyl (4-CB) were used as model substances. The experimental and analysis steps are as follows:

[0077] 1. Prepare the concentration of the three respectively to 5×10 -5 M of acetone solution, and drop 3 μL in an area of ​​approximately 25mm 2 On the SERS substrate, after the acetone volatilized, the monochlorobiphenyl molecules had been adsorbed on the substrate.

[0078] 2. Use the BWTEK portable Raman spectrometer to measure the Raman spectrum of monochlorobiphenyl molecules. The laser wavelength is 785nm, the power is 300mW, the integration time is 20s, and 10 positions are randomly selected on each sample to measure the spectrum.

[0079] 3. Using the Kennard-Stone algorithm, the 10 Rama...


PUM

PropertyMeasurementUnit
lengthaaaaaaaaaa
diameteraaaaaaaaaa

Abstract

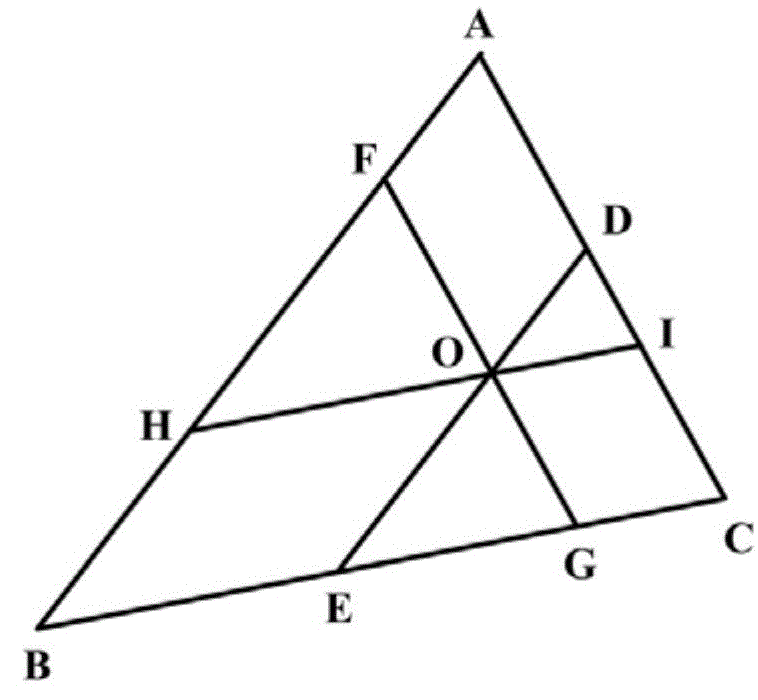
The invention discloses a method for realizing semi-quantitative analysis to trace mixture by use of the surface enhanced raman spectroscopy, and in particular relates to a qualitative identification method for carrying out semiquantitative analysis on a trace mixture by determinng Raman spectrum of a trace chemical substance based on surface enhanced Raman scattering effect and improving main component analysis. The method discosed by the invention adopts a lever law and a triangle parapllel line reading method to realize the semiquantitative analysis of the mixture components. The method can be used for analyzing mixture of entirely different chemical substances and can be used for analyzing mixture of homologous series. The method can realize semi-quantitative analysis to components of mixture based on the PCA (Principal Component Analysis) qualitative analysis and is a simple, rapid and accurate mixture identification method.

Description

technical field [0001] The invention belongs to the technical field of spectroscopic analysis, and in particular relates to a method for semi-quantitative analysis of trace mixtures by surface-enhanced Raman spectroscopy, specifically, the Raman spectroscopy of trace chemical substances based on the surface-enhanced Raman scattering effect. Semi-quantitative analysis of the mixture, and improve the qualitative identification method of principal component analysis, is to use the law of leverage and the parallel line reading method in the triangle to realize the semi-quantitative analysis of the composition of the mixture. Background technique [0002] Raman spectroscopy can reflect the structural information of molecules, thereby identifying the types of chemical substances. However, the intensity of Raman scattered light of a very small amount of molecules is very weak and difficult to be detected. Using the surface-enhanced Raman scattering (SERS) effect, the Raman signal ...

Claims


Application Information

Patent Timeline
Patent Type & Authority Applications(China)
IPC IPC(8): G01N21/65
Inventor 张政军侯孟婧
Owner 广西三环高科拉曼芯片技术有限公司
Learn More