Method for measuring polymer flooding relative permeability curve

A technology of relative permeability and measurement method, applied in the field of petroleum development, can solve the problems of large error, no polymer flooding, poor reliability of polymer flooding, etc.

Active Publication Date: 2016-06-29
CHINA UNIV OF PETROLEUM (EAST CHINA)
View PDF3 Cites 16 Cited by
  • Summary
  • Abstract
  • Description
  • Claims
  • Application Information

AI Technical Summary

Problems solved by technology

However, in the actual application process, because the experimental conditions cannot meet the assumptions of the mathematical model of the relative permeability curve, the experimental data measured according to the traditional unsteady method cannot truly reflect the seepage law of polymer flooding, so the calculated polymer Poor reliability of flooding relative permeability curve
In addition, the method of obtaining the relative permeability curve of polymer flooding by directly reducing the relative permeability of the water phase ignores the influencing factors in the process of polymer flooding, so the error is large and the practicability is poor.
To sum up, it can be seen that there is no reliable method for obtaining the relative permeability curve of polymer flooding at present, so it is necessary to propose a method for obtaining a more realistic and accurate relative permeability curve of polymer flooding, which provides a basis for the study of polymer flooding. Technical Support

Method used


Image

  • Method for measuring polymer flooding relative permeability curve
  • Method for measuring polymer flooding relative permeability curve
  • Method for measuring polymer flooding relative permeability curve

Examples


Embodiment 1

[0028] Embodiment 1: Measure the basic parameters of the polymer flooding core model, including core length, core diameter, porosity, permeability, irreducible water saturation, residual oil saturation; measure the basic physicochemical parameters of the polymer used, including polymer solution Viscosity, adsorption capacity, residual resistance coefficient, inaccessible pore volume.

[0029] Put the core into the core holder, use a constant temperature box to keep it at a constant temperature (45°C) for 8 hours, set the confining pressure to 3.5Mpa, the back pressure to 300Kpa, and use a molecular weight of 1500╳10 4 The polymer was formulated into an experimental polymer solution with a concentration of 1000mg / L, and the experimental operation was carried out to measure the core and the basic experimental parameters of the polymer. The measurement results are shown in Table 1.

[0030] Table 1 Basic parameters

[0031] parameter name

Embodiment 2

[0032] Example 2: Carry out polymer flooding experiments and record production test data. The specific process is:

[0033] a. the rock core after the end of the experiment in Example 1 is washed, saturated with formation water,

[0034] b. Carry out oil-displacement water in the form of displacement speed from small to large, until the water production no longer increases, and calculate the irreducible water saturation S wc =0.285;

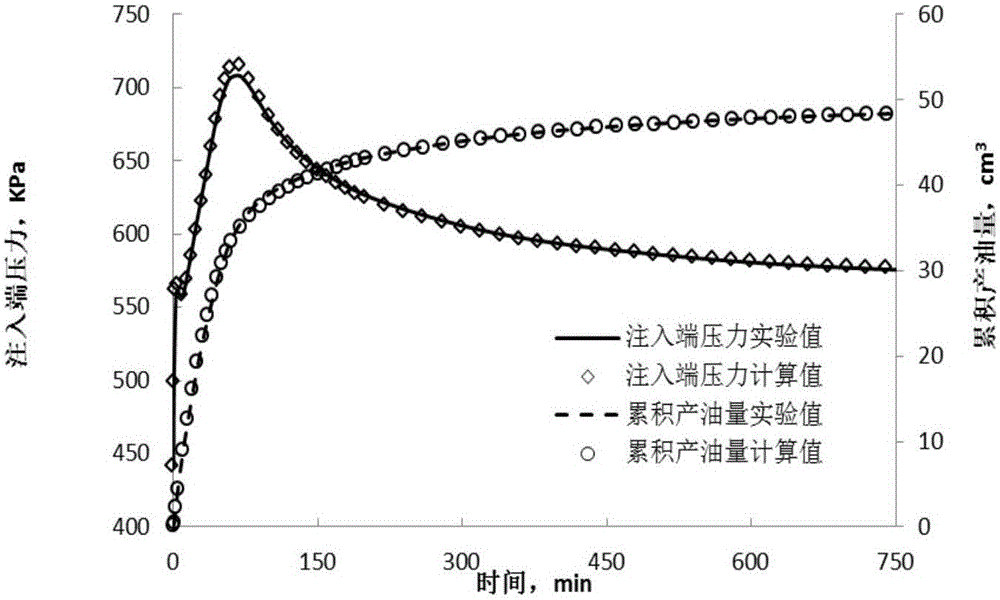
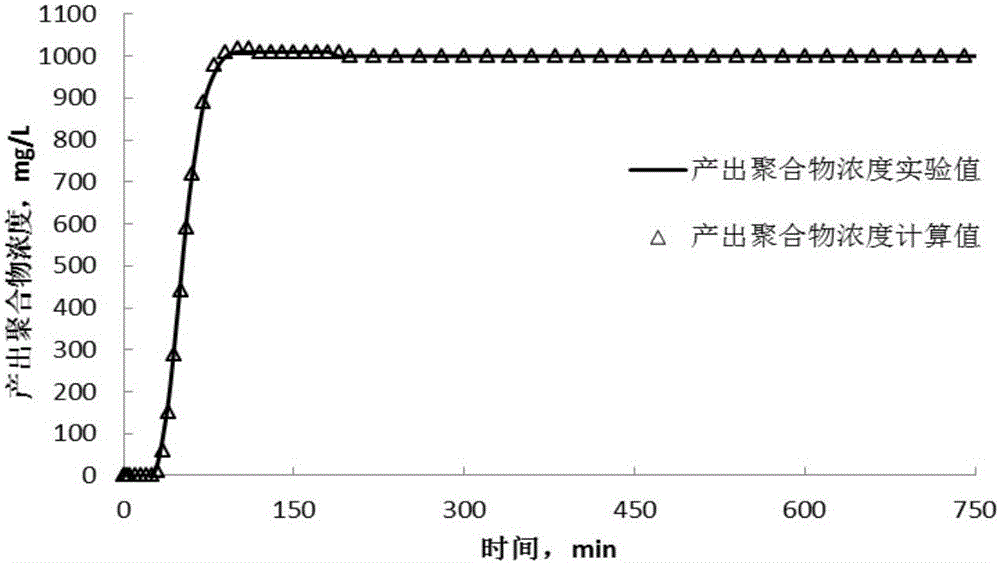
[0035] c. Carry out the polymer flooding process at a constant displacement rate of 1ml / min, record the injection end pressure at different times, the cumulative oil production and the output polymer concentration at the corresponding time, and the displacement process when the oil production no longer increases At the end, calculate the polymer flooding residual oil saturation S orw = 0.215.

Embodiment 3

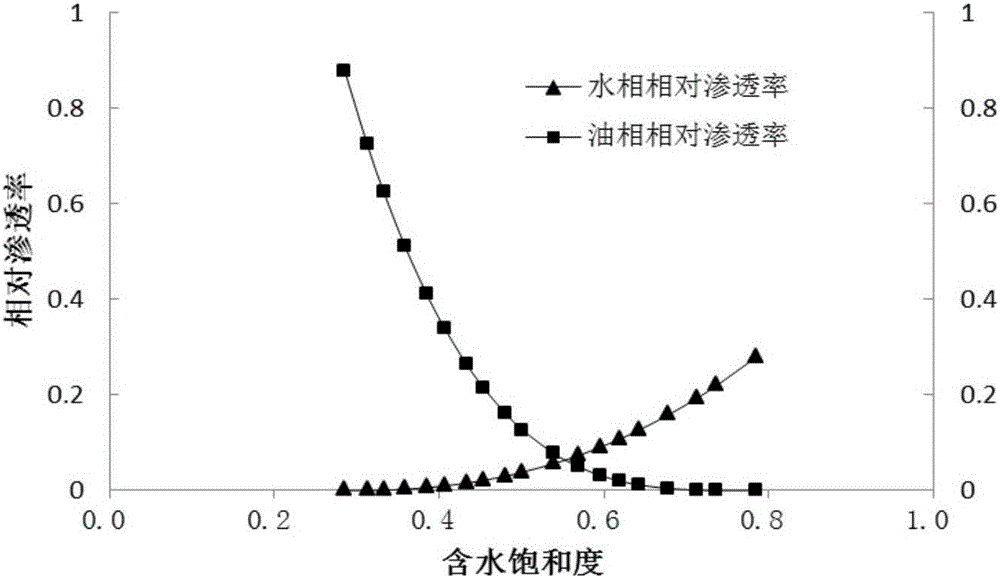
[0036] Embodiment 3: Using the production dynamic data in Embodiment 2 to carry out automatic history fitting to obtain the optimal polymer flooding relative permeability curve. Specific steps are as follows:

[0037] a. Firstly, normalize the production dynamic data, and take the pressure at the injection end as an example for normalization. Injection end pressure maximum D e,maxp =303.62KPa,D e,min,p =296.33KPa, the tenth pressure data D e,p (10)=300.96KPa, then the normalization process is:

[0038] D p ( 10 ) = 300.96 K P a - 296.33 K P a 303.62 K P a - 296.33 K P a ...


PUM


Abstract

The invention discloses a method for measuring a polymer flooding relative permeability curve. The method comprises the following steps: first carrying out a polymer core flooding experiment to obtain production experiment data at different moments, then establishing a fitting target function and a polymer flooding relative permeability curve model by taking the obtained production experiment data as fitting data, and finally continuously regulating a parameter of the relative permeability curve model by virtue of an automatic history matching algorithm through a numerical simulator until a value of the fitting target function reaches an allowable error range, so as to obtain the optimal polymer flooding relative permeability curve. The method is simple and easy to operate, and help may be provided for research on polymer flooding permeability rules.

Description

technical field [0001] The invention relates to a method for measuring the relative permeability curve of polymer flooding, which belongs to the technical field of petroleum development. Background technique [0002] Polymer flooding is an important tertiary oil recovery technology. In this technology, water-soluble polymers are added to the injected water as oil displacement agents to increase the viscosity of the injected water phase, reduce the water phase permeability, and improve the oil-water mobility ratio. The purpose of enhancing oil recovery. At present, polymer flooding technology is widely used in mine fields. Among them, the relative permeability curve of polymer flooding is the basis of polymer flooding reservoir analysis and numerical simulation research, and it is particularly important to obtain the relative permeability curve of polymer flooding accurately. [0003] At present, the oil-water relative permeability curve of polymer flooding is mainly obtain...

Claims


Application Information

Patent Timeline
Patent Type & Authority Applications(China)
IPC IPC(8): E21B43/22E21B47/00
CPCE21B43/16E21B47/00
Inventor 侯健刘永革杨勇曹绪龙刘岭岭周康戴涛郭兰磊曹伟东付红斐杜庆军李淑霞姚传进夏志增
Owner CHINA UNIV OF PETROLEUM (EAST CHINA)
Why Eureka
Try Eureka