Quantitative prediction method of spinning quality

A forecasting method and quality technology, applied in forecasting, instruments, manufacturing computing systems, etc., can solve problems such as unfavorable costs, time, and heavy workload

Active Publication Date: 2017-02-15
DONGHUA UNIV +1
View PDF3 Cites 6 Cited by
  • Summary
  • Abstract
  • Description
  • Claims
  • Application Information

AI Technical Summary

Problems solved by technology

However, there are many rollers in the spinning process, and the whisker curves of each roller are not the same. Direct measurement is not only a lot

Method used


Image

  • Quantitative prediction method of spinning quality
  • Quantitative prediction method of spinning quality
  • Quantitative prediction method of spinning quality

Examples


Embodiment 1

[0132] Example 1: Prediction of the percentage of floating fibers and the amount of fibers held simultaneously by double rollers in the combing process of cotton spinning

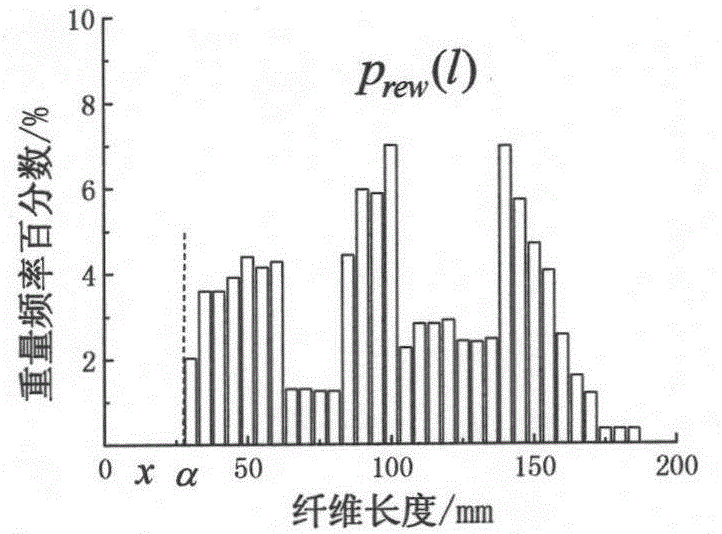
[0133] Material: select fine-staple cotton with an average weight and length of 27.2 mm to produce combed cotton yarn.

[0134] Using the AFIS system to test the fiber length weight frequency distribution, such as Figure 4 shown.

[0135] Given that the noil limit α of the combed cotton spinning process is 16 mm, the draft ratio E=13, and the short fibers whose fiber length is less than the short staple limit 16 mm all fall off. Using formula (5) and formula (2), the above Figure 4 The length, weight, frequency and density distribution information of the raw materials in the calculation calculates the whisker curves of fibers before and after nodding, that is, the whisker curves of the fibers held by the input roller and the output roller (after nodding), such as Figure 5 shown.

[0136] Then, by the...

Embodiment 2

[0138] Example 2: Prediction of the percentage of floating fibers and the amount of fibers held simultaneously by double rollers in the worsted spinning process

[0139] Material: Australian fine wool with a fiber diameter of 19.77 microns and a Hauteur length of 77 mm is selected to design and produce worsted wool spinning. The following is the quantitative basis for the design of wool worsted first needle carding process.

[0140] The weight frequency density distribution of fiber length is measured with Almeter system, the results are as follows Figure 7 shown.

[0141] The noil rate in the first needle-carding process of worsted spinning is designed to be 3%, and the historical data of noil distribution under the 3% noil rate is shown in Table 1. The napping ratio of an interval refers to the percentage of the weight of short fleece dropped in this interval to the total weight of fibers in this interval.

[0142] Table 1 Interval nodding ratio of the first needle cardin...

Embodiment 3

[0147] Embodiment 3: Design scheme screening of wool combing raw material

[0148] Material: 40% mohair and 60% Australian fine wool are used for blending to produce mohair blended all-wool fabric. Among them, the species of mohair has been selected, its hauteur length is 60.5mm, and its average diameter is 23.43μm. Australian wool is selected in the range of 3 varieties: 1 # The haut length of Australian wool is 70.25mm, and the average diameter is 16.61μm; 2# The length of Omahaut is 75.10mm, and the average diameter is 16.91μm; 3 # The length of the Omahaut is 81.75mm, and the average diameter is 18.75μm.

[0149] The measurement method of fiber length and the fiber interval nodding ratio of wool combing head road needle carding process are the same as embodiment 2, and record the weight frequency distribution situation and the whisker cluster curve of each fiber length, as Figure 10 (A) to Figure 10 (D) and Figure 11 shown.

[0150] 40% mohair with 60% 1 # or 2 ...


PUM

PropertyMeasurementUnit
Diameteraaaaaaaaaa
Lengthaaaaaaaaaa
Lengthaaaaaaaaaa

Abstract

The present invention relates to a quantitative prediction method of spinning quality. According to process parameters like a length distribution feature and a blending ratio of a fiber raw material, a fall short fiber boundary or fiber fall rate controlled by the spinning process, and a roller gauge, the quantitative prediction method can accurately calculate floating fiber contents in stretch areas of spinning steps like drawing, combing, roving, and fine spinning, and a quantitative relationship between a fiber amount in holding of both front and rear rollers and the roller gauge. Through adoption of the quantitative prediction method, the floating fiber content between the front and rear rollers and fiber percentage in holding of both rollers under process conditions like different roller gauges, different raw materials, different blending ratios and different fiber fall rates can be calculated, an optimal scheme for fiber raw material selection, blending ratio design, roller gauge and fiber fall rate and other process parameters can be designed, and the method has a role of replacing spinning test and trial manufacture in the prior art.

Description

technical field [0001] The invention relates to a quantitative prediction method of spinning quality. Specifically, it is based on the length distribution characteristics of fiber raw materials, blending ratio, and process parameters such as the limit of short fibers or tow rate and roller gauge controlled by the spinning process. Quantitatively predict the floating fiber content in the drafting zone of the spinning process such as drawing, combing, roving, and spun yarn, and the accurate calculation method for the quantitative relationship between the amount of fibers held by the front and rear rollers and the roller gap. The two are to directly determine the yarn Key factors for quality indicators such as evenness, strength, and yarn defects. Background technique [0002] In spinning engineering, the input and output products of many processes are fiber slivers, and the fiber flow continuously inhaled by the blowing process and the output cotton lap can be regarded as fibe...

Claims


Application Information

Patent Timeline
IPC IPC(8): G06F17/50G06Q10/04G06Q50/04
CPCG06F30/20G06F2113/12G06F2119/18G06Q10/04G06Q50/04Y02P90/30
Inventor 王府梅吴美琴曹贻儒刘美娜
Owner DONGHUA UNIV
Why Eureka
Try Eureka