Method and system for preparing synthetic multicomponent biotechnological and chemical process samples
A biotechnology and multi-component technology, applied in the field of synthesizing multi-component samples, can solve the problems of insufficient sensor calibration, poor calibration results of spectral sensors, etc.
- Summary
- Abstract
- Description
- Claims
- Application Information
AI Technical Summary
Problems solved by technology
Method used
Image
Examples
example 1
[0138] Example 1 concerns the synthesis of multicomponent fermentation samples. This example is intended to show step-by-step the implementation of parts of the invention in a multi-component (several analyte) complex system without limiting its use in other systems not covered by this example.
[0139]A good example of the application of the present invention is its use to simulate fed-batch fermentation, eg, Chinese Hamster Ovary (CHO) mammalian cell culture. Such fed-batch fermentations contain multi-component complex matrix analytes that are dependent on cell activity and imposed process conditions such as feed, feed rate, pH and temperature profile, among others.
[0140] The complex nature of these systems, the need to monitor them has long been an integral part of industrial processes, as this allows for increased automation and the introduction of advanced control schemes. In recent years, Process Analytical Technology (PAT) has emerged as a driving force to overcome ...
example 2
[0170] Example 2 involves increasing the number of synthetic multicomponent fermentation samples in order to better capture process dynamics.
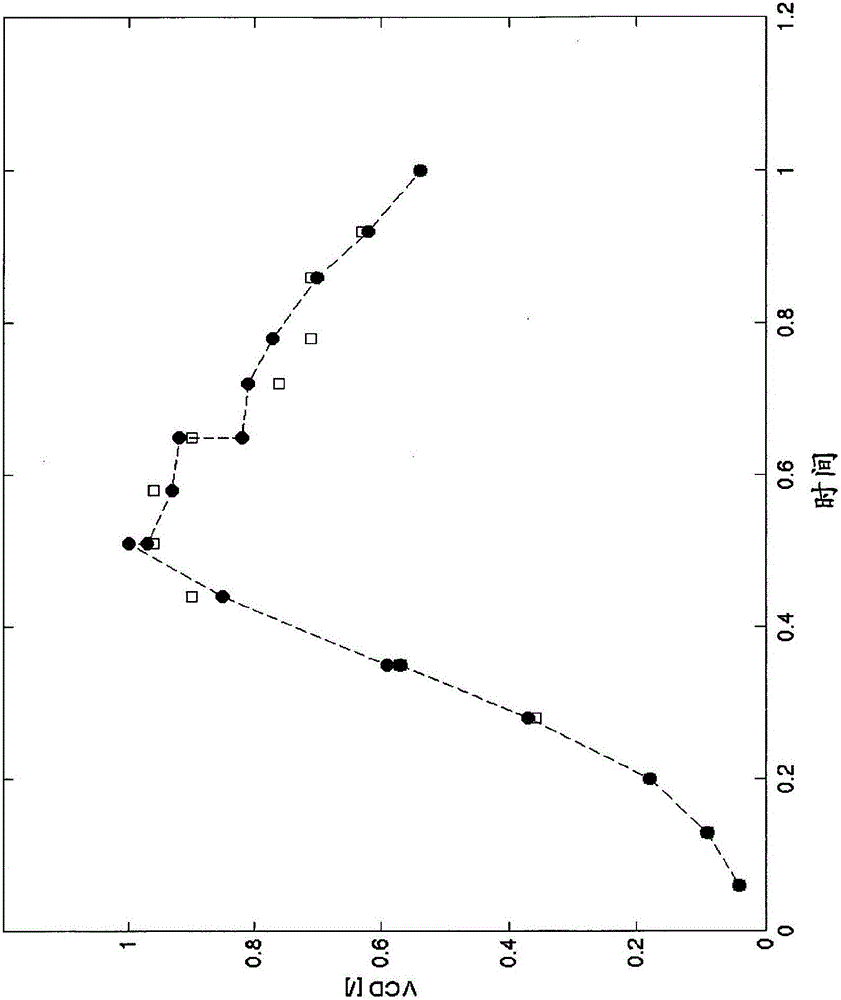
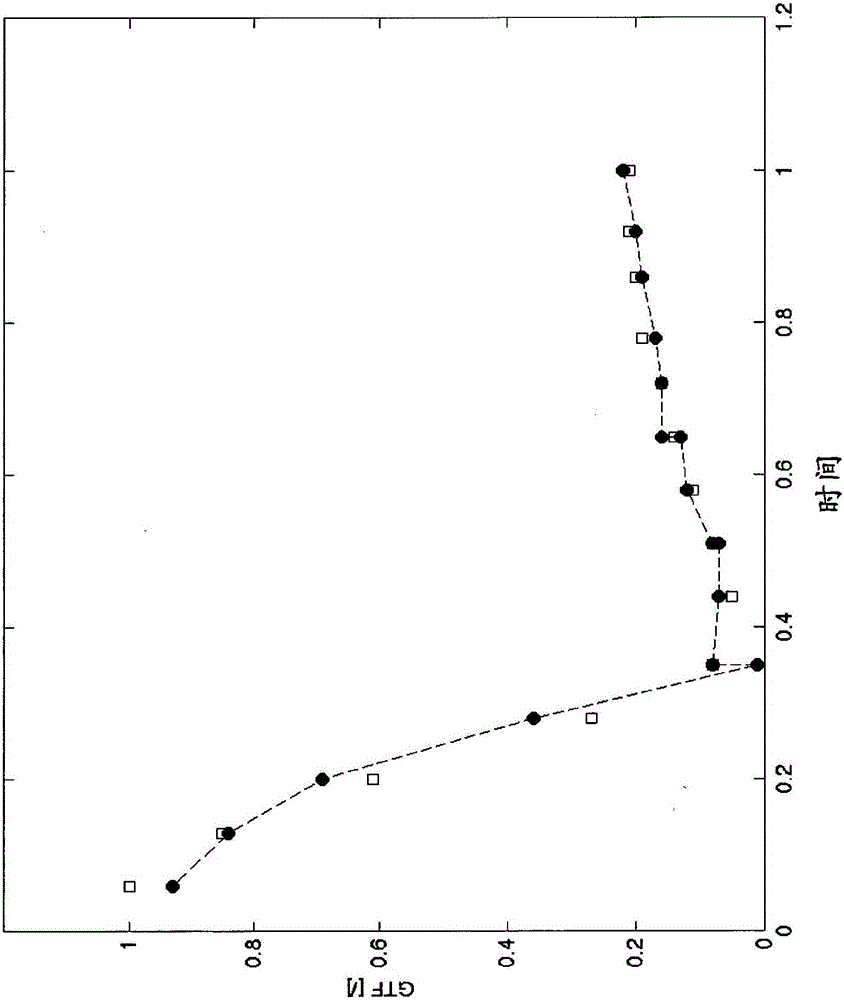
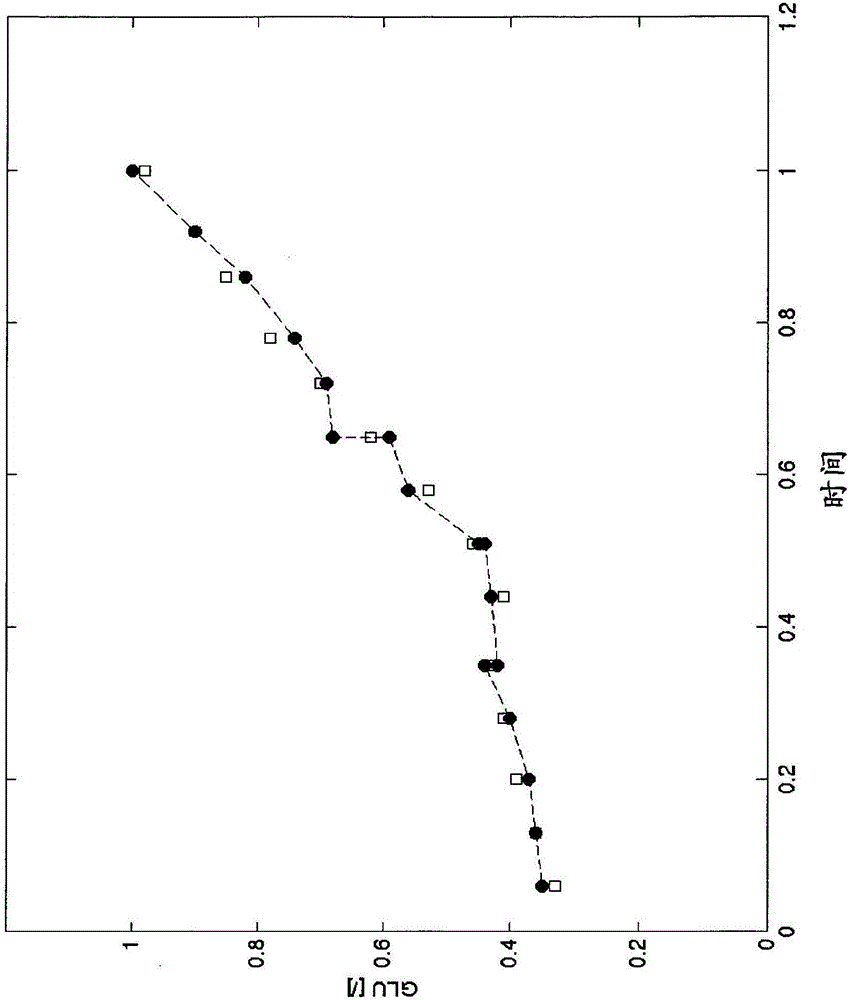
[0171] One of the disadvantages of off-line measurements in a dynamic process is the small amount of sample available for measurement when compared to the variation of a specific analyte. This is important when dealing with in-line sensors such as near- and mid-infrared spectrometers in particular. Therefore, the current example uses parts of the solution provided in Example 1 to increase the number of samples that can be used to simulate process steps. This is useful if very deterministic distribution curves are required in some parts of the process, in particular it is useful to increase the number of samples in undersampled process stages. A good example of this kind of undersampling can be found in figure 1 The GTF distribution curve in . As can be seen, for the first data subset interval (from 0.06 to 0.35 time units), the majo...
example 3
[0180] Example 3 involves generating data samples to make the calibration model more accurate and robust.
[0181] The examples presented so far represent process dynamics and thus have the same behavior as process samples. The fermentation profile naturally preserves the metabolically introduced concentration dependence between the cell substrate and metabolites. Indeed, analysis of the correlations of the analytes presented in the offline data (Table 1) showed that these correlations were significant. Since the data generated in Examples 1 and 2 closely modeled the fermentation profile, it is also expected that the correlation would still hold for those synthetic multicomponent samples. As can be seen from Table 8, some analytes and culture parameters showed high correlation (0.8<|R|<1), moderate correlation (0.6<|R|<0.8) or slight correlation (0.5 <|R|<0.6), while the other analytes and culture parameters did not show any correlation at all (|R|<0.5). Among them, highly ...
PUM
 Abstract
Description
Claims
Application Information
 - R&D
- Intellectual Property
- Life Sciences
- Materials
- Tech Scout
- Unparalleled Data Quality
- Higher Quality Content
- 60% Fewer Hallucinations
Browse by: Latest US Patents, China's latest patents, Technical Efficacy Thesaurus, Application Domain, Technology Topic, Popular Technical Reports.
© 2025 PatSnap. All rights reserved.Legal|Privacy policy|Modern Slavery Act Transparency Statement|Sitemap|About US| Contact US: help@patsnap.com


