Plasma spectroscopic analysis method and plasma spectroscopic analyzer
A plasma and analysis method technology, applied in the field of plasma spectroscopic analysis and plasma spectroscopic analysis device, can solve the problems of foreign matter mixed in, analysis result changes, low analysis sensitivity, etc., and achieve the effect of suppressing analysis error and high analysis sensitivity
- Summary
- Abstract
- Description
- Claims
- Application Information
AI Technical Summary
Problems solved by technology
Method used
Image
Examples
Embodiment 1
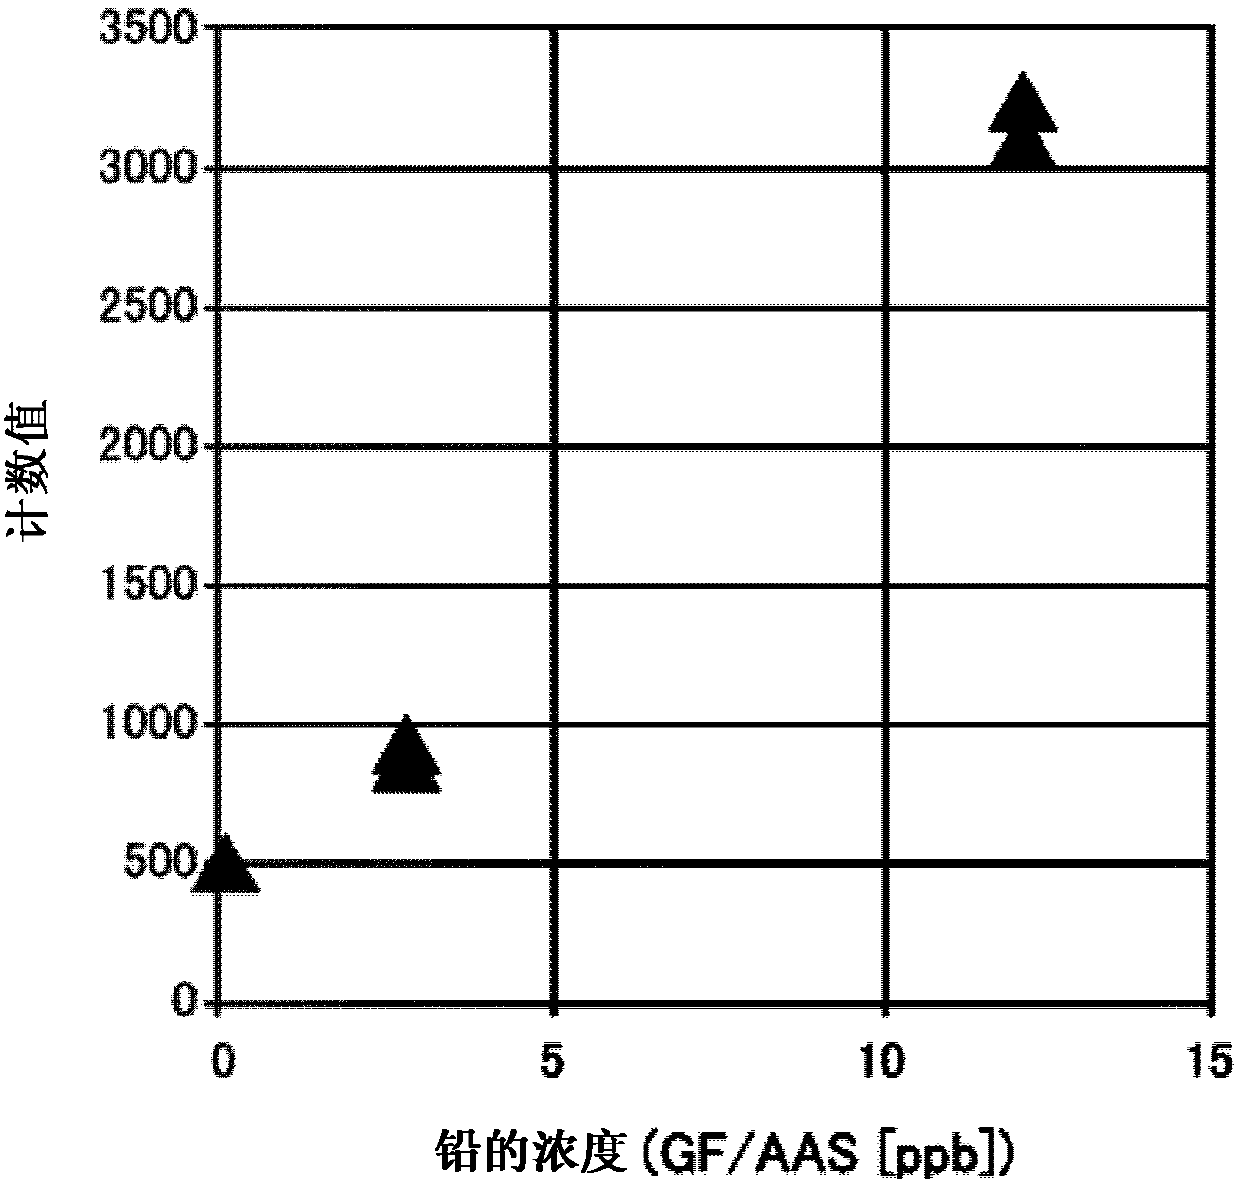
[0099] It was confirmed that the analysis method of the present disclosure can analyze lead in a urine sample with a small deviation in a wide range of concentrations.
[0100] (1) Plasma spectroscopic analysis device
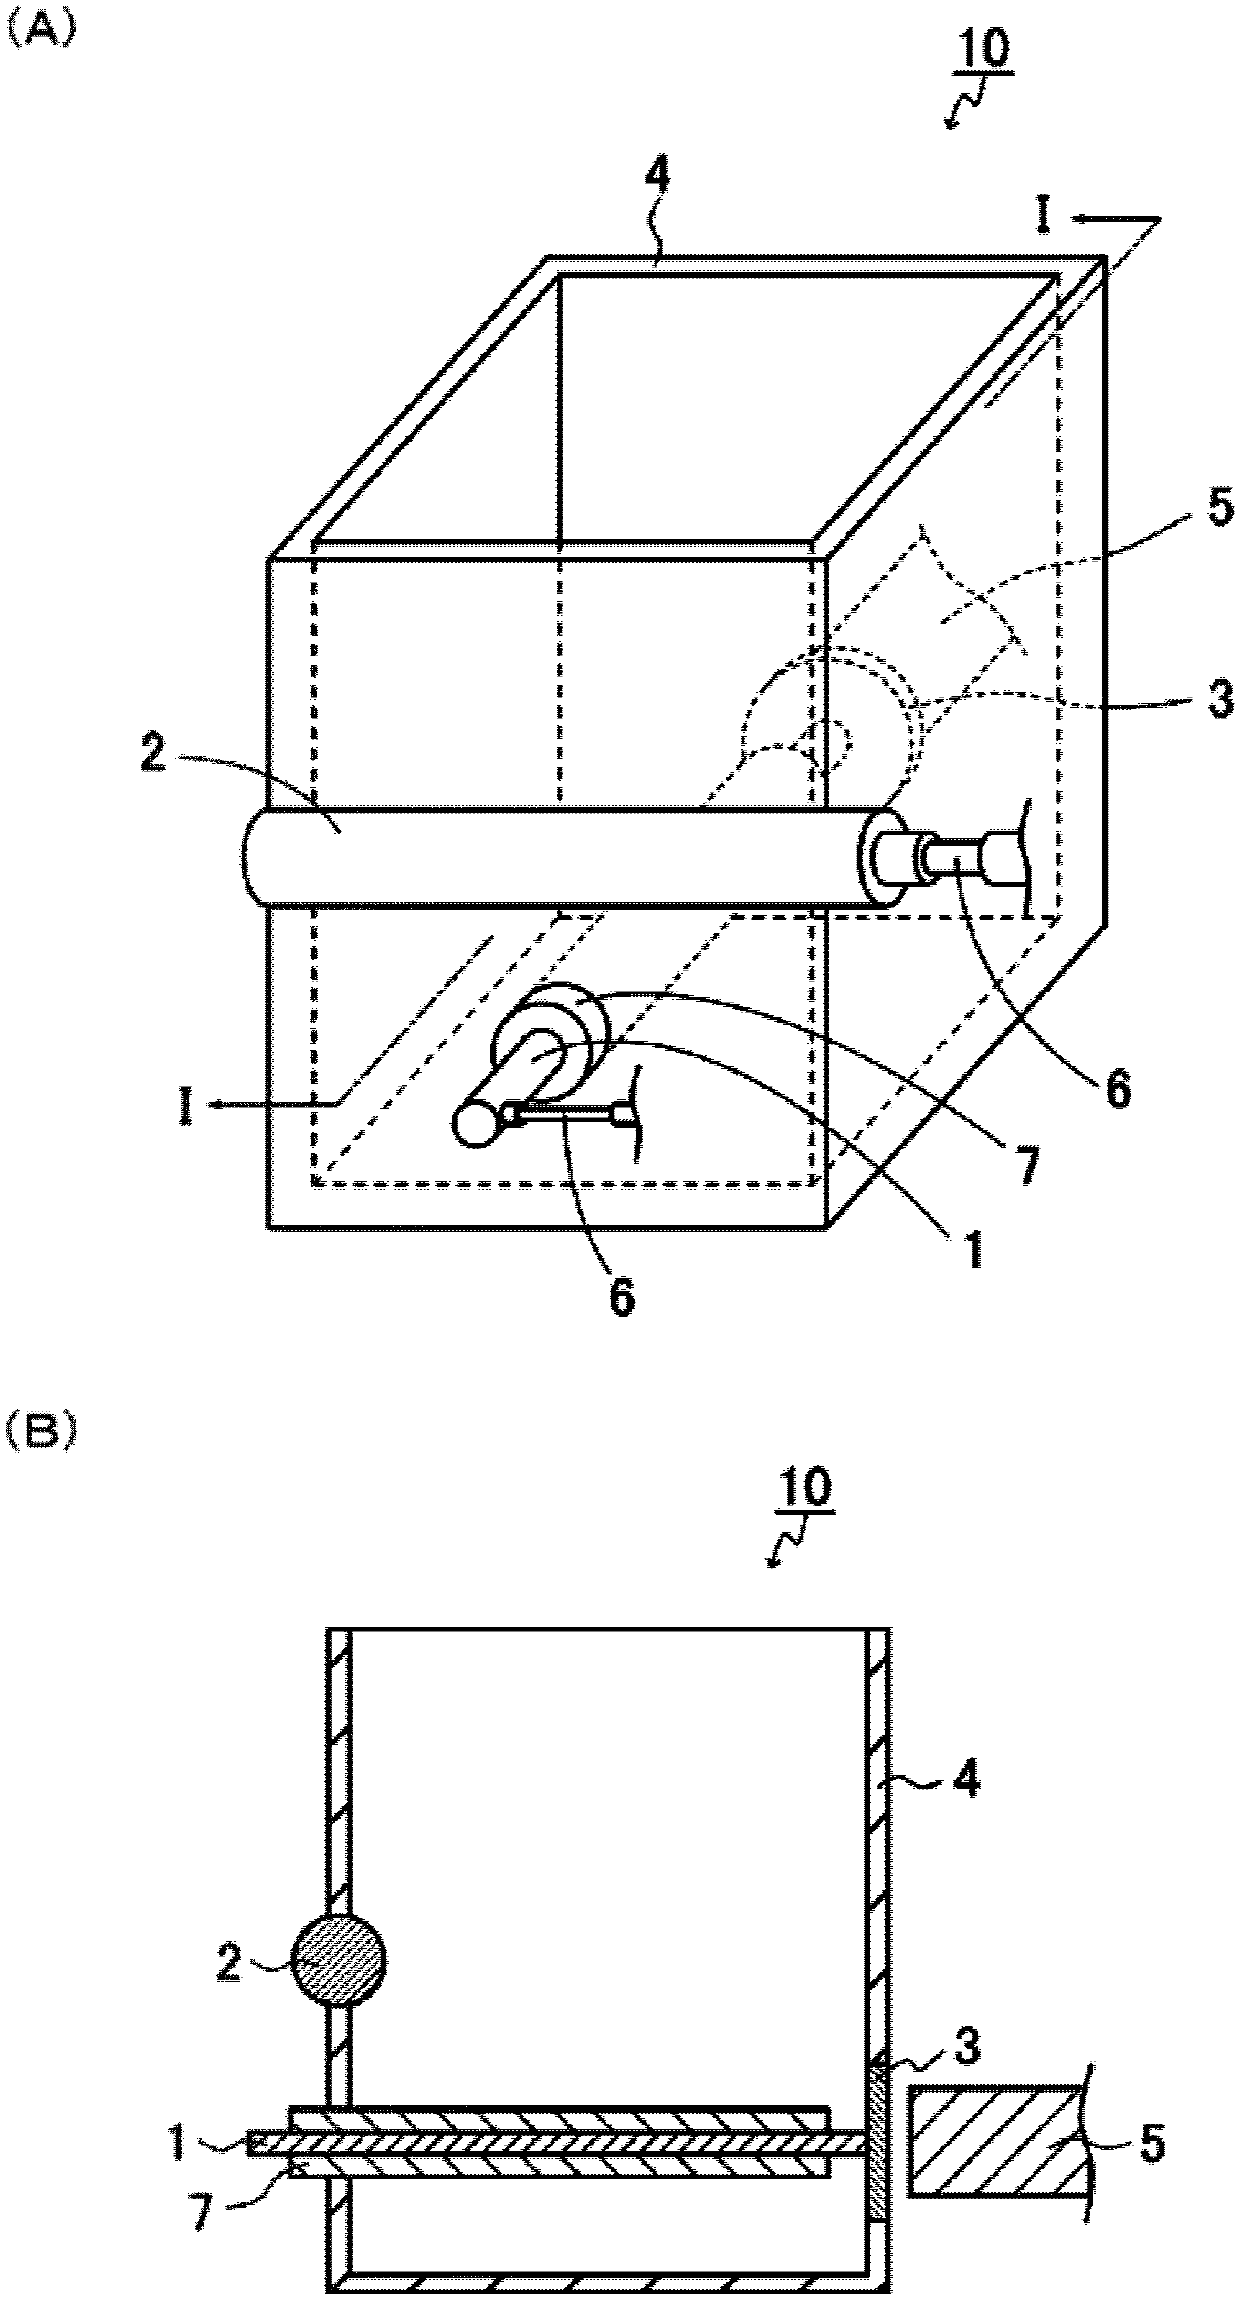
[0101] The analysis device of the above embodiment was prepared. Specifically, a bottomed columnar transparent PMMA container (35 mm in height×8 mm in width×6.5 mm in depth) was prepared. Quartz glass is placed on the side of the container 4 . The electrode 1 and the electrode 2 are arranged in the container 4 . The electrode 1 and the electrode 2 are respectively connected to a constant current unit 6 (galvanostat). The electrodes 1 and 2 are arranged horizontally with respect to the bottom surface of the container 4 . In addition, the tip of the electrode 1 is placed in contact with the quartz glass on the side surface of the container 4 . As the electrode 1, a nickel-chromium alloy electrode rod with a diameter of 0.1 mm and a length of 25 mm was used. ...
Embodiment 2
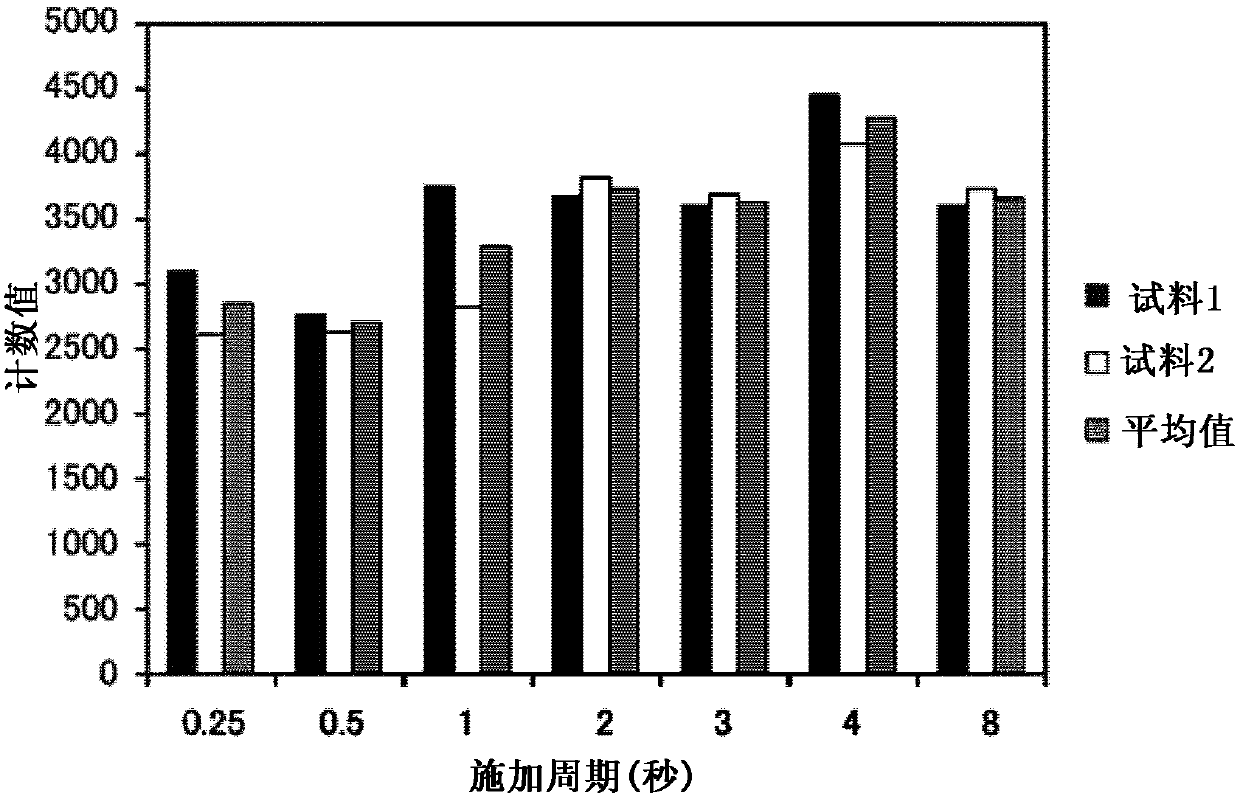
[0117] It was confirmed that the lead in the urine sample can be analyzed with little variation in different application periods.
[0118] Under the concentrating conditions of Example 1 (2), except that the application period is 0.25 seconds, 0.5 seconds, 1 second, 2 seconds, 3 seconds, 4 seconds or 8 seconds, the same as in Example 1 (2) Likewise, the count value (n=2) was measured.
[0119] The result is as image 3 shown. image 3 is a graph showing count values at different cycles. exist image 3 In , the horizontal axis represents the application period, and the vertical axis represents the count value. Such as image 3 As shown, the effect was produced from the application period of 0.25 seconds, and the count value increased as the application period became longer. Also, higher count values were obtained at long application periods of more than 2 seconds. From the above results, it can be seen that the analysis method of the present disclosure can analyze th...
PUM
| Property | Measurement | Unit |
|---|---|---|
| diameter | aaaaa | aaaaa |
| length | aaaaa | aaaaa |
| diameter | aaaaa | aaaaa |
Abstract
Description
Claims
Application Information
 - R&D
- Intellectual Property
- Life Sciences
- Materials
- Tech Scout
- Unparalleled Data Quality
- Higher Quality Content
- 60% Fewer Hallucinations
Browse by: Latest US Patents, China's latest patents, Technical Efficacy Thesaurus, Application Domain, Technology Topic, Popular Technical Reports.
© 2025 PatSnap. All rights reserved.Legal|Privacy policy|Modern Slavery Act Transparency Statement|Sitemap|About US| Contact US: help@patsnap.com


