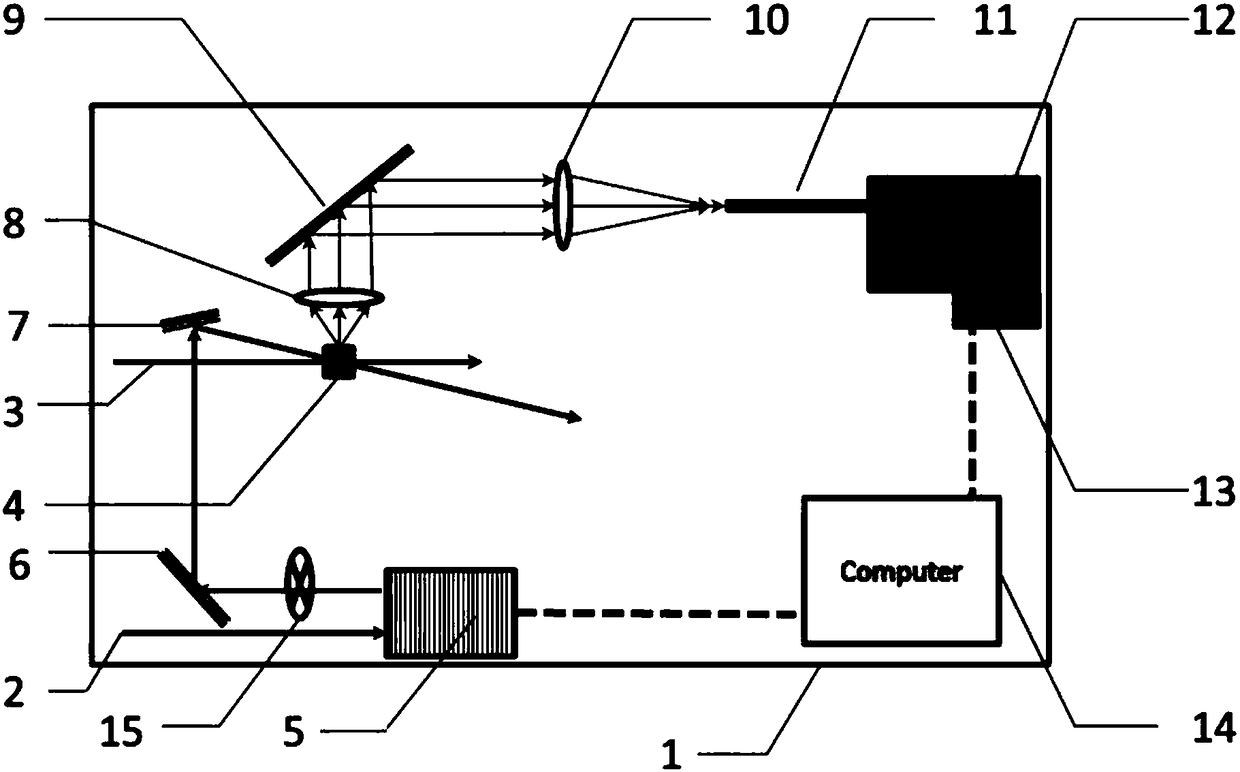
Integral femtosecond time resolution fluorescence lifetime measurement spectrograph
A time-resolved fluorescence and spectrometer technology is applied in the field of integrating femtosecond time-resolved fluorescence lifetime measurement spectrometers, which can solve the problems of reduced application and high price.
- Summary
- Abstract
- Description
- Claims
- Application Information
AI Technical Summary
Problems solved by technology
Method used
Image
Examples
Embodiment 1
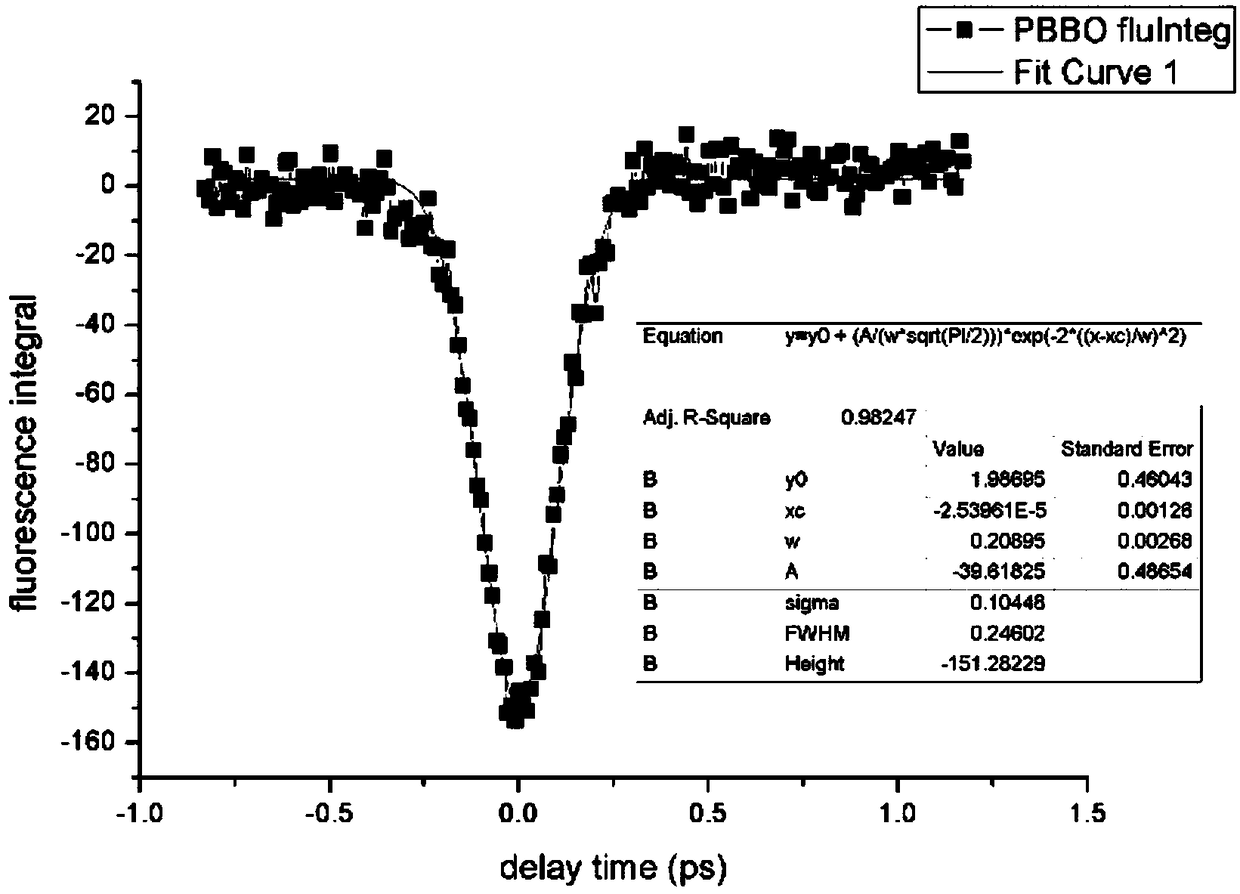
[0035] Investigate the time resolution capability of the integrated femtosecond time-resolved fluorescence lifetime measuring spectrometer of the present invention in the performance of the integrated femtosecond time-resolved fluorescence lifetime, adopting 1mmol / L of PBBO dye ethanol solution as test sample , to measure integral femtosecond time-resolved fluorescence lifetime signals. The peak of the absorption spectrum of PBBO is around 320nm, only when the two light pulses of the 490nm pump beam and the 800nm probe beam coincide in space and time at the sample in the sample cell, the fluorescence of PBBO will be excited, thus The time-resolved response function of the integral femtosecond time-resolved fluorescence lifetime measurement spectrometer can be obtained. The instrument response function obtained in this embodiment is fitted with a Gaussian function, and the obtained standard deviation is 0.104 picoseconds, and the full width at half maximum is 0.246 picosecond...
Embodiment 2
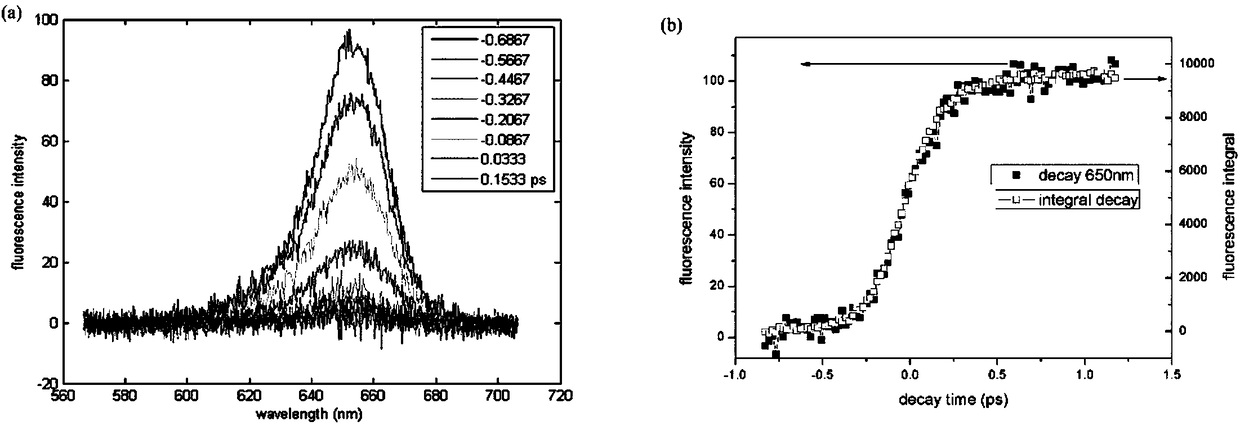
[0037] For the investigation of the fluorescence intensity detection limit performance of the integrated femtosecond time-resolved fluorescence lifetime measurement spectrometer described in the invention, the 0.1mmol / L ethanol solution of OX750 dye is used as the sample; the pump light is 490nm, 1.5mW; the probe light is 800nm , 1mW. Measure the integrated femtosecond time-resolved fluorescence lifetime measurement spectrum of the sample, see the attached image 3 . Among them, the left figure (a) is the evolution curve of the measured OX750 fluorescence spectrum with the delay time; the right figure (b) includes the decay curve of the fluorescence intensity at a single wavelength of 660nm without integrating the OX750 fluorescence peak with the delay time (blue (red solid box), and the decay curve of integrated fluorescence intensity versus delay time obtained after integrating the OX750 fluorescence peak (red empty box). It can be seen that the noise of the curve after in...
PUM
 Abstract
Description
Claims
Application Information
 - R&D
- Intellectual Property
- Life Sciences
- Materials
- Tech Scout
- Unparalleled Data Quality
- Higher Quality Content
- 60% Fewer Hallucinations
Browse by: Latest US Patents, China's latest patents, Technical Efficacy Thesaurus, Application Domain, Technology Topic, Popular Technical Reports.
© 2025 PatSnap. All rights reserved.Legal|Privacy policy|Modern Slavery Act Transparency Statement|Sitemap|About US| Contact US: help@patsnap.com


