

Spectrum sensing algorithm based on variational mode decomposition
A variational mode decomposition and spectrum sensing technology, which is applied in transmission monitoring, electrical components, transmission systems, etc., can solve problems such as signal interference, achieve the effects of improving performance, reducing signal-to-noise ratio, and improving detection performance
- Summary
- Abstract
- Description
- Claims
- Application Information
AI Technical Summary
Problems solved by technology
Method used
Image

Examples
Embodiment Construction
[0027] The spectrum sensing algorithm based on variational mode decomposition of the present invention will be further described below in conjunction with the accompanying drawings and specific embodiments: It should be noted that the embodiments used here are only for explaining the present invention, and the present invention is not limited thereto Example.
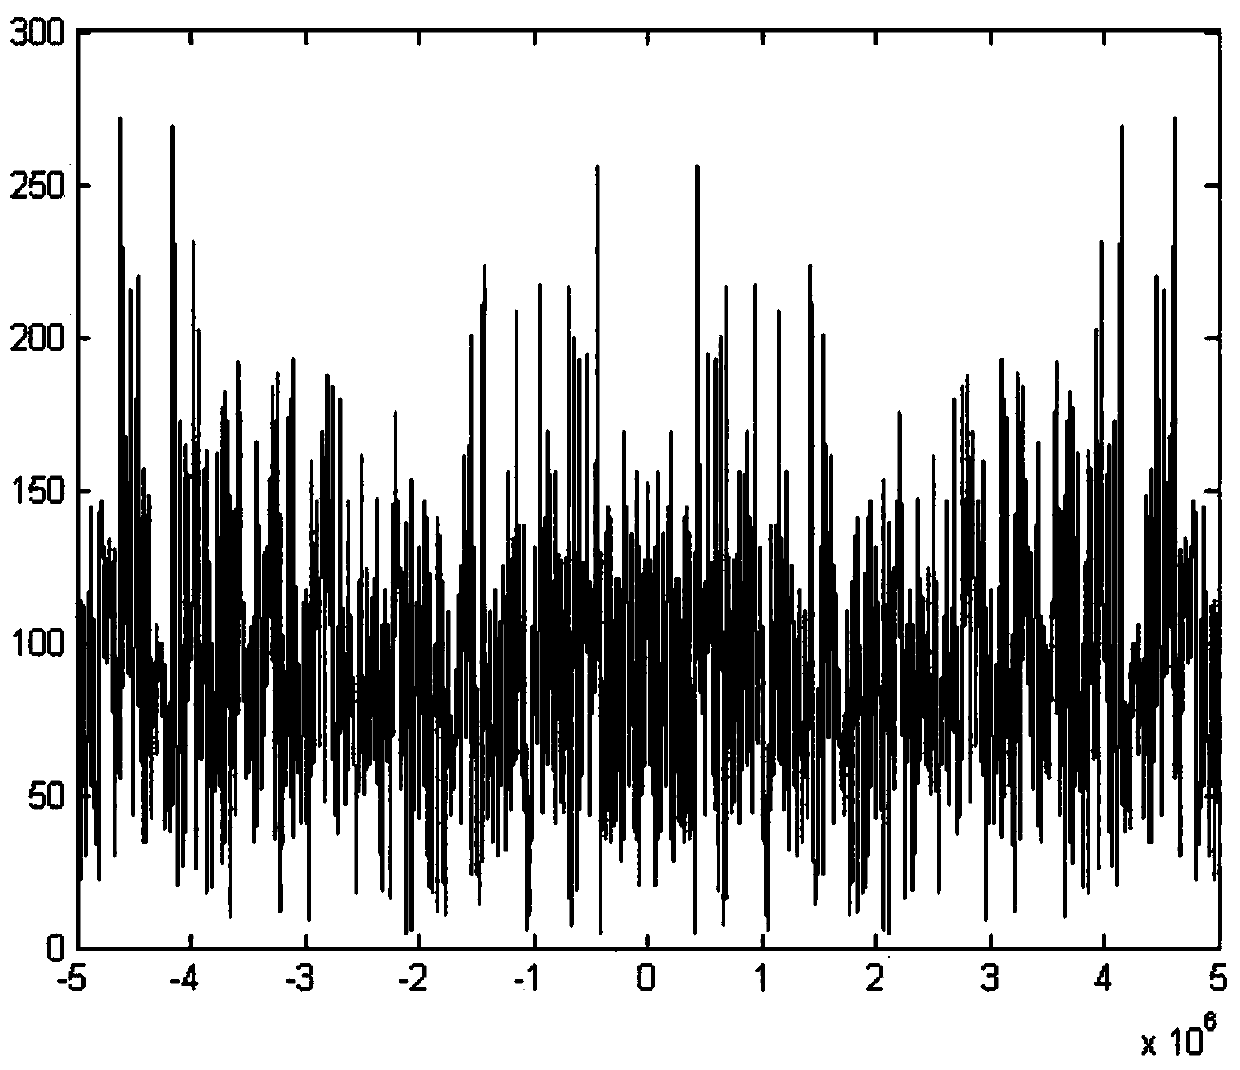
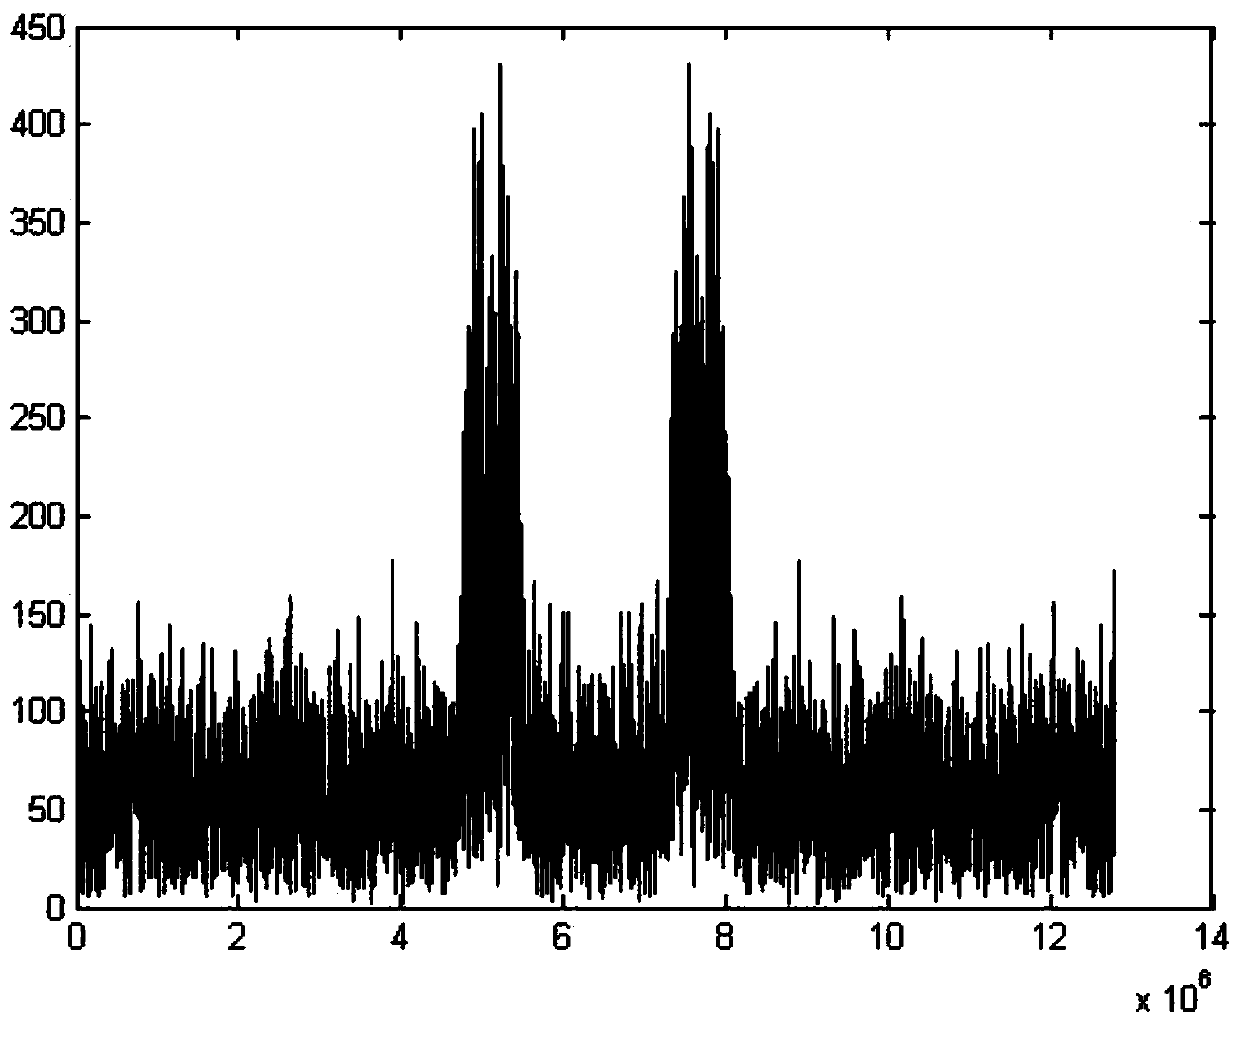
[0028] Step 1, first generate the simulation signal BPSK.
[0029] Used embodiment in the present invention, at first produces BPSK signal, its symbol rate R b =0.64MHz, carrier frequency f c = 5.12MHz, the sampling rate is f s=12.8MHz, the number of symbols is Len=200, the number of sampling points is N=Len*f s / R b .
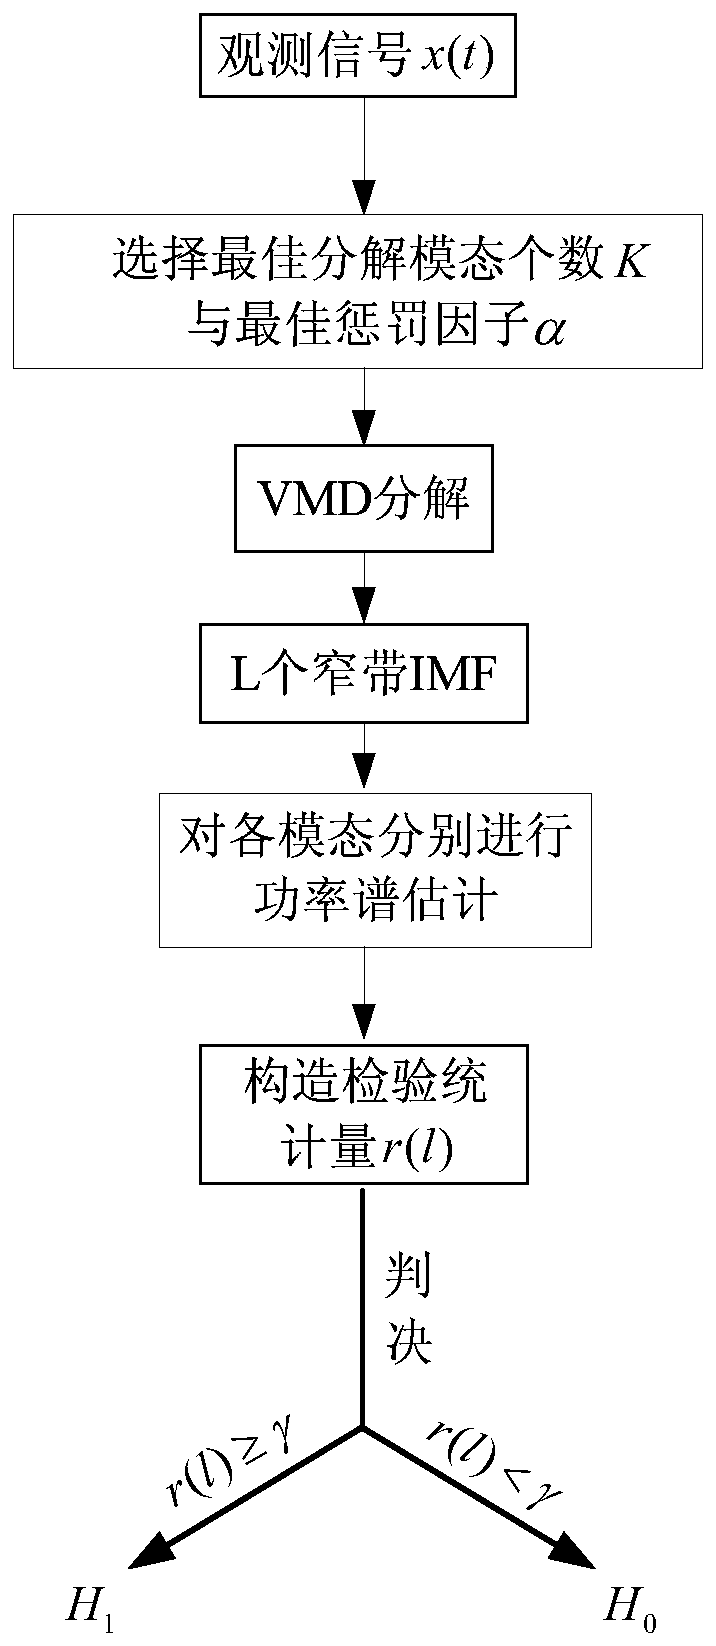
[0030] Step 2: Determine the optimal number of modal decompositions K by analyzing the change curve of the characteristic parameter mean value of the instantaneous frequency of the component, and set an appropriate penalty factor a.
[0031] Depend on Figure 4 It can be seen that when the number...
PUM
 Abstract
Description
Claims
Application Information