System and method for acquisition and processing of residence time distribution measurement experimental data

A technique for experimental data, residence time

Inactive Publication Date: 2020-01-24
HUAZHONG UNIV OF SCI & TECH
View PDF5 Cites 2 Cited by
  • Summary
  • Abstract
  • Description
  • Claims
  • Application Information

AI Technical Summary

Problems solved by technology

[0008] (1) The entire experiment process uses fixed time intervals to collect data, and it is impossible to flexibly and independently set the data collection time intervals of different experimental time periods according to the characteristics of the experimental system, resulting in the collection of a large amount of repetitive and unnecessary data in the middle and later stages of the experiment, which greatly Increased post-processing workload of experimental data
[0009] (2) In the experiment, there is no real-time measurement of other factors (such as fluid temperature) that affect the fluid conductivity value other than the tracer concentration, which makes it possible to calculate the possibility of large deviations in the flow model parameters when processing the experimental data in the later stage greatly increased, leading to the failure of the experiment
[0010] (3) The correct time for the termination of the experiment cannot be judged intelligently through the experimental data, which also affects the calculation results to a certain extent
[0011] (4) The existing experiments take a long time, have a large number of experimental groups, a large amount of experimental data, a large amount of calculation, and the need to draw the experimental data into a curve, which significantly increases the difficulty of successfully completing the experiment.
Therefore, in such a system with a fixed data acquisition time interval, some valid data will be lost because the signal changes too fast to collect, or multiple repeated acquisitions will be performed because the signal does not change during the period, which will greatly increase the post-processing workload.

Method used


Image

  • System and method for acquisition and processing of residence time distribution measurement experimental data
  • System and method for acquisition and processing of residence time distribution measurement experimental data
  • System and method for acquisition and processing of residence time distribution measurement experimental data

Examples


Embodiment 1

[0227] Residence Time Distribution Determination Experiment

[0228] 1. Theory and device of residence time distribution measurement experiment

[0229] 1.1 Key theories and techniques of the experiment

[0230] 1.1.1 Determination method of residence time distribution

[0231] The residence time distribution can be determined by injecting an inert chemical reagent called a tracer into a chemical reactor at a certain time t and then measuring the tracer concentration C in the effluent as a function of time. In addition to being a readily detectable non-reactive species, the tracer should have similar physical properties to the reactants and be completely soluble in the reactants. It should also not adsorb on chemical reactor walls or other surfaces. The latter is necessary to ensure that the behavior of the tracer will reliably reflect the behavior of the material flowing through the chemical reactor. Colored and radioactive materials and noble gases are the most common ty...

Embodiment 2

[0308] Embodiment 2: software design

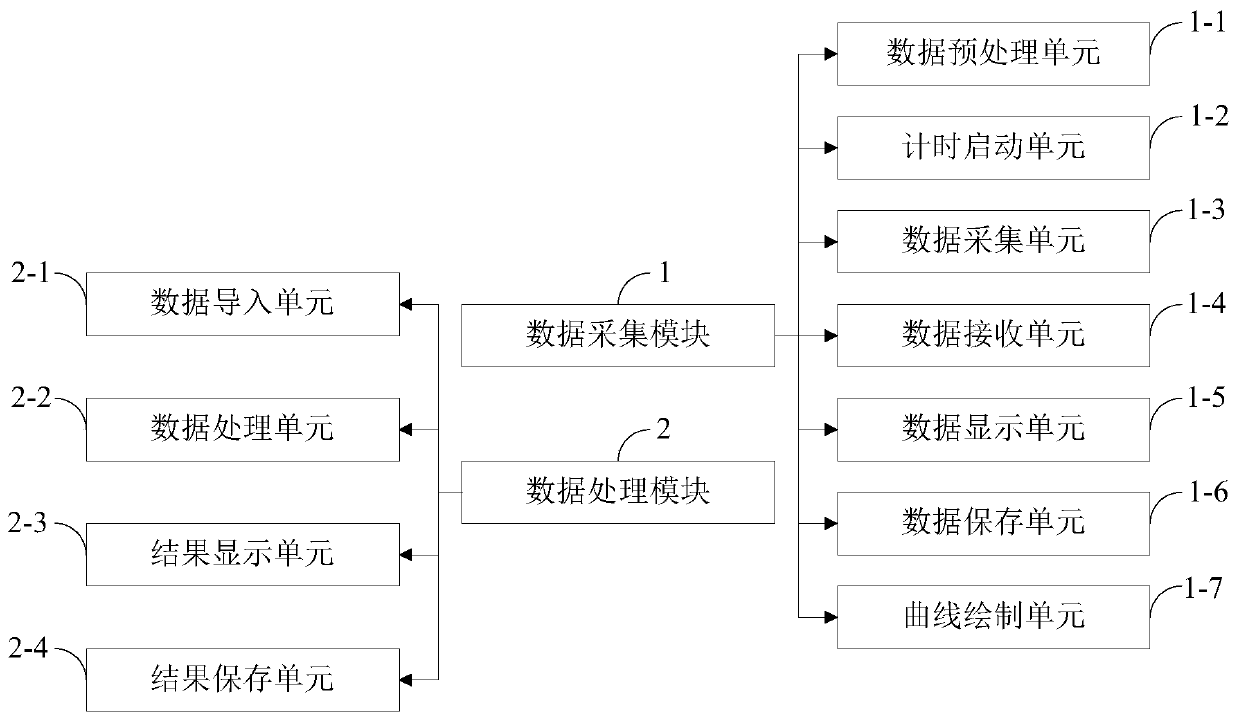
[0309] 1. Data acquisition software

[0310] 1.1 Software interface

[0311] The user interface after the data acquisition software is successfully started is as follows: Figure 5 shown. The initial size of the software window is 1280×720, which can be maximized or minimized. The title of the window is "Multiple Vessel Tandem Residence Time Distribution Determination". There are two tabs in the window. The first tab is "Experiment Setup" and the second tab is "Conductivity and Temperature Profiles".

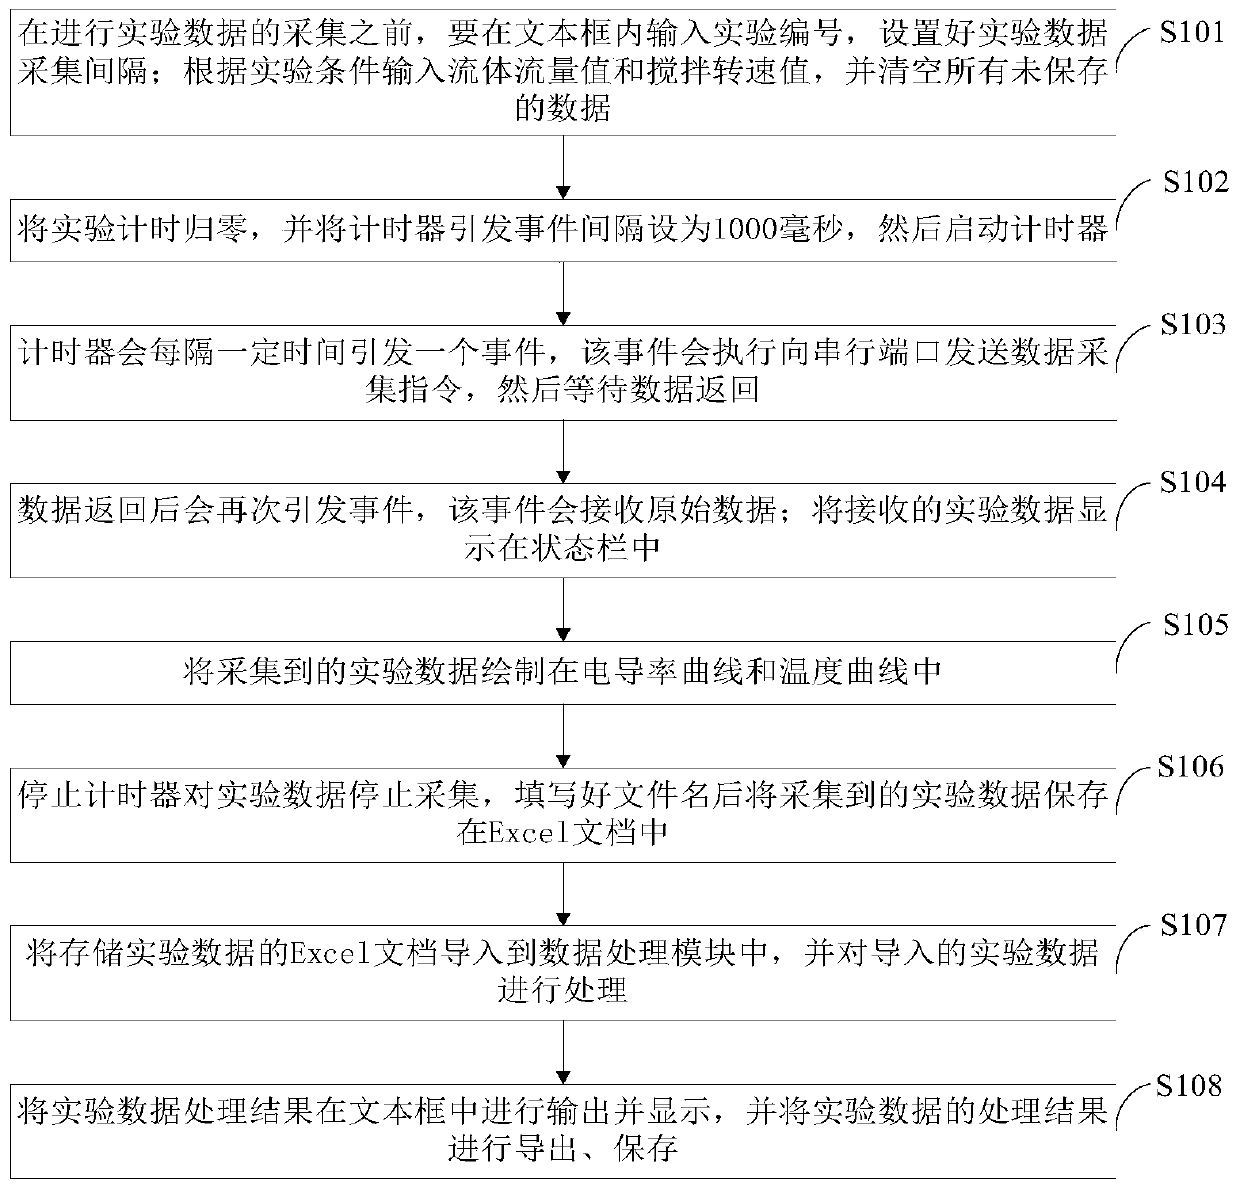
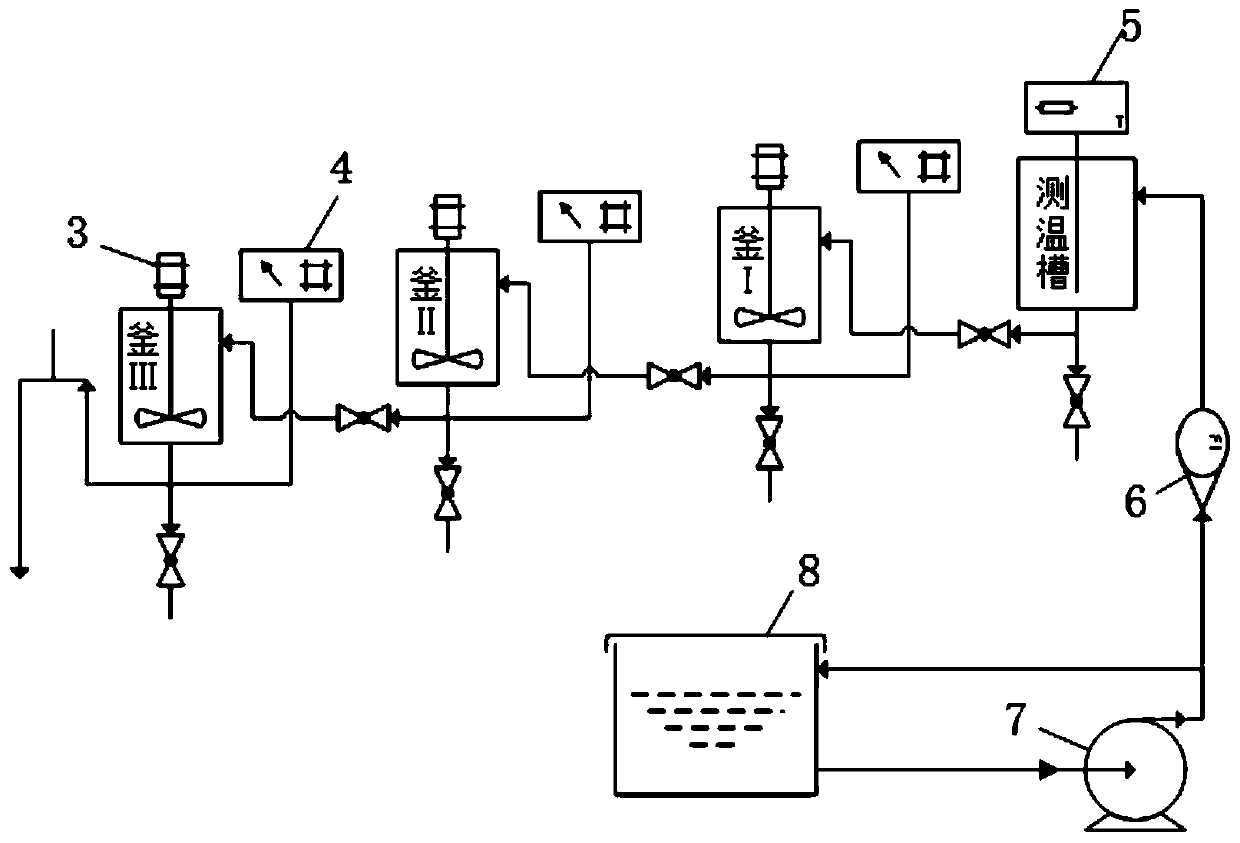
[0312]The left side of the "Experimental Settings" tab shows the experimental device in the form of pictures, and the right side is the experimental data collection setting area. The initial data collection button is located above the picture of the experimental setup. In addition to setting the experiment number and collection time interval in the experimental data collection setting area, you can also enter the fluid flow rate and ...

Embodiment 3

[0337] Example 3: Software Testing

[0338] 1. Overview of software testing

[0339] Software testing is the investigation of stakeholders to provide information about the quality of the product or service being tested. Software testing can also provide an objective, independent view of software, enabling the business to understand and understand the risks of software implementation. Testing techniques include the process of executing a program or application for the purpose of finding software errors (bugs or other defects) and verifying that a software product is fit for use.

[0340] Software testing involves executing a software component or system component to evaluate one or more properties of interest. Typically, these attributes indicate the extent to which the component or system under test:

[0341] (1) Meet the requirements for guiding design and development;

[0342] (2) Correctly respond to various inputs;

[0343] (3) Perform its functions within an acceptab...


PUM


Abstract

The invention belongs to the technical field of experimental data acquisition and processing, and discloses a residence time distribution measurement experimental data acquisition and processing system. A data acquisition module acquires and saves experimental data. A data processing module imports the acquired and saved experimental data and draws a curve chart. The data acquisition module of theinvention can stably and accurately acquire data of relevant chemical engineering experiments in real time and display the experimental data in the form of the curve chart on a user interface of thesoftware, so that experiment personnel can timely understand the state of the experiments; after the relevant chemical engineering experiments are completed, the data acquisition module will save theexperimental data in an Excel workbook; and the experimental data processing module can import the experimental data saved by the experimental data acquisition software and draw a curve chart, and then process and calculate the experimental data according to different processing schemes and display the results to users according to requirements of the relevant chemical engineering experiments.

Description

technical field [0001] The invention belongs to the technical field of experimental data collection and processing, and in particular relates to a system and method for collecting and processing experimental data of residence time distribution measurement. Background technique [0002] Currently, the closest prior art: [0003] The residence time distribution (RTD) of a chemical reactor is a probability distribution function that describes the amount of time a fluid resides within a chemical reactor. Chemical engineers use residence time distributions to characterize mixing and flow within chemical reactors and to compare the behavior of real chemical reactors with their ideal models. [0004] The idea of ​​using residence time distributions in the analysis of chemical reactor performance was first proposed by MacMullin and Weber in a pioneering paper. However, the concept was not widely used until the early 1950s, when Prof. P.V. Danckwerts gave the organization of the to...

Claims


Application Information

Patent Timeline
Patent Type & Authority Applications(China)
IPC IPC(8): G16C20/10G16C20/90
CPCG16C20/10G16C20/90
Inventor 邬勇奇石云霄
Owner HUAZHONG UNIV OF SCI & TECH
Why Eureka
Try Eureka