Method for rapidly determining nitrogen contents of different organs of plant
A technology of nitrogen content and organ nitrogen, which is applied in the field of agriculture to achieve the effect of small sample volume, improved detection throughput, and simple operation
- Summary
- Abstract
- Description
- Claims
- Application Information
AI Technical Summary
Problems solved by technology
Method used
Image
Examples
Embodiment 1
[0038] Embodiment 1, wheat leaf nitrogen content prediction based on hyperspectral images, the steps are as follows:
[0039] 1) Test samples and test treatments: The sampling time was 2019, and the location was Wuqiao Experimental Station, Hebei, China Agricultural University. The wheat varieties were Jimai 22 (high yield and cold resistance) and Nongda 399 (fast growth and drought resistance). The irrigation modes were divided into no irrigation after sowing, irrigation at rising stage, irrigation at jointing stage, irrigation at rising stage and flowering stage, and irrigation at jointing stage and flowering stage. The single irrigation volume in each irrigation period is 75mm. The fertilization method and fertilization rate were the same for all treatments.
[0040] 2) Sample collection: From the flowering stage of wheat, samples were collected every 5 days until maturity. When collecting samples, 2 m was selected for each experimental treatment. 2 area, take the aboveg...
Embodiment 2
[0045] Example 2. Prediction of nitrogen content in wheat internodes based on hyperspectral images
[0046] Except that in step 2), the sample sites were divided into the first segment, the second segment, the third segment and the remaining segment (all other internodes), other conditions were the same.
Embodiment 3
[0047] Example 3. Prediction of nitrogen content in ears of wheat based on hyperspectral images
[0048] Except that in step 2) the ear was isolated from the sample site, other conditions were the same.
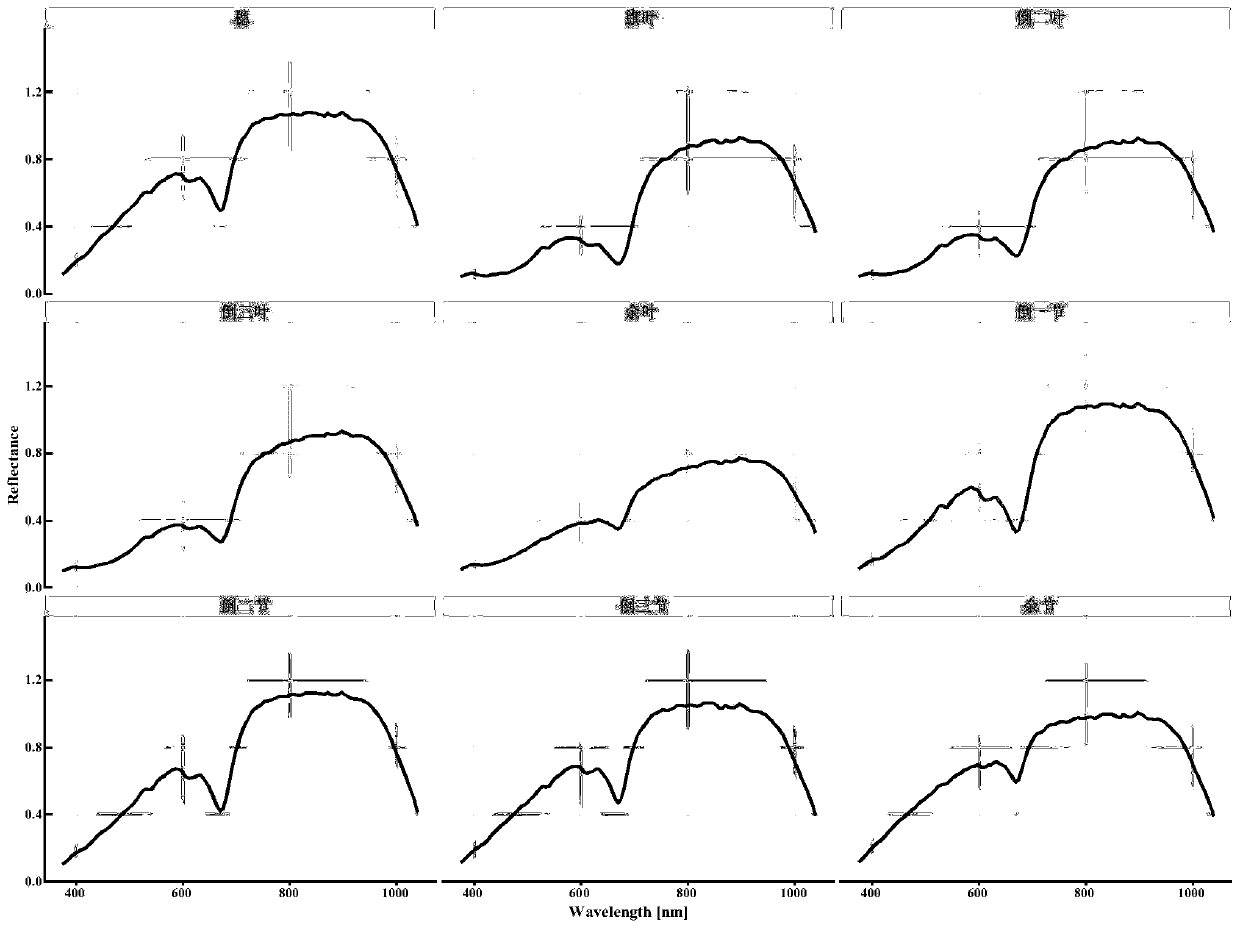
[0049] figure 1 is the average spectrum and range of spectral variation of 9 different organs.
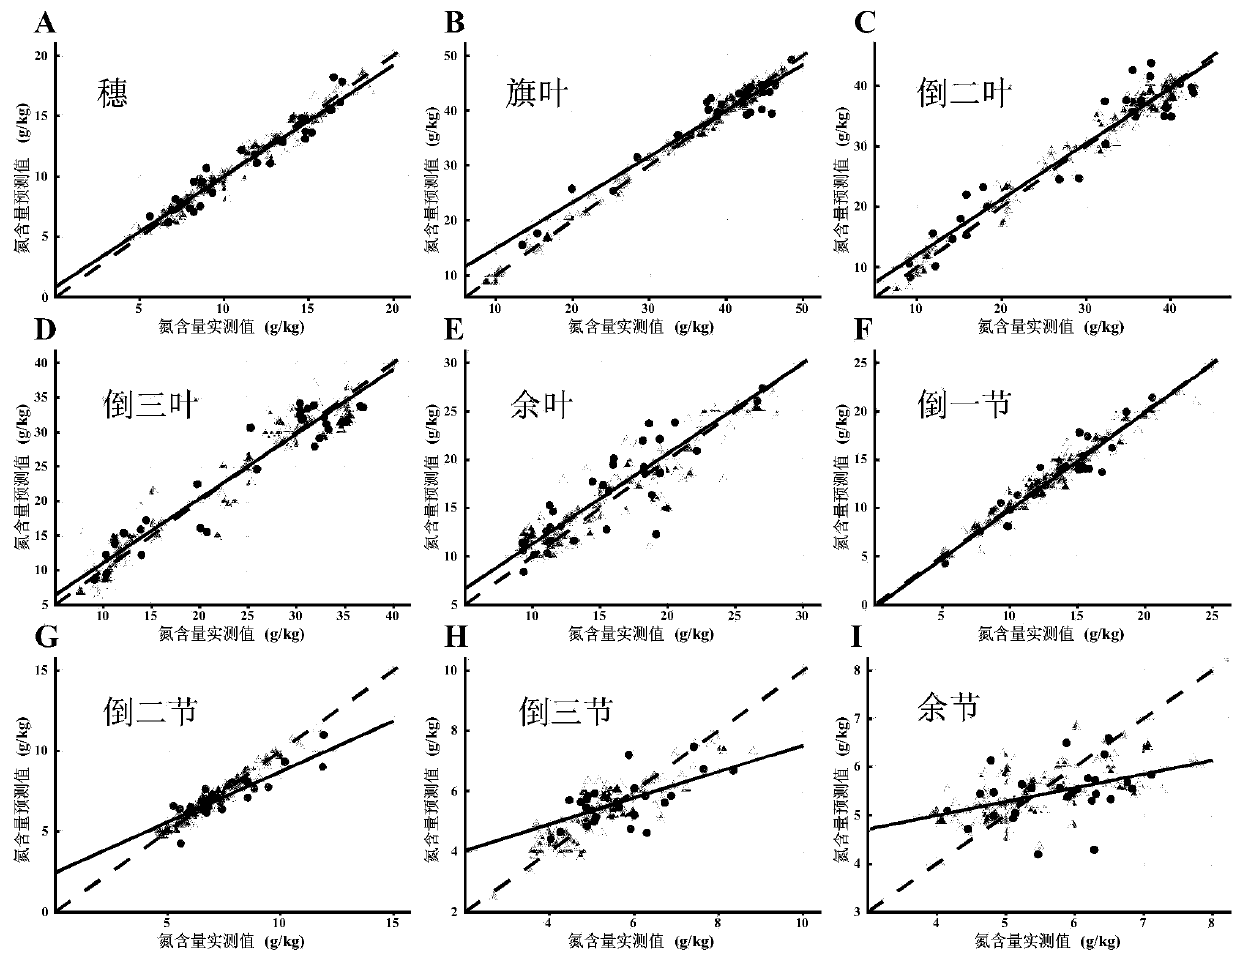
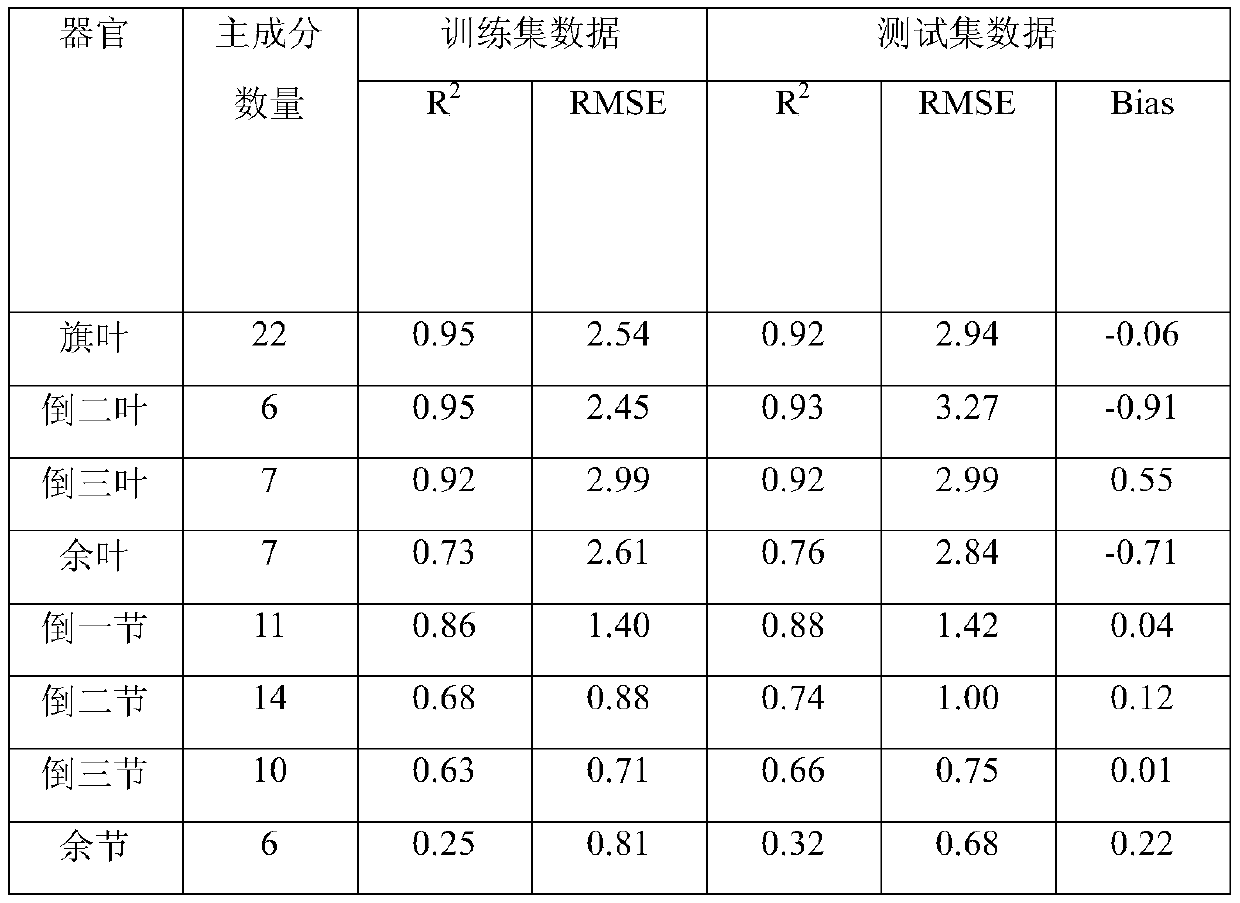
[0050] figure 2 It is the comparison between the model prediction value and the real value for 9 different organs.
[0051] Table 1 Measured nitrogen content in different organs of wheat (unit: g / kg)
[0052] organ average standard deviation minimum value maximum value flag leaf 34.8 11.1 8.72 50.7 Inverted two leaves 29.2 10.9 7.52 42.9 inverted clover 23.2 9.62 7.53 36.9 Yu Ye 16 5.08 9.04 28 down a section 13.1 4.07 4.36 23.8 down two quarters 7.08 1.92 2.79 11.9 fall three quarters 5.39 1.15 2.68 8.82 remaining section 5.55 0.885 3.95 7.87 ear 11.2 3.82 4.43 18.6
[0053...
PUM
 Abstract
Description
Claims
Application Information
 - R&D
- Intellectual Property
- Life Sciences
- Materials
- Tech Scout
- Unparalleled Data Quality
- Higher Quality Content
- 60% Fewer Hallucinations
Browse by: Latest US Patents, China's latest patents, Technical Efficacy Thesaurus, Application Domain, Technology Topic, Popular Technical Reports.
© 2025 PatSnap. All rights reserved.Legal|Privacy policy|Modern Slavery Act Transparency Statement|Sitemap|About US| Contact US: help@patsnap.com


