Method for predicting or controlling microbial status of a paper or board making process
A manufacturing process and microbial technology, applied in the process of adding pulp raw materials, testing organic pollutants in water, paper, etc., can solve the problems of declining quality of finished products, inability to mix pulp uniformly, and inability to extract representative samples, etc.
- Summary
- Abstract
- Description
- Claims
- Application Information
AI Technical Summary
Problems solved by technology
Method used
Image

Examples
example 1
[0079] Example 1. On-line calculation of risk levels for higher microbial activity in broke towers of board machines
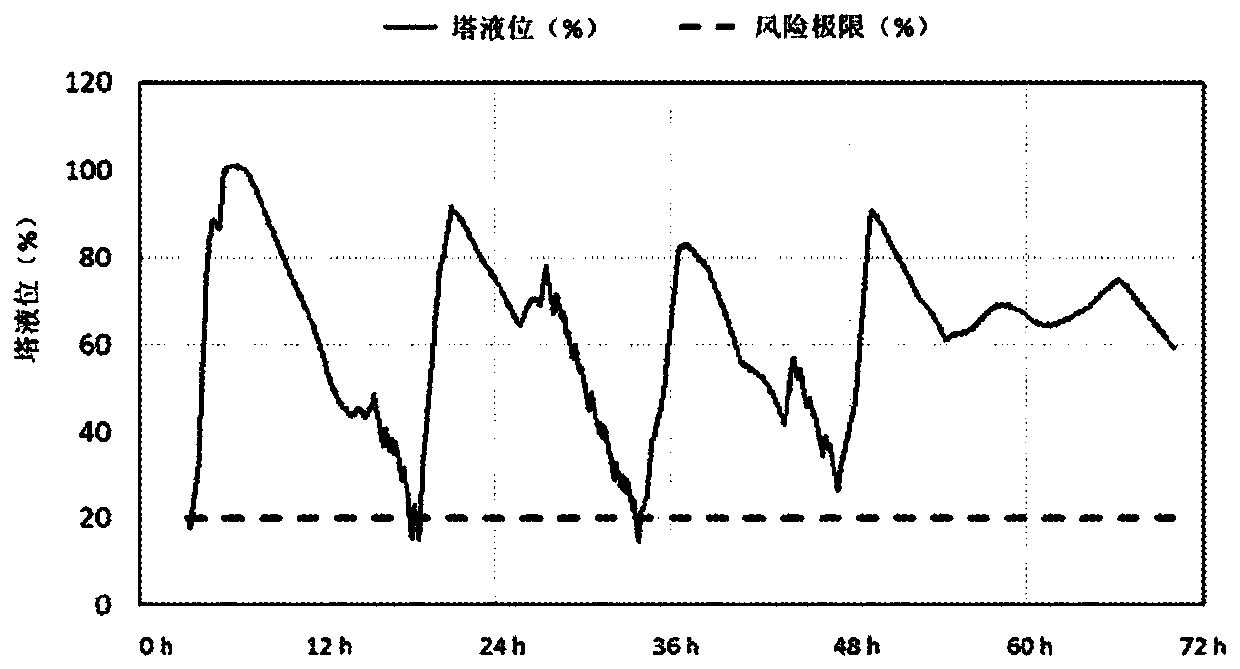
[0080] Analysis of historical data indicates that the broke column studied in this example should be emptied once a day to prevent increased microbial activity in the column. The risk limit for the liquid level of the studied column is 20% and the predefined time is 1 day.
[0081] Connect the signal from the column level sensor to a programmable logic circuit (PLC) or industrial PC. The risk level is continuously calculated in the system (PLC or Industrial PC).
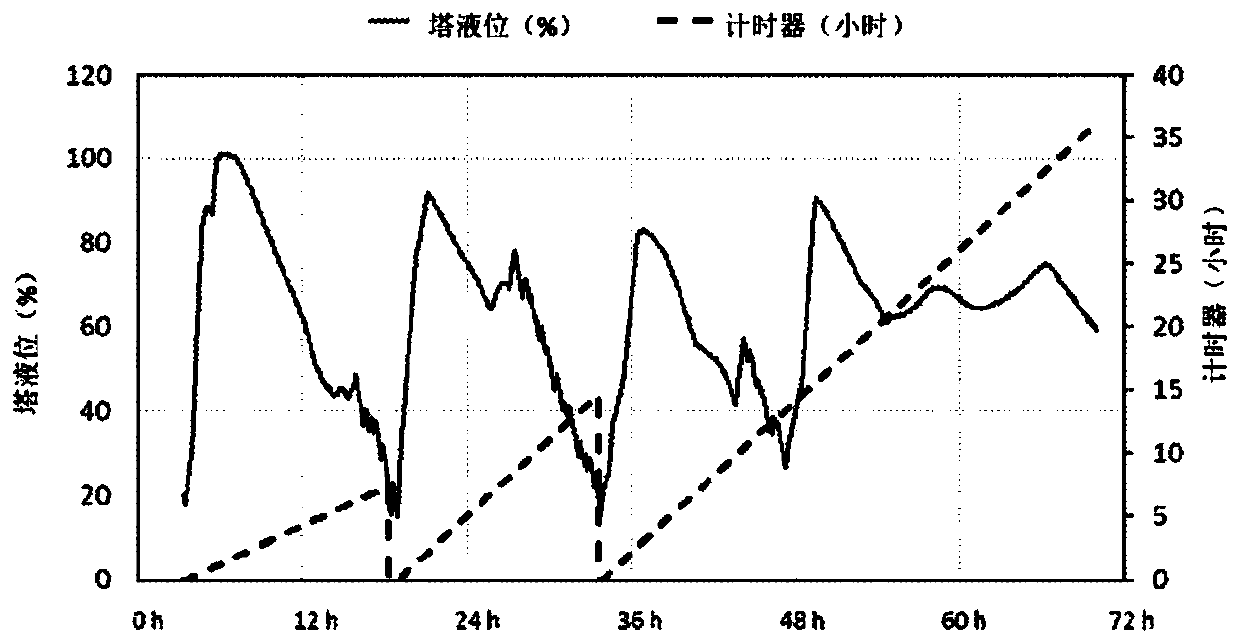
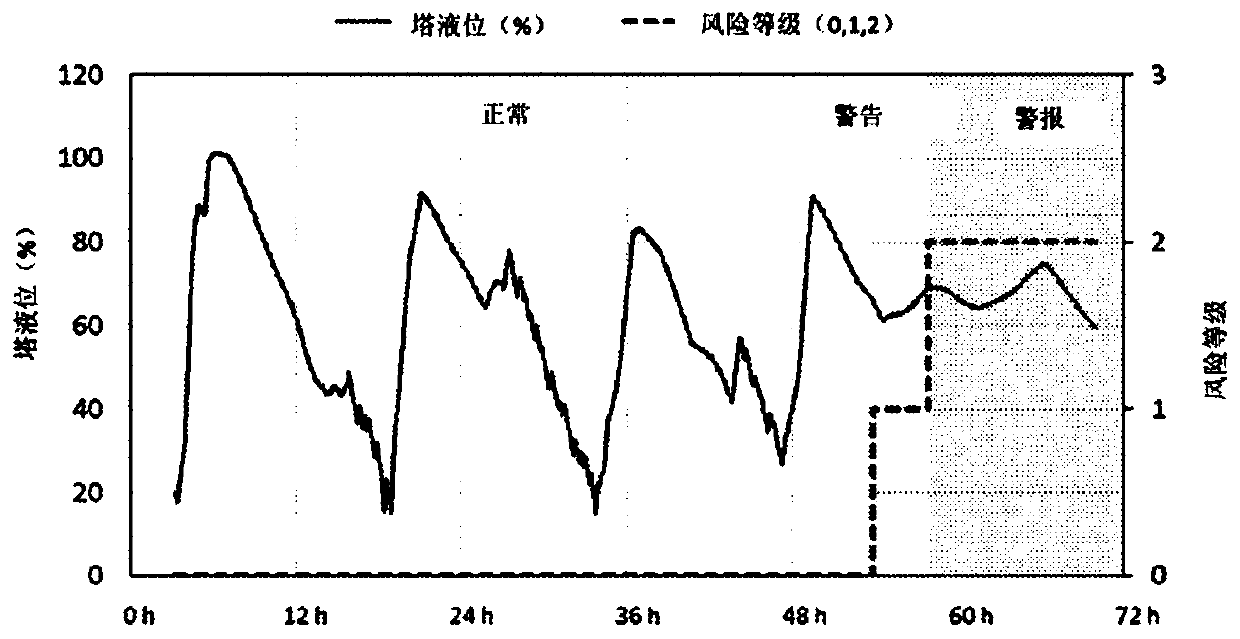
[0082] Calculations are based on timers that record time as seconds, minutes, hours or days. The timer gets online information on the column level every second. The timer resets the time to 0s when the column level drops to or below a predefined risk limit (20% or below). After resetting the time to zero, the timer will start recording the time again when the level exceeds the risk limit ( figur...
example 2
[0088] Example 2. Online calculation of risk levels for higher microbial activity in broke towers
[0089] Background: Analysis of historical data indicates that broke towers should be drained to or below a predefined surface level at least every 2.2 days to prevent increased microbial activity in the tower and further dry board quality issues.
[0090] Predefined risk limit for surface level: 25%
[0091] · Predefined time: 2.2 days
[0092] Connect the signal from the column level sensor to a programmable logic (PLC) or industrial PC. The risk level is continuously calculated in the system (PLC or Industrial PC).
[0093] The calculation of the risk level is based on a timer, which records time as seconds, minutes, hours or days, for example. The timer gets online information from the column level. The timer resets the time to 0 s when the column level falls or falls below a predefined risk limit (=eg, in this example, the level is 25% or the level is below 25%). After ...
example 3
[0100] Example 3: Board machine example: historical data analysis, risk limits with respect to broke tower and quality of dry finished product for a predefined time
[0101] Historical data includes online tower level information and bacterial spore counts (results of laboratory analysis) on dry cardboard. High-quality cardboard should contain few bacterial spores. In the mill, the maximum limit of spore count was set at 1000 CFU / g. Based on the analysis, the following parameters were found:
[0102] Risk limit for broke tower liquid level: 25%
[0103] · Predefined time: 2.2 days
[0104] Examples are shown in Figures 6 to 8.
[0105] When recorded for less than 2.2 days → low risk of high spore counts in finished product (usually results <1000CFU / g)
[0106] When the recording time exceeds 2.2 days → assess the risk of high spore counts in the finished product (higher than 1000CFU / g)
[0107] Figure 6a Data showing measured column surface level and spore count (CFU / g...
PUM
 Abstract
Description
Claims
Application Information
 - R&D
- Intellectual Property
- Life Sciences
- Materials
- Tech Scout
- Unparalleled Data Quality
- Higher Quality Content
- 60% Fewer Hallucinations
Browse by: Latest US Patents, China's latest patents, Technical Efficacy Thesaurus, Application Domain, Technology Topic, Popular Technical Reports.
© 2025 PatSnap. All rights reserved.Legal|Privacy policy|Modern Slavery Act Transparency Statement|Sitemap|About US| Contact US: help@patsnap.com