Method for inducing type 2 diabetes animal model through low-temperature and dietary rhythm regulation and control
A type 2 diabetes and animal model technology, applied in the field of biomedicine, can solve the problems of unrevealed effects, differences in type 2 diabetes, etc., and achieve the effect of easy operation and simple construction method
- Summary
- Abstract
- Description
- Claims
- Application Information
AI Technical Summary
Problems solved by technology
Method used
Image
Examples
Embodiment 1
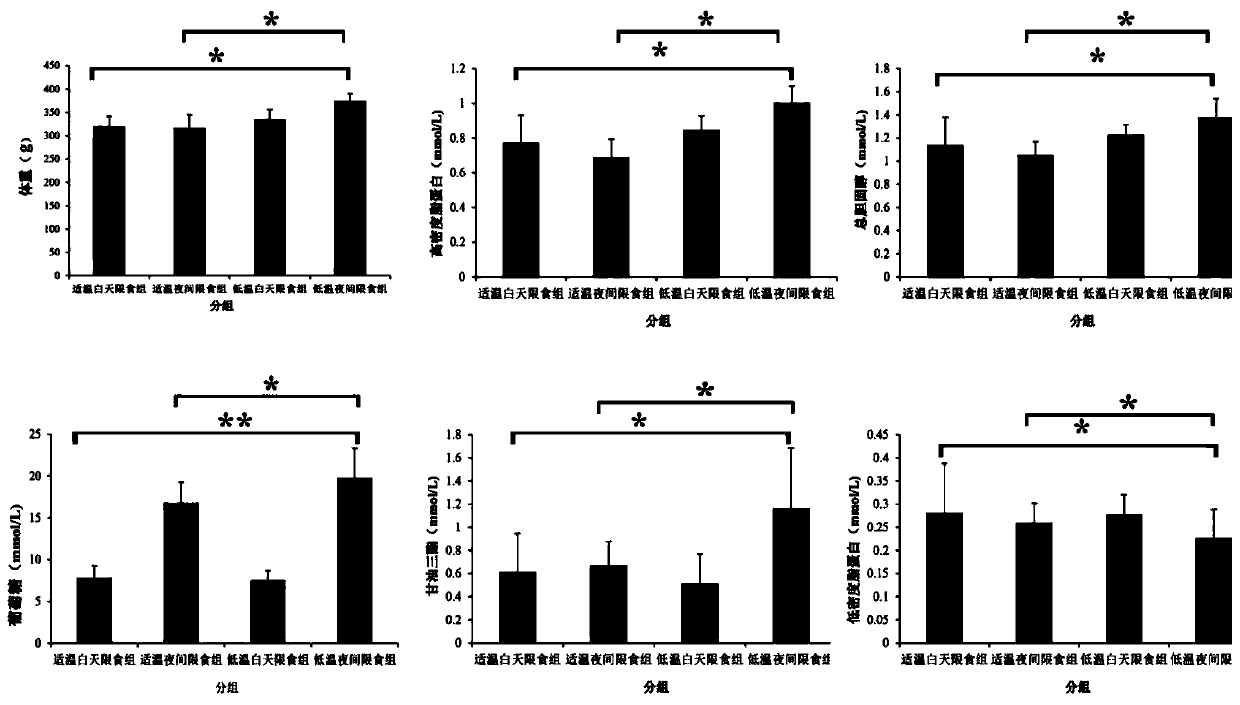
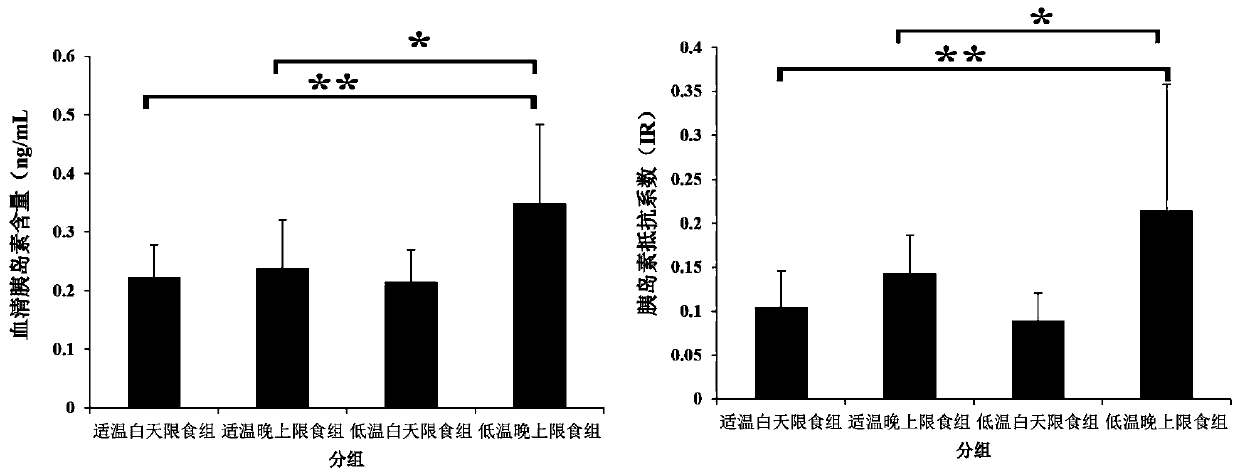
[0023] Example 1: Effects of changes in ambient temperature and circadian dietary rhythm on body weight and components of glucose and lipid metabolism in rats.
[0024] 1. Induction of type 2 diabetes animal model
[0025] 4-week-old 150g-200g male SD rats were selected. 12 hours of natural light per day, adaptive feeding for 1 week. Different temperatures (high temperature 30°C, suitable temperature 25°C, low temperature 16°C), time-limited diet (daytime, night), high-fat diet affect the dietary rhythm and structure of the rats, and set up a high-temperature normal diet group with a daytime restricted diet and a high-temperature normal diet group. Food restriction group at night, food restriction group with normal temperature-appropriate feed during the day, food restriction group with normal temperature-appropriate feed at night, food restriction group with normal low temperature feed during the day, food restriction group with normal low temperature feed at night, high-fat...
Embodiment 2
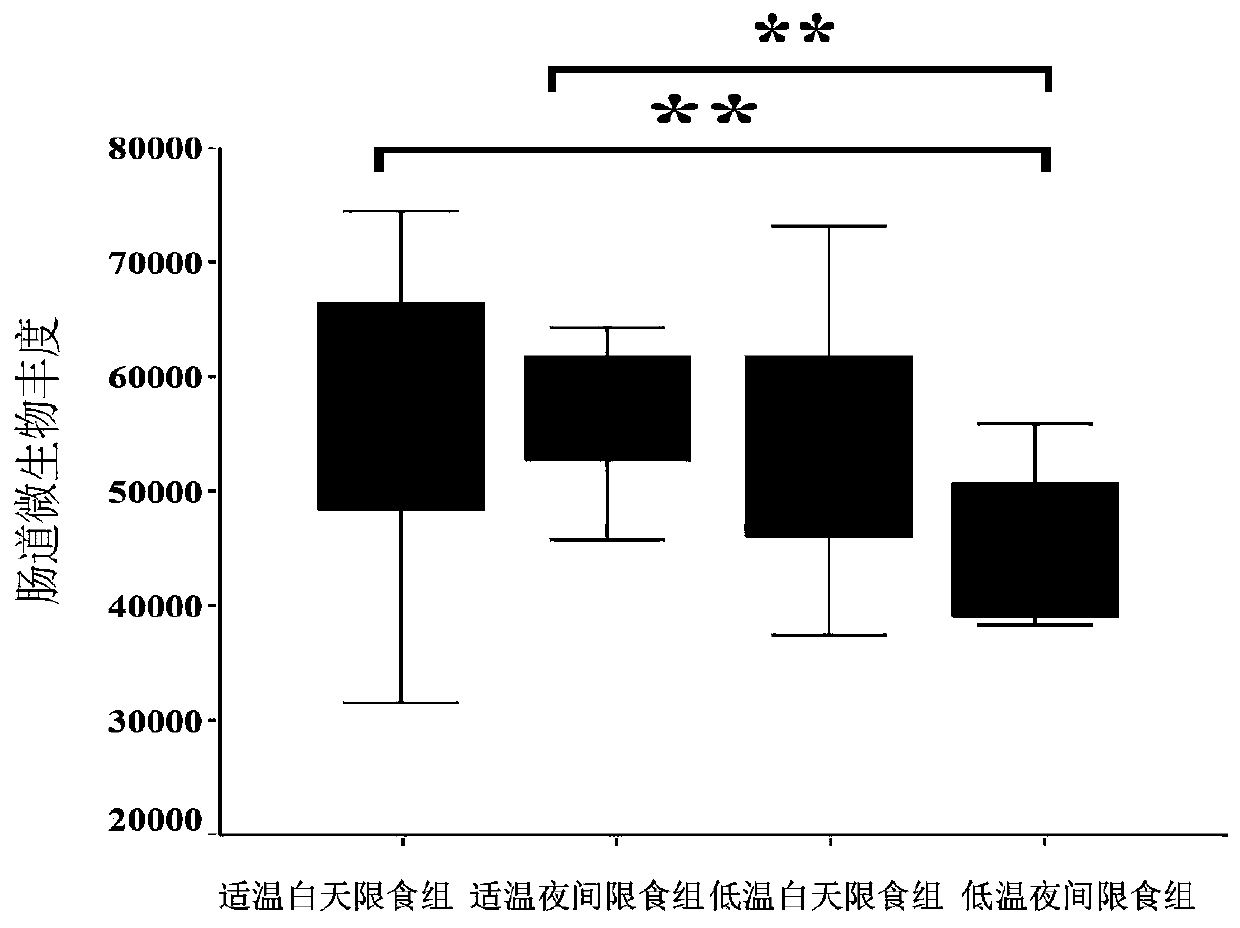
[0029] Example 2: Effects of low temperature environment and circadian dietary rhythm on intestinal microbial diversity in rats.
[0030] Microbial diversity sequencing technology was used to analyze the effects of low temperature environment and circadian dietary rhythm on the intestinal microbial diversity of rats. The results showed that low temperature environment can significantly reduce the intestinal microbial abundance of rats, and the microbial abundance of rats in the low temperature nighttime food restriction group minimum (see image 3 , * 0.01 Figure 4 , the Y axis represents the species name at a certain taxonomic level, the X axis represents the average relative abundance of species in different groups, and the columns with different numbers represent different groups; the far right is the P value, * 0.01 < P ≤ 0.05, **0.001 < P ≤ 0.01), suggesting that the low temperature environment may promote the colonization of Firmicutes microorganisms.
[0031] Results:...
PUM
 Abstract
Description
Claims
Application Information
 - R&D
- Intellectual Property
- Life Sciences
- Materials
- Tech Scout
- Unparalleled Data Quality
- Higher Quality Content
- 60% Fewer Hallucinations
Browse by: Latest US Patents, China's latest patents, Technical Efficacy Thesaurus, Application Domain, Technology Topic, Popular Technical Reports.
© 2025 PatSnap. All rights reserved.Legal|Privacy policy|Modern Slavery Act Transparency Statement|Sitemap|About US| Contact US: help@patsnap.com


