Inter-graph similarity calculation method and system, terminal equipment and storage medium

A similarity calculation and graphics technology, which is applied in calculations, computer components, complex mathematical operations, etc., can solve the problems of low accuracy of similarity calculations between graphics, and achieve the effects of convenient calculation, accurate calculation, and reduced sensitivity

Pending Publication Date: 2020-09-29
深圳市和美长丰科技有限公司
View PDF8 Cites 2 Cited by
  • Summary
  • Abstract
  • Description
  • Claims
  • Application Information

AI Technical Summary

Problems solved by technology

[0005] The embodiment of the present application provides a method, system, terminal device, and storage medium for calculating the similarity between graphics, aiming at solving the problem of using the XOR method or using the similarity calculation based on tangent space in the existing similarity calculation process between graphics. The problem of low accuracy of similarity calculation between graphs caused by the method

Method used


Image

  • Inter-graph similarity calculation method and system, terminal equipment and storage medium
  • Inter-graph similarity calculation method and system, terminal equipment and storage medium
  • Inter-graph similarity calculation method and system, terminal equipment and storage medium

Examples


Embodiment 1

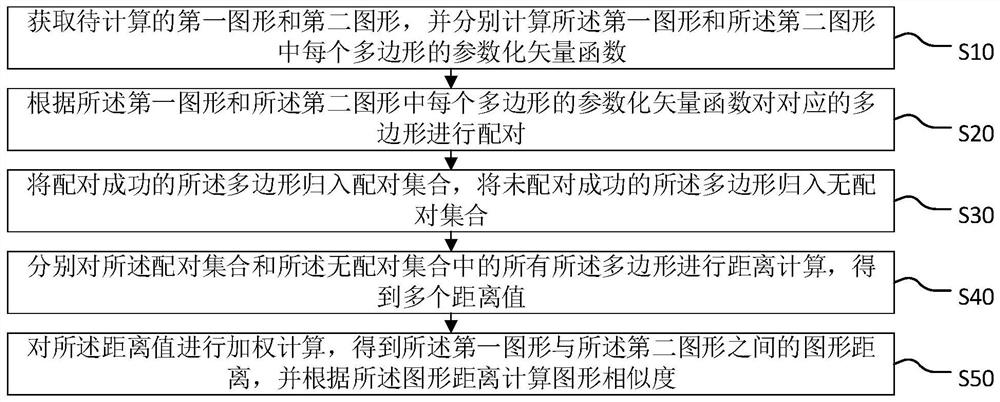
[0065] see figure 1 , is a flow chart of the method for calculating the similarity between graphics provided in the first embodiment of the present application, including steps:

[0066] Step S10, obtaining the first graphic and the second graphic to be calculated, and calculating the parameterized vector function of each polygon in the first graphic and the second graphic respectively;

[0067] Wherein, each figure contains a polygon group, for example, the polygon group contained in the first figure A is {a i}, the polygon group contained in the second graphic B is {b j}.

[0068] Let the symbol of the parameterized vector function be denoted by p is a parameter, the function has two component functions E x (p) and E y (p), in this step, the polygon group {a i} and polygon group {b j}, so that the graphic features of the polygon can be focused on the edge information of the polygon, and the edge information of each polygon can be mapped into a parameterized vector ...

Embodiment 2

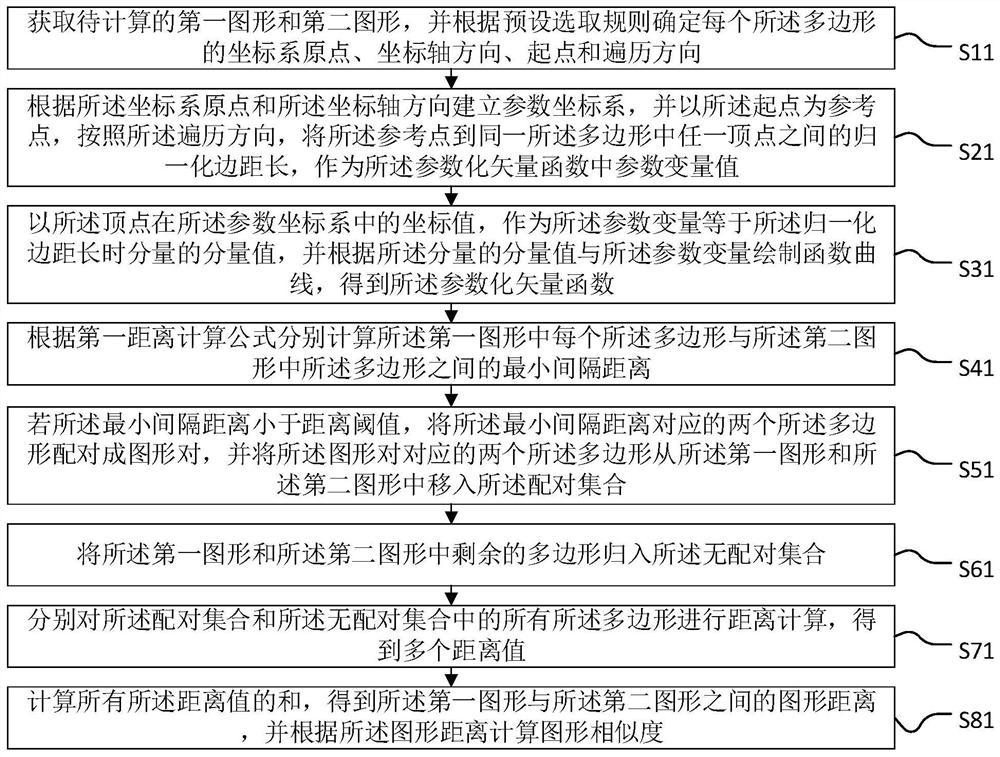
[0079] see figure 2 , is a flow chart of the method for calculating the similarity between graphics provided in the second embodiment of the present application, including steps:

[0080] Step S11, obtaining the first graphic and the second graphic to be calculated, and determining the origin of the coordinate system, the direction of the coordinate axes, the starting point and the traversal direction of each polygon according to the preset selection rules;

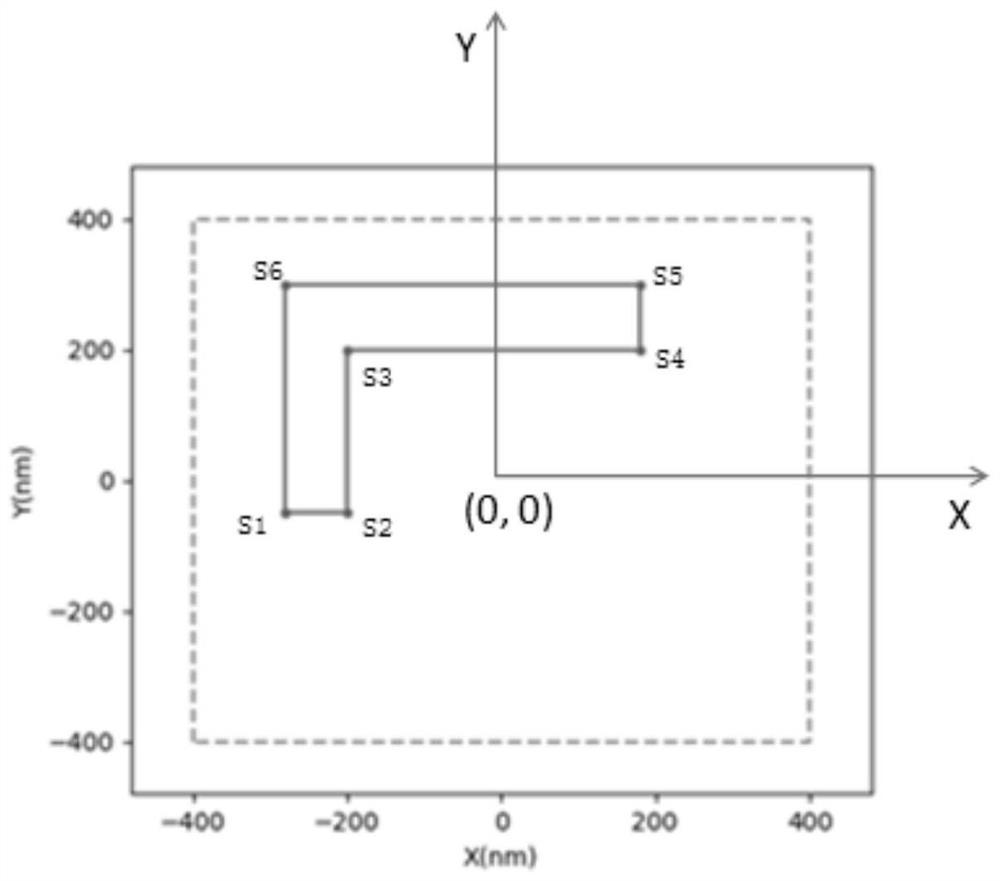
[0081] Wherein, the preset selection rule can be set according to the needs of the user, and the origin of the coordinate system, the direction of the coordinate axis, the starting point, and the traversal direction for each polygon can be set arbitrarily. For example, the first graphic A contains the polygon group {a i}, the second graph B contains the polygon group {b j}, taking the midpoint of the first graphic A as the polygon group {a i} the origin of the coordinate system of all polygons, and the midpoint of the ...

Embodiment 3

[0123] see Figure 8 , is a flow chart of the method for calculating the similarity between graphics provided in the third embodiment of the present application, including steps:

[0124] Step S12, obtaining the first graphic and the second graphic to be calculated, and calculating the parameterized vector function of each polygon in the first graphic and the second graphic respectively;

[0125] Wherein, each of the parameterized vector functions includes two component functions.

[0126] Step S22, pairing corresponding polygons according to the parameterized vector function of each polygon in the first graphic and the second graphic;

[0127] Step S32, classify the polygons that are successfully paired into a matching set, and classify the polygons that are not successfully paired into a non-matching set;

[0128] Step S42, performing distance calculation on all the polygons in the matching set and the non-pairing set respectively, to obtain a plurality of distance values;...


PUM


Abstract

The invention provides an inter-graph similarity calculation method and system, terminal equipment and a storage medium. The method comprises the following steps: respectively calculating a parameterized vector function of each polygon in the first graph and the second graph, pairing the corresponding polygons according to the parameterized vector function of each polygon in the first graph and the second graph, classifying the polygons which are successfully paired into a pairing set, and classifying the polygons which are not successfully paired into a non-pairing set; and performing distance calculation on all polygons in the pairing set and the non-pairing set to obtain a plurality of distance values, performing weighted calculation on the distance values to obtain a graph distance, and calculating graph similarity according to the graph distance. Through the design of calculating the parameterized vector function of each polygon, the graphic information of each polygon is mapped into the parameterized vector function, the calculation of the inter-graphic distance between two graphs under different shapes is facilitated, and the accuracy of inter-graph similarity calculation isimproved.

Description

technical field [0001] The present application belongs to the technical field of graphics processing, and in particular relates to a method, system, terminal equipment and storage medium for calculating similarity between graphics. Background technique [0002] As the critical dimension (Critical Dimension, referred to as CD) continues to decrease, the size of the graphics on the semiconductor chip layout is getting smaller and smaller, and the difficulty of process development and production requirements are getting higher and higher. Measuring the similarity of graphics on two chip layouts can be applied to matching key positions from a graphics database, which plays an important role in accelerating process development and applying to defect detection in the production process. [0003] The chip layout is mainly composed of polygonal graphics of various shapes. Usually, the size change and position distribution of graphics on a layout are complicated. Considering the simi...

Claims


Application Information

Patent Timeline
Patent Type & Authority Applications(China)
IPC IPC(8): G06K9/62G06F17/15
CPCG06F17/15G06F18/22
Inventor 范启通马常群
Owner 深圳市和美长丰科技有限公司
Why Eureka
Try Eureka