Visualization method for quantifying glioma invasiveness based on kernel density function

A technology of kernel density function and glioma, applied in the field of biomedicine, can solve the problems of high labor cost, inability to reflect the characteristics of local tissue density well, time-consuming and labor-intensive problems, etc.

Active Publication Date: 2021-01-29
THE FIRST AFFILIATED HOSPITAL OF ARMY MEDICAL UNIV
View PDF13 Cites 7 Cited by
  • Summary
  • Abstract
  • Description
  • Claims
  • Application Information

AI Technical Summary

Problems solved by technology

If the region selection is too large, it cannot reflect the density characteristics of the local tissue w

Method used


Image

  • Visualization method for quantifying glioma invasiveness based on kernel density function
  • Visualization method for quantifying glioma invasiveness based on kernel density function
  • Visualization method for quantifying glioma invasiveness based on kernel density function

Examples


Embodiment 1

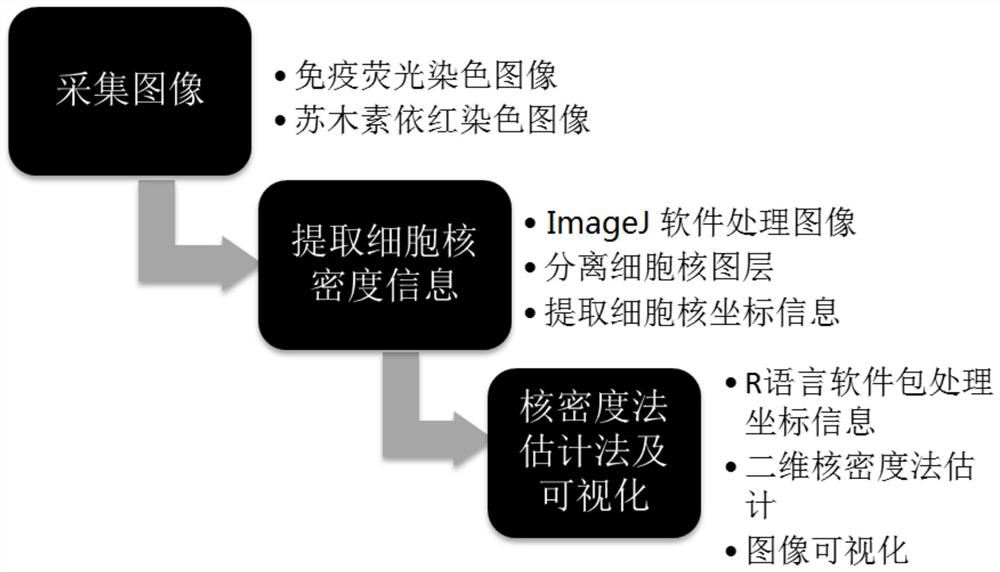
[0069] Such as figure 1 A visualization method for quantifying glioma invasiveness based on the kernel density function is shown, and the specific steps are as follows:

[0070] (1) converting each cell nucleus in the glioma tissue section into a binary image;

[0071] The concrete method of step (1) is as follows:

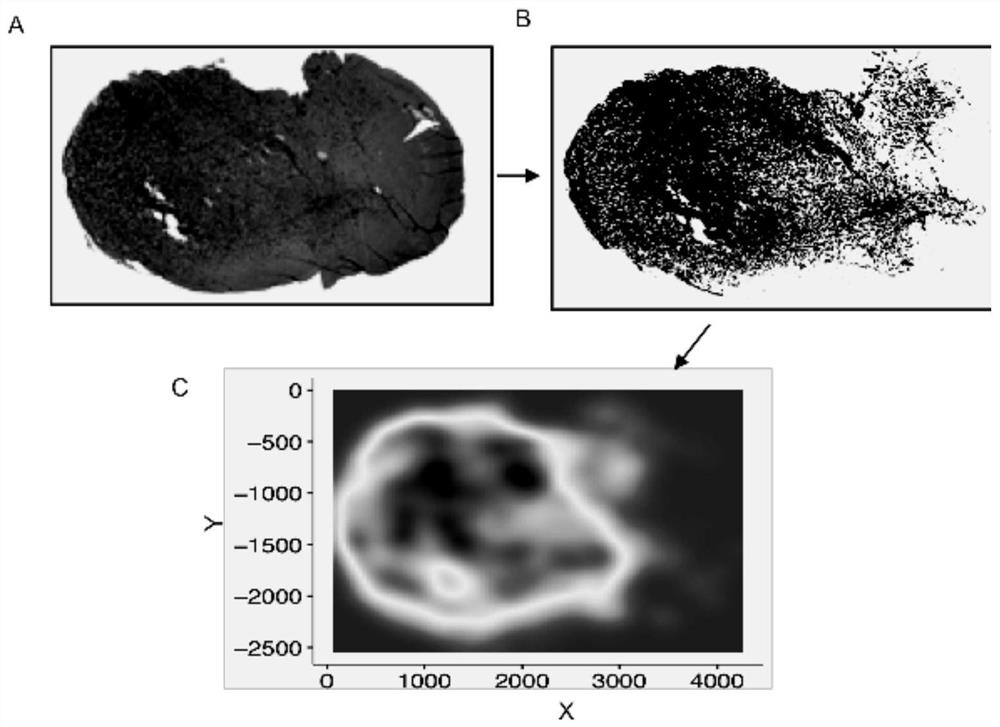
[0072] (1-1) Using an image acquisition device to collect images of glioma tissue slices, and import them into ImageJ software; ( figure 2 Middle A)

[0073] (1-2) Open the picture, run FUJI's Macro code for batch processing, select the color threshold, and select the Convert to Mask column to obtain a binarized image.

[0074] In step (1-1), the image of the glioma tissue section is HE or immunofluorescence image.

[0075] The specific process of step (1-2) is as follows:

[0076] (1-2-1) Run FUJI software, open HE image or confocal scanning image; open("… / … / …");

[0077] (1-2-2) Automatically select the color threshold; setAutoThreshold("Default dark no-r...

Embodiment 2

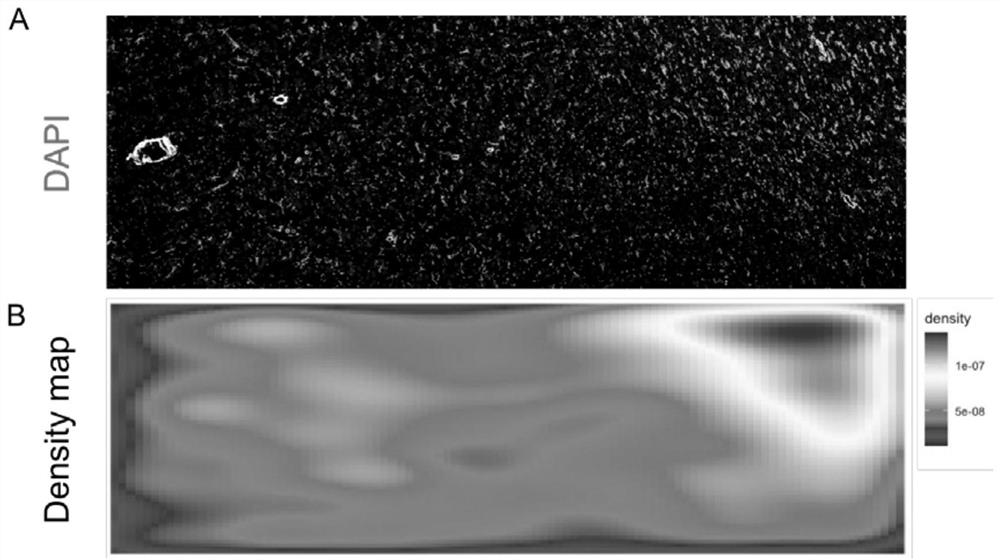
[0116] Another immunofluorescence image of human glioblastoma was selected and visualized according to the method in Example 1. The results show that this system can well reflect the density of nuclei in the local area ( image 3 ), and can be accessed from image 3 Trends in tumor invasion were accurately identified. The upper right corner of the figure is the area with high nuclear density, which is the core area of ​​the tumor, while the left side is the tumor invasion area. It can be clearly found that there are dark color blocks covering the invasion front, which means that the density of this area is relatively high.


PUM


Abstract

The invention relates to a visualization method for quantifying glioma invasiveness based on a kernel density function, which is a method for quantifying glioblastoma invasiveness established by usinga kernel density estimation algorithm on the basis of Image J software and an R language platform. According to the method, a nuclear density estimation graph of cell nucleus distribution is deducedby utilizing a nuclear density estimation algorithm packaged by an R language ggplot2 packet and an MASS packet and a visualization function. The method can help to effectively judge the invasion condition of the tumor from the pathological section in scientific research work, the tumor nuclear density of each region is counted by utilizing the nuclear density, the invasion trend of the tumor canbe roughly judged from a visual graph, and the tumor invasion ability is reflected from the section.

Description

technical field [0001] The invention belongs to the technical field of biomedicine, and relates to a visualization method for quantifying glioma invasiveness based on a kernel density function. Background technique [0002] The clinical management of glioma largely depends on the effectiveness of surgery and subsequent radiation therapy. A key issue limiting the success of these procedures is the lack of accurate judgment of surgical margins in surgically resected tumors during surgery. In glioma, its rapid proliferation and extensive infiltration make it difficult to determine the invasion boundary of the tumor, and the determination of the resection margin greatly determines the recurrence of the patient. How to resect the tumor tissue to the greatest extent while retaining normal tissue Tissue volume is the key to reducing postoperative recurrence, and it is also the biggest problem in the treatment of glioma. [0003] For the quantification of glioma invasiveness and t...

Claims


Application Information

Patent Timeline
IPC IPC(8): G06T7/00G06T7/11G06T7/136G06T7/155
CPCG06T7/0012G06T2207/10061G06T2207/10064G06T2207/20032G06T2207/20152G06T2207/30096G06T7/11G06T7/136G06T7/155
Inventor 杨凯迪卞修武平轶芳时雨孔维凯徐媛媛钮芹
Owner THE FIRST AFFILIATED HOSPITAL OF ARMY MEDICAL UNIV
Why Eureka
Try Eureka