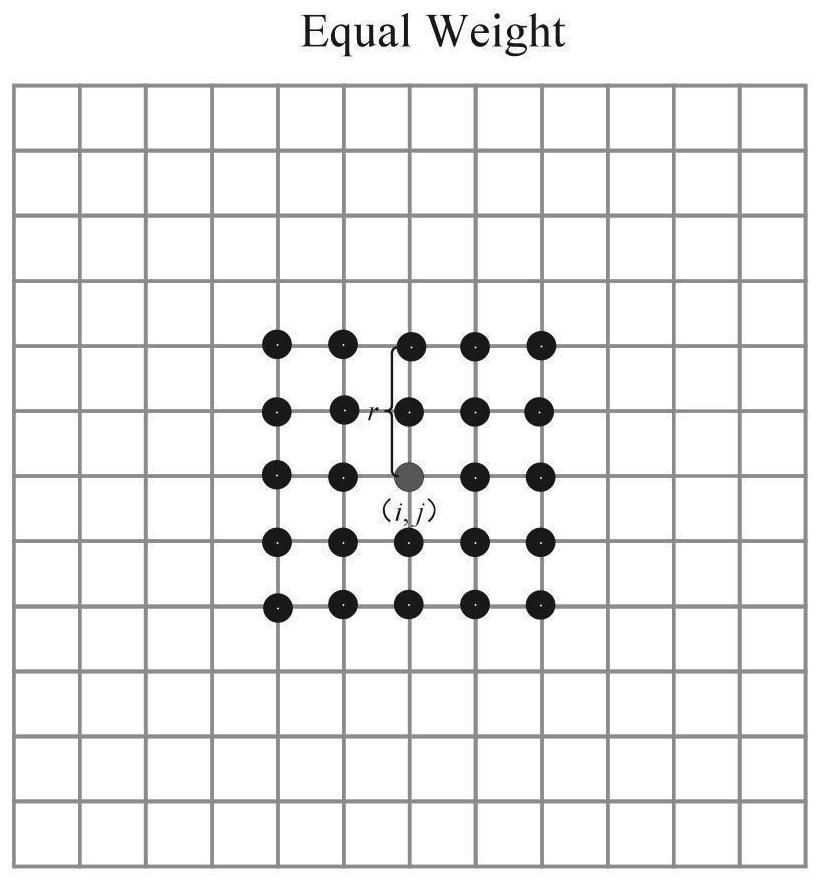
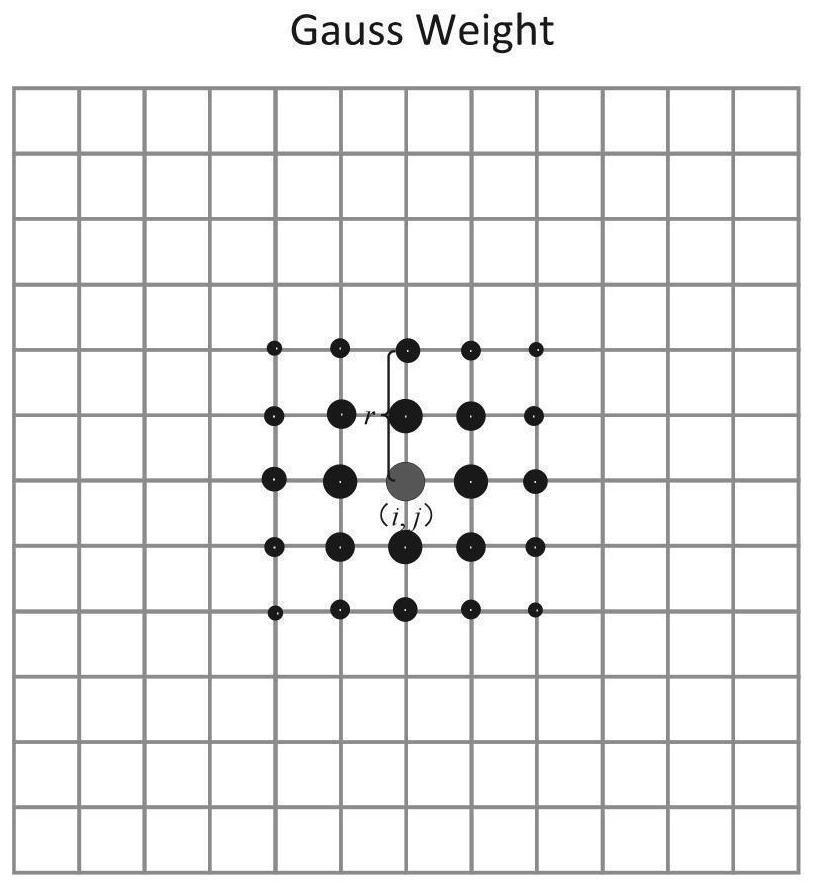
Gaussian weight-based LBGM method initial value disturbance generation method
A technique of weight and Gaussian function, applied in the field of ensemble forecasting, can solve the problem of ignoring the difference of lattice points, and achieve the effect of improving the effectiveness
- Summary
- Abstract
- Description
- Claims
- Application Information
AI Technical Summary
Problems solved by technology
Method used
Image
Examples
Embodiment 1
[0055] In this example, two examples are selected as follows:
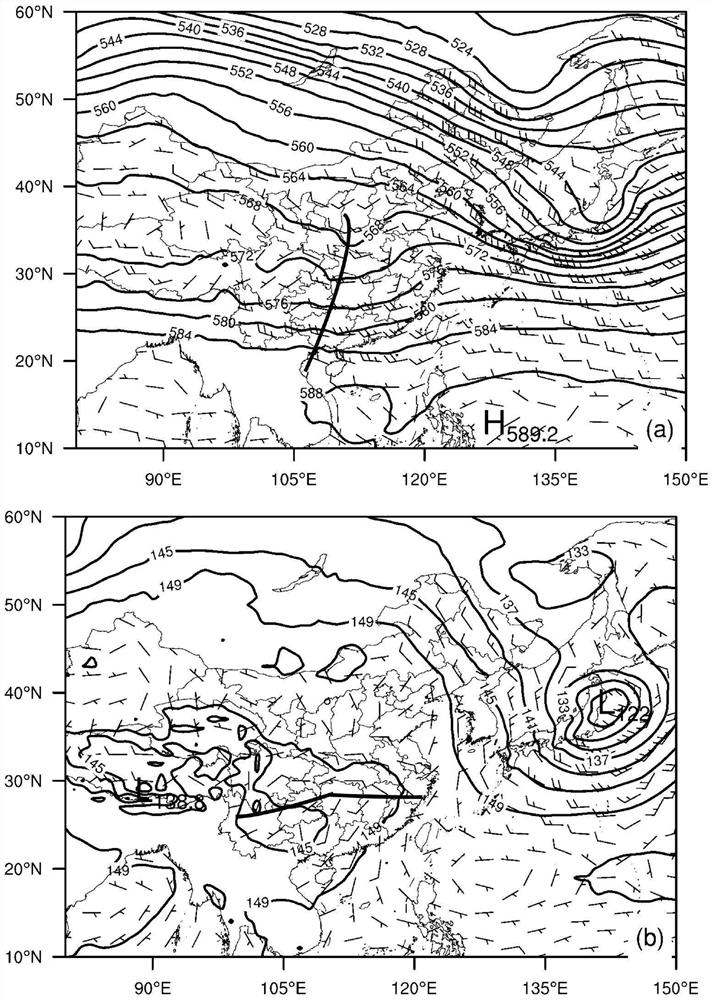
[0056] Case 1 selects a squall line process that occurred in South my country at the end of March 2014. From the evening of March 29th to the afternoon of March 31st, 2014, South China suffered a severe convective weather process, and Guangxi, Guangdong, Yunnan and other provinces were affected to varying degrees. Among them, from 20:00 on the 30th (UTC, the same below) to 04:00 on the 31st, a long squall line passed through Guangdong Province from northwest to southeast. Some cities experienced disastrous weather such as hail and strong winds. The cumulative precipitation in the central region reached 160mm. image 3 (a) and (b) show the large-scale circulation situation at 12:00 on March 30, 2014. In the high altitude of 500hPa, affected by the strong high-pressure ridge in the high latitude area, a steady stream of cold air is input into South China, which provides the middle-level cold air conditions for the ...
Embodiment 2
[0067] The experimental object and method in this example are the same as in Example 1. In order to better understand the impact of Gaussian weight and equal weight on the scale information of the disturbance generated by LBGM, this example uses the DCT method to perform kinetic energy Spectral analysis Kinetic energy spectral analysis can effectively describe the scale information contained in the initial disturbance. For a more successful ensemble forecasting system, its initial disturbance should consider uncertain information of different scales.
[0068] Image 6 and Figure 7The kinetic energy spectrum distribution of the initial perturbation of member 5 at different altitudes in two cases is given respectively. It can be seen from the figure that no matter in case 1 or case 2, the peaks of the disturbance spectrum energy under the two weighting methods are all concentrated in the large-scale area with a wavelength of about 1000 km. It is worth noting that, compared w...
Embodiment 3
[0070] The relationship between the root mean square error of the ensemble average forecast and the dispersion is often an important evaluation index to measure the forecasting ability of an ensemble forecast system. When the RMSE is consistent with the dispersion, it shows that the ensemble disturbance represents the uncertainty of the analysis field to a certain extent, and the ensemble forecast results cover the real state of the atmosphere in the future to the greatest extent possible.
[0071] The experimental object and method of this example are the same as those in Example 1, but considering that the application focus of the present invention is on the initial disturbance, the hypothesis of "perfect model" is adopted when testing the non-precipitation variable forecast, that is, the same model is used for the collective test Combined with physical parameterization, the model error is ignored, and the control forecast results replace the real atmospheric state. Therefor...
PUM
 Abstract
Description
Claims
Application Information
 - R&D
- Intellectual Property
- Life Sciences
- Materials
- Tech Scout
- Unparalleled Data Quality
- Higher Quality Content
- 60% Fewer Hallucinations
Browse by: Latest US Patents, China's latest patents, Technical Efficacy Thesaurus, Application Domain, Technology Topic, Popular Technical Reports.
© 2025 PatSnap. All rights reserved.Legal|Privacy policy|Modern Slavery Act Transparency Statement|Sitemap|About US| Contact US: help@patsnap.com


