Distortion array line spectrum enhancement method based on principal component analysis-density clustering
A principal component analysis and density clustering technology, applied in radio wave measurement systems, instruments, etc., can solve the problems such as the inability to guarantee the global convergence of parameter estimation, the inability to guarantee the unique identification of parameter estimation, and the huge amount of computation.
- Summary
- Abstract
- Description
- Claims
- Application Information
AI Technical Summary
Problems solved by technology
Method used
Image
Examples
Embodiment 1
[0149] In this embodiment, the sampling frequency F s = 4kHz, the propagation velocity v of sound in water is taken as 1500m / s. Using the three-parameter model method to simulate the power spectrum Gxf of the stationary continuum of the radiated noise of underwater acoustic targets, the three parameters are set as follows in the simulation process: ω m =2π×500rad / s, ω c =2π×1000rad / s, λ=0, the signal energy of the stationary continuum σ=1.
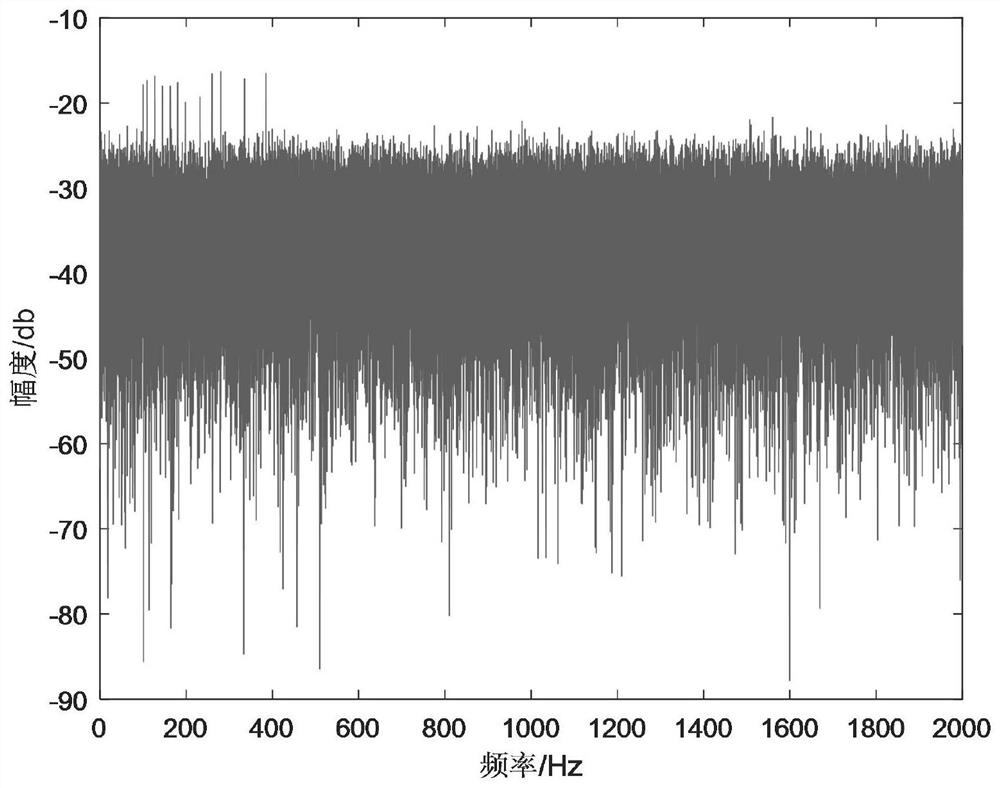
[0150] Simulate 9 line spectral components of target radiated noise: and 3 interfering line spectrum signals: The energy P of the stationary continuum passing through the line spectral position I and the known signal-to-interference ratio SIR=30, by Obtain the amplitude A of each sinusoidal signal i . The frequency f of the target sinusoidal signal i They are 109Hz, 127Hz, 145Hz, 163Hz, 198Hz, 232Hz, 280Hz, 335Hz, 385Hz. also by Obtain the amplitude A of each interfering sinusoidal signal j . The frequency f of the interfer...
Embodiment 2
[0159] This embodiment mainly analyzes and verifies the influence of the signal-to-noise ratio on the fidelity-enhanced beamforming disclosed in the present invention. The observation time is T=20s. The data signal-to-noise ratio is from -20dB to 0dB. For each signal-to-noise ratio, the relative error of the estimated beamforming amplitude is E, A i Indicates the magnitude of the original data spectrum at the position of the i-th line spectrum, PA i Indicates the magnitude of the estimated beamforming spectrum at the i-th line spectrum position, L S Indicates the number of line spectra selected. The relative error of the spectrum amplitude of the tracking beamline is used as the performance evaluation index. Such as Figure 8 The schematic diagram of line spectrum reconstruction error changing with signal-to-noise ratio is given. It can be seen from the figure that as the signal-to-noise ratio increases, the reconstruction error of distortion-corrected beamforming gradu...
PUM
 Abstract
Description
Claims
Application Information
 - R&D
- Intellectual Property
- Life Sciences
- Materials
- Tech Scout
- Unparalleled Data Quality
- Higher Quality Content
- 60% Fewer Hallucinations
Browse by: Latest US Patents, China's latest patents, Technical Efficacy Thesaurus, Application Domain, Technology Topic, Popular Technical Reports.
© 2025 PatSnap. All rights reserved.Legal|Privacy policy|Modern Slavery Act Transparency Statement|Sitemap|About US| Contact US: help@patsnap.com


