Method for measuring oil content of debris and core in oil logging

A measurement method and technology for oil content, which are applied in the preparation of test samples, fluorescence/phosphorescence, material excitation analysis, etc., and can solve the problems of increasing the use of experimental reagents and procedures, cumbersome, and low accuracy of single-point quantitative analysis methods.

Inactive Publication Date: 2005-06-29
OCEAN UNIV OF CHINA
View PDF0 Cites 12 Cited by
  • Summary
  • Abstract
  • Description
  • Claims
  • Application Information

AI Technical Summary

Problems solved by technology

Therefore, the accuracy of the single-point quantitative analysis method that dilutes the sample to the linear range is not high, and the use of experimental reagents and cumbersome procedures will also be increased due to multiple dilutions

Method used


Image

  • Method for measuring oil content of debris and core in oil logging
  • Method for measuring oil content of debris and core in oil logging
  • Method for measuring oil content of debris and core in oil logging

Examples


Embodiment 1

[0015] 1. Select the best difference between excitation wavelength and emission wavelength Δλ for samples in the same well area

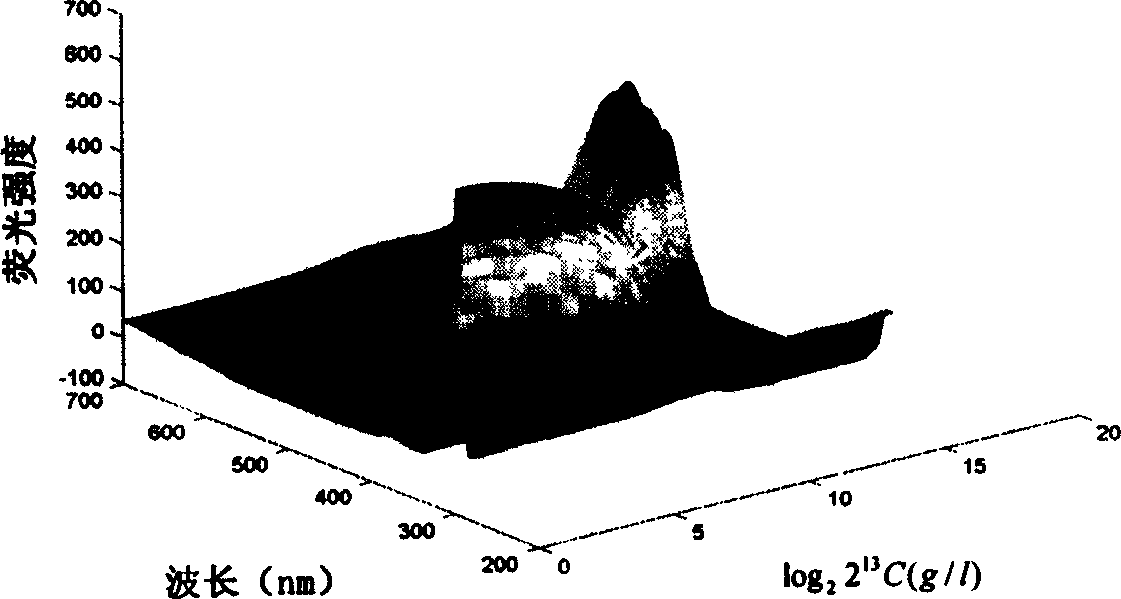
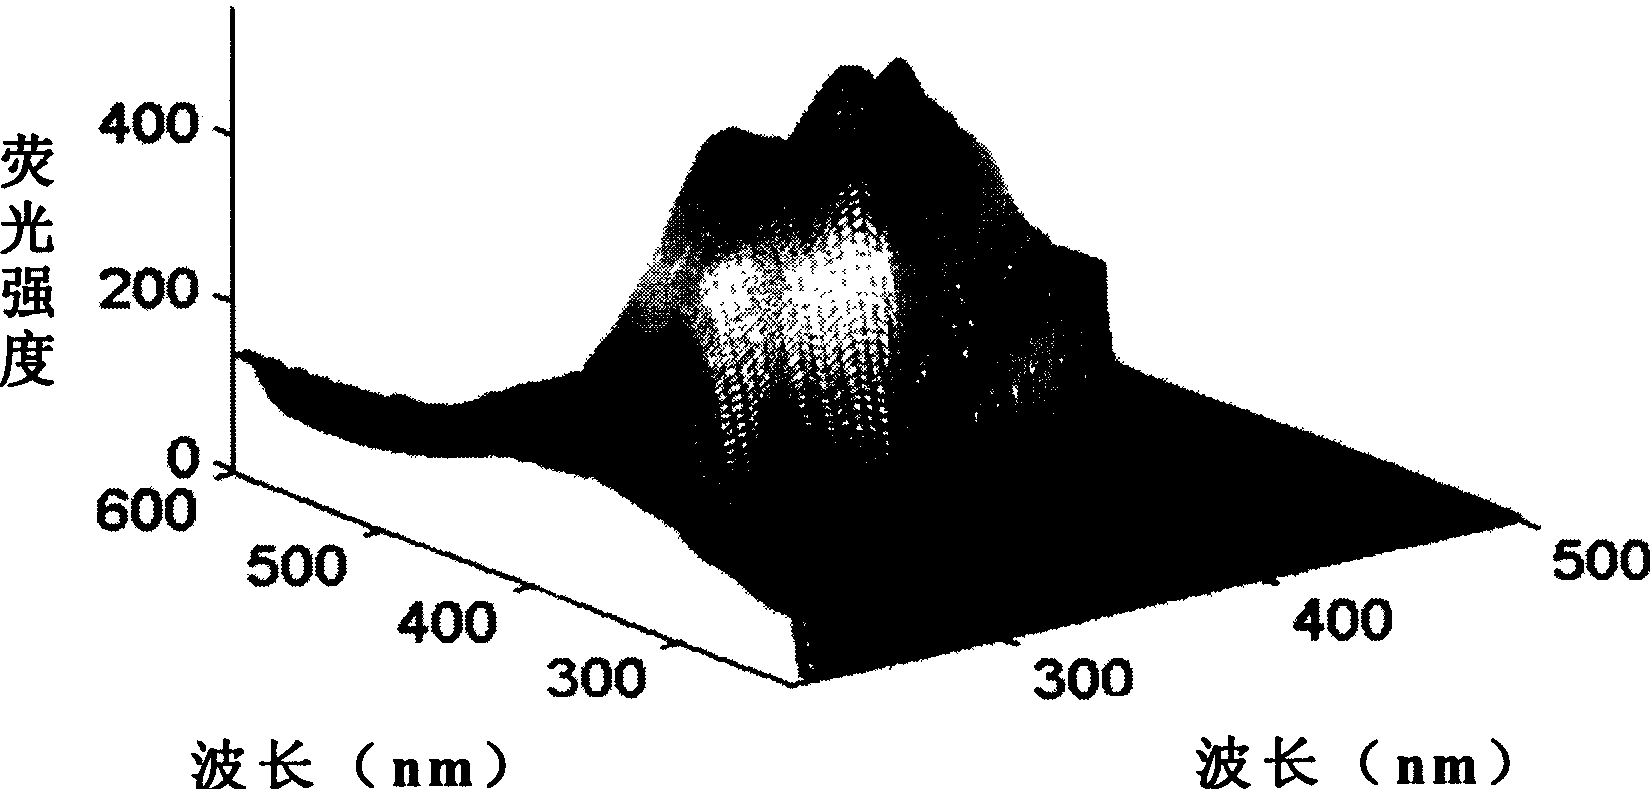
[0016] 1. First, use an electronic scale to weigh a certain well area crude oil as a sample for concentration calibration, dissolve it in n-hexane solvent, configure it as a crude oil standard sample with a certain concentration within the linear range of concentration, and inject it into the liquid of the fluorescence spectrophotometer In the sample cell, select the excitation wavelength from 220nm to 600nm, measure the emission spectrum every 5nm, and input all the spectral data into MATLAB to generate a three-dimensional spectral map and contour map.

[0017] 2. In the three-dimensional contour map, to pass through the main peak of the three-dimensional spectrum and ensure the maximum peak-peak separation at the same time, select a straight line with a slope of 1 and the emission wavelength E m The intercept of the axis is the optimal Δλ.

[001...

Embodiment 2

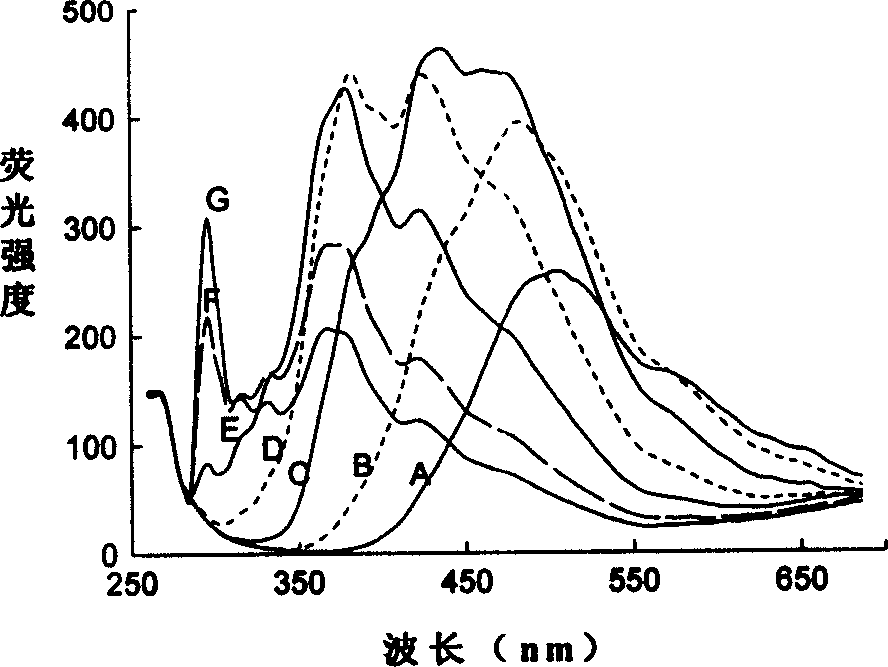
[0026] When there is a lack of three-dimensional instruments or it is difficult to obtain a three-dimensional fluorescence spectrum, when determining the optimal Δλ, you can only rely on selecting a certain interval of Δλ to make a two-dimensional fluorescence spectrum graph, and use the spectral graph with the highest main peak and the largest peak-to-peak separation corresponding to Δλ For optimal Δλ, other steps are basically the same as in Example 1.

[0027] 1. Select the appropriate difference between excitation wavelength and emission wavelength Δλ for samples in the same well area

[0028] 1. Take an oilfield well area as an example: the n-hexane reagent can be chromatographic pure reagent or spectral pure reagent, and the selected concentration is 6.3×10 -2g / l crude oil sample, in the RF5301 fluorescence photometer of Japan Shimadzu Corporation, the simultaneous fluorescence spectrum measurement is carried out for different scanning wavelength differences Δλ=20nm, 30n...


PUM


Abstract

This invention relates to a measurement method of the rock bits oil content in oil well, which comprises the following steps: first to choose the best simultaneous scanning wavelength difference ªñª™ in the same sample area; then to collect the simultaneous fluorescence spectrums within the density measurement range by this fix ªñª™; Then to make the insert process of the data by use of general math process software to form continuous three-dimension density simultaneous fluorescence spectrum database; to separately compare the simultaneous spectrum of the density sample to be measured with the spectrum data of the least square method, wherein, the density of the spectrum data of the least difference is the relative rock core or rock bits oil content.

Description

Technical field: [0001] The invention relates to a method for measuring the oil content of cuttings cores in petroleum logging. Background technique: [0002] Due to the fluorescence characteristic of petroleum, foreign geologists applied the fluorescence detection technology to the drilling site in the 1930s, irradiated the cuttings returned from drilling under the ultraviolet lamp in the dark box, and recorded the fluorescence of the cuttings by visual observation Phenomena (color and grade) to know whether the formation cuttings contain oil, so as to judge the oil generation and storage characteristics of the formation. This conventional fluorescence detection technology is still used in drilling sites, and still plays a guiding role in exploration and development. With the continuous deepening of oil and gas exploration, the exploration and development objects faced are becoming more and more complex and difficult; coupled with the acceleration of drilling speed, the ap...

Claims


Application Information

Patent Timeline
Patent Type & Authority Applications(China)
IPC IPC(8): G01N1/28G01N21/64
Inventor 郑荣儿王春艳张金亮王新顺
Owner OCEAN UNIV OF CHINA
Why Eureka
Try Eureka