Methods and apparatus for complex gentics classification based on correspondence anlysis and linear/quadratic analysis

Inactive Publication Date: 2005-07-07
DNAPRINT GENOMICS +1
View PDF2 Cites 6 Cited by
  • Summary
  • Abstract
  • Description
  • Claims
  • Application Information

AI Technical Summary

Benefits of technology

[0045] Methods and apparatus for identifying associations between genetic information and particular genetic traits are described. A candidate single nucleotide polymorphism (SNP) combination is selected from a plurality of candidate SNP combinations for a gene associated with a genetic trait. Haplotype data associated with this candidate SNP combination are read for a plurality of individuals and grouped into a positive-responding group and a negative-responding group based on whether predetermined trait criteria for an individual are met. A statistical analysis on the grouped haplotype data is performed to obtain a s

Problems solved by technology

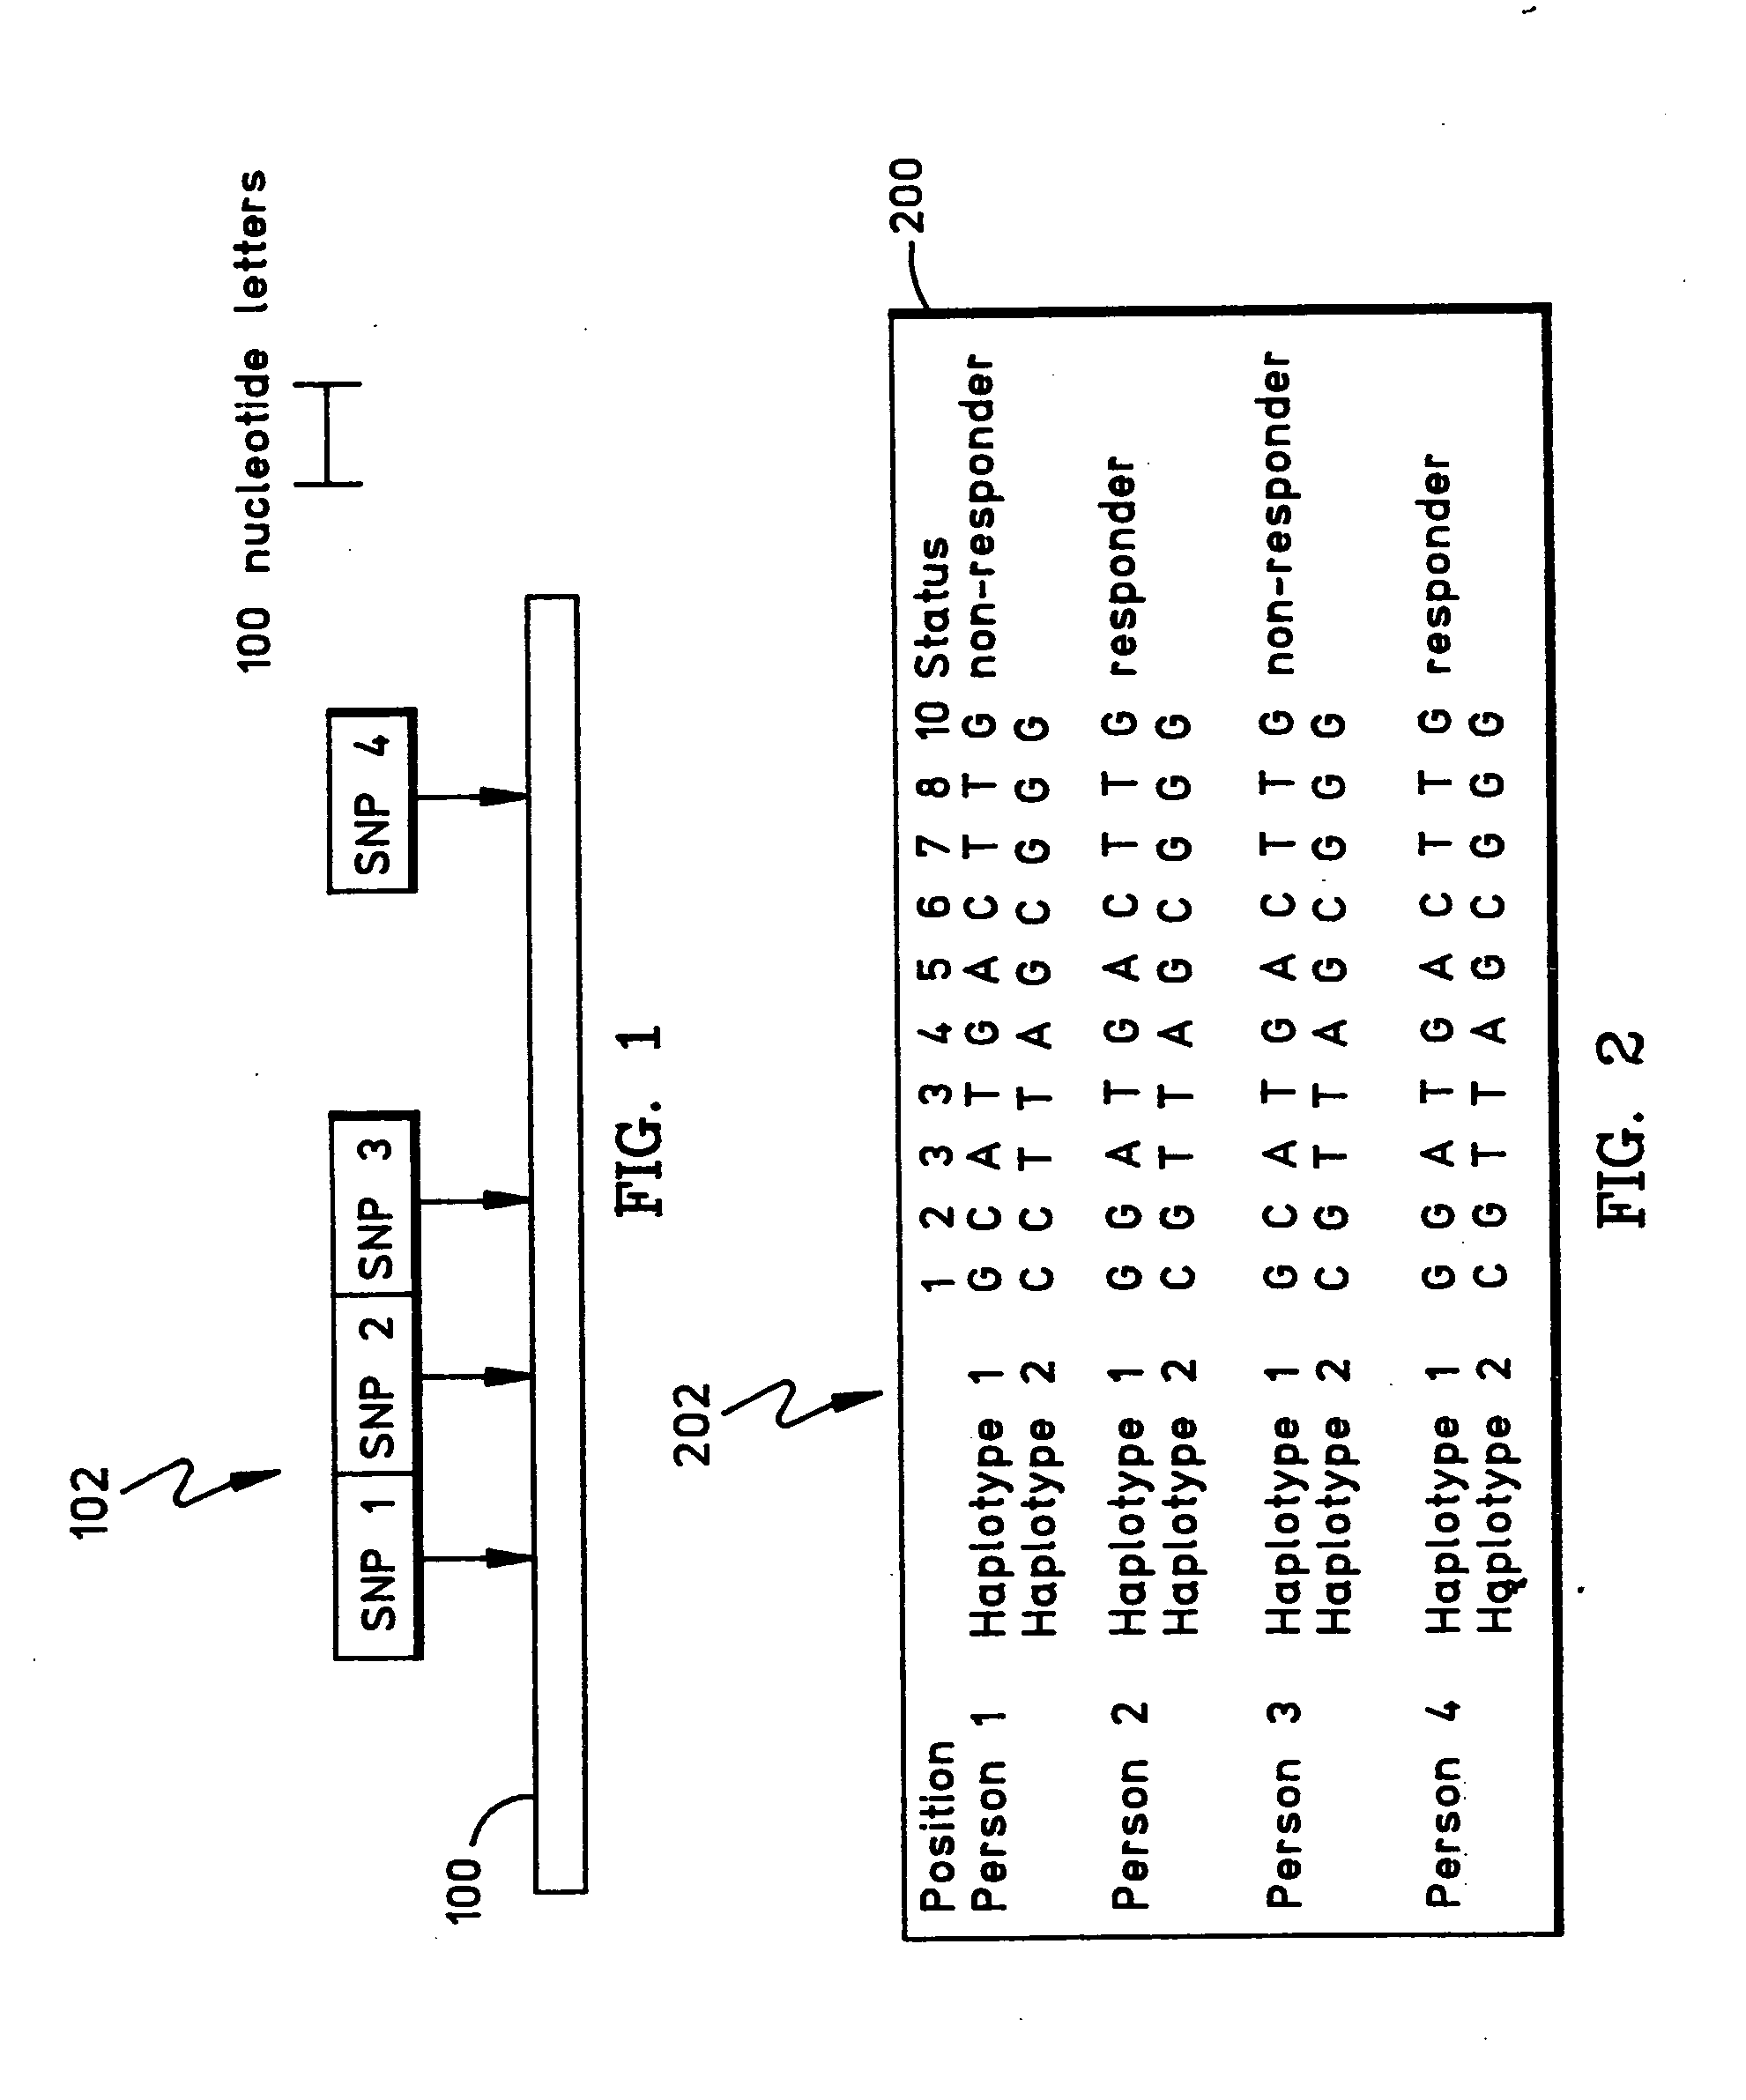
From the representation shown in Text Illustration 4, however, this is more difficult to identify since the SNP genotypes can be combined in several different ways.
When the number of SNPs is larger than 4, the numbers quickly become unmanageable.
Under conventional analysis, however, most genetics researchers do not work at the level of the gene haplotype.
First, these studies generally suffer from lack of statistical power to detect associations, a power that is imparted to haplotype studies by systematic genetic forces that have shaped the genetic structure of our modern day population.
Second, they are inappropriate for solving complex genetic issues.
Because most human traits are complex functions of intergenic (sets of SNPs and ploidy issues) and intragenic (i.e. multiple gene-gene interactions) factors, this is a serious limitation.
The problem with this approach is that it is somewhat arbitrary and leaves most of the SNPs in the gene untested even though they may be linked, within the context of a specific combination, to the trait under study.
Thus, if variants for such a gene were the cause of the non-response trait, and this variability could be ascribed to one or two SNPs, most of the haplotype systems chosen for study would be worthless for predicting the trait (given the laws of probability).
This poses a tremendous statistical barrier for current day genetic research.
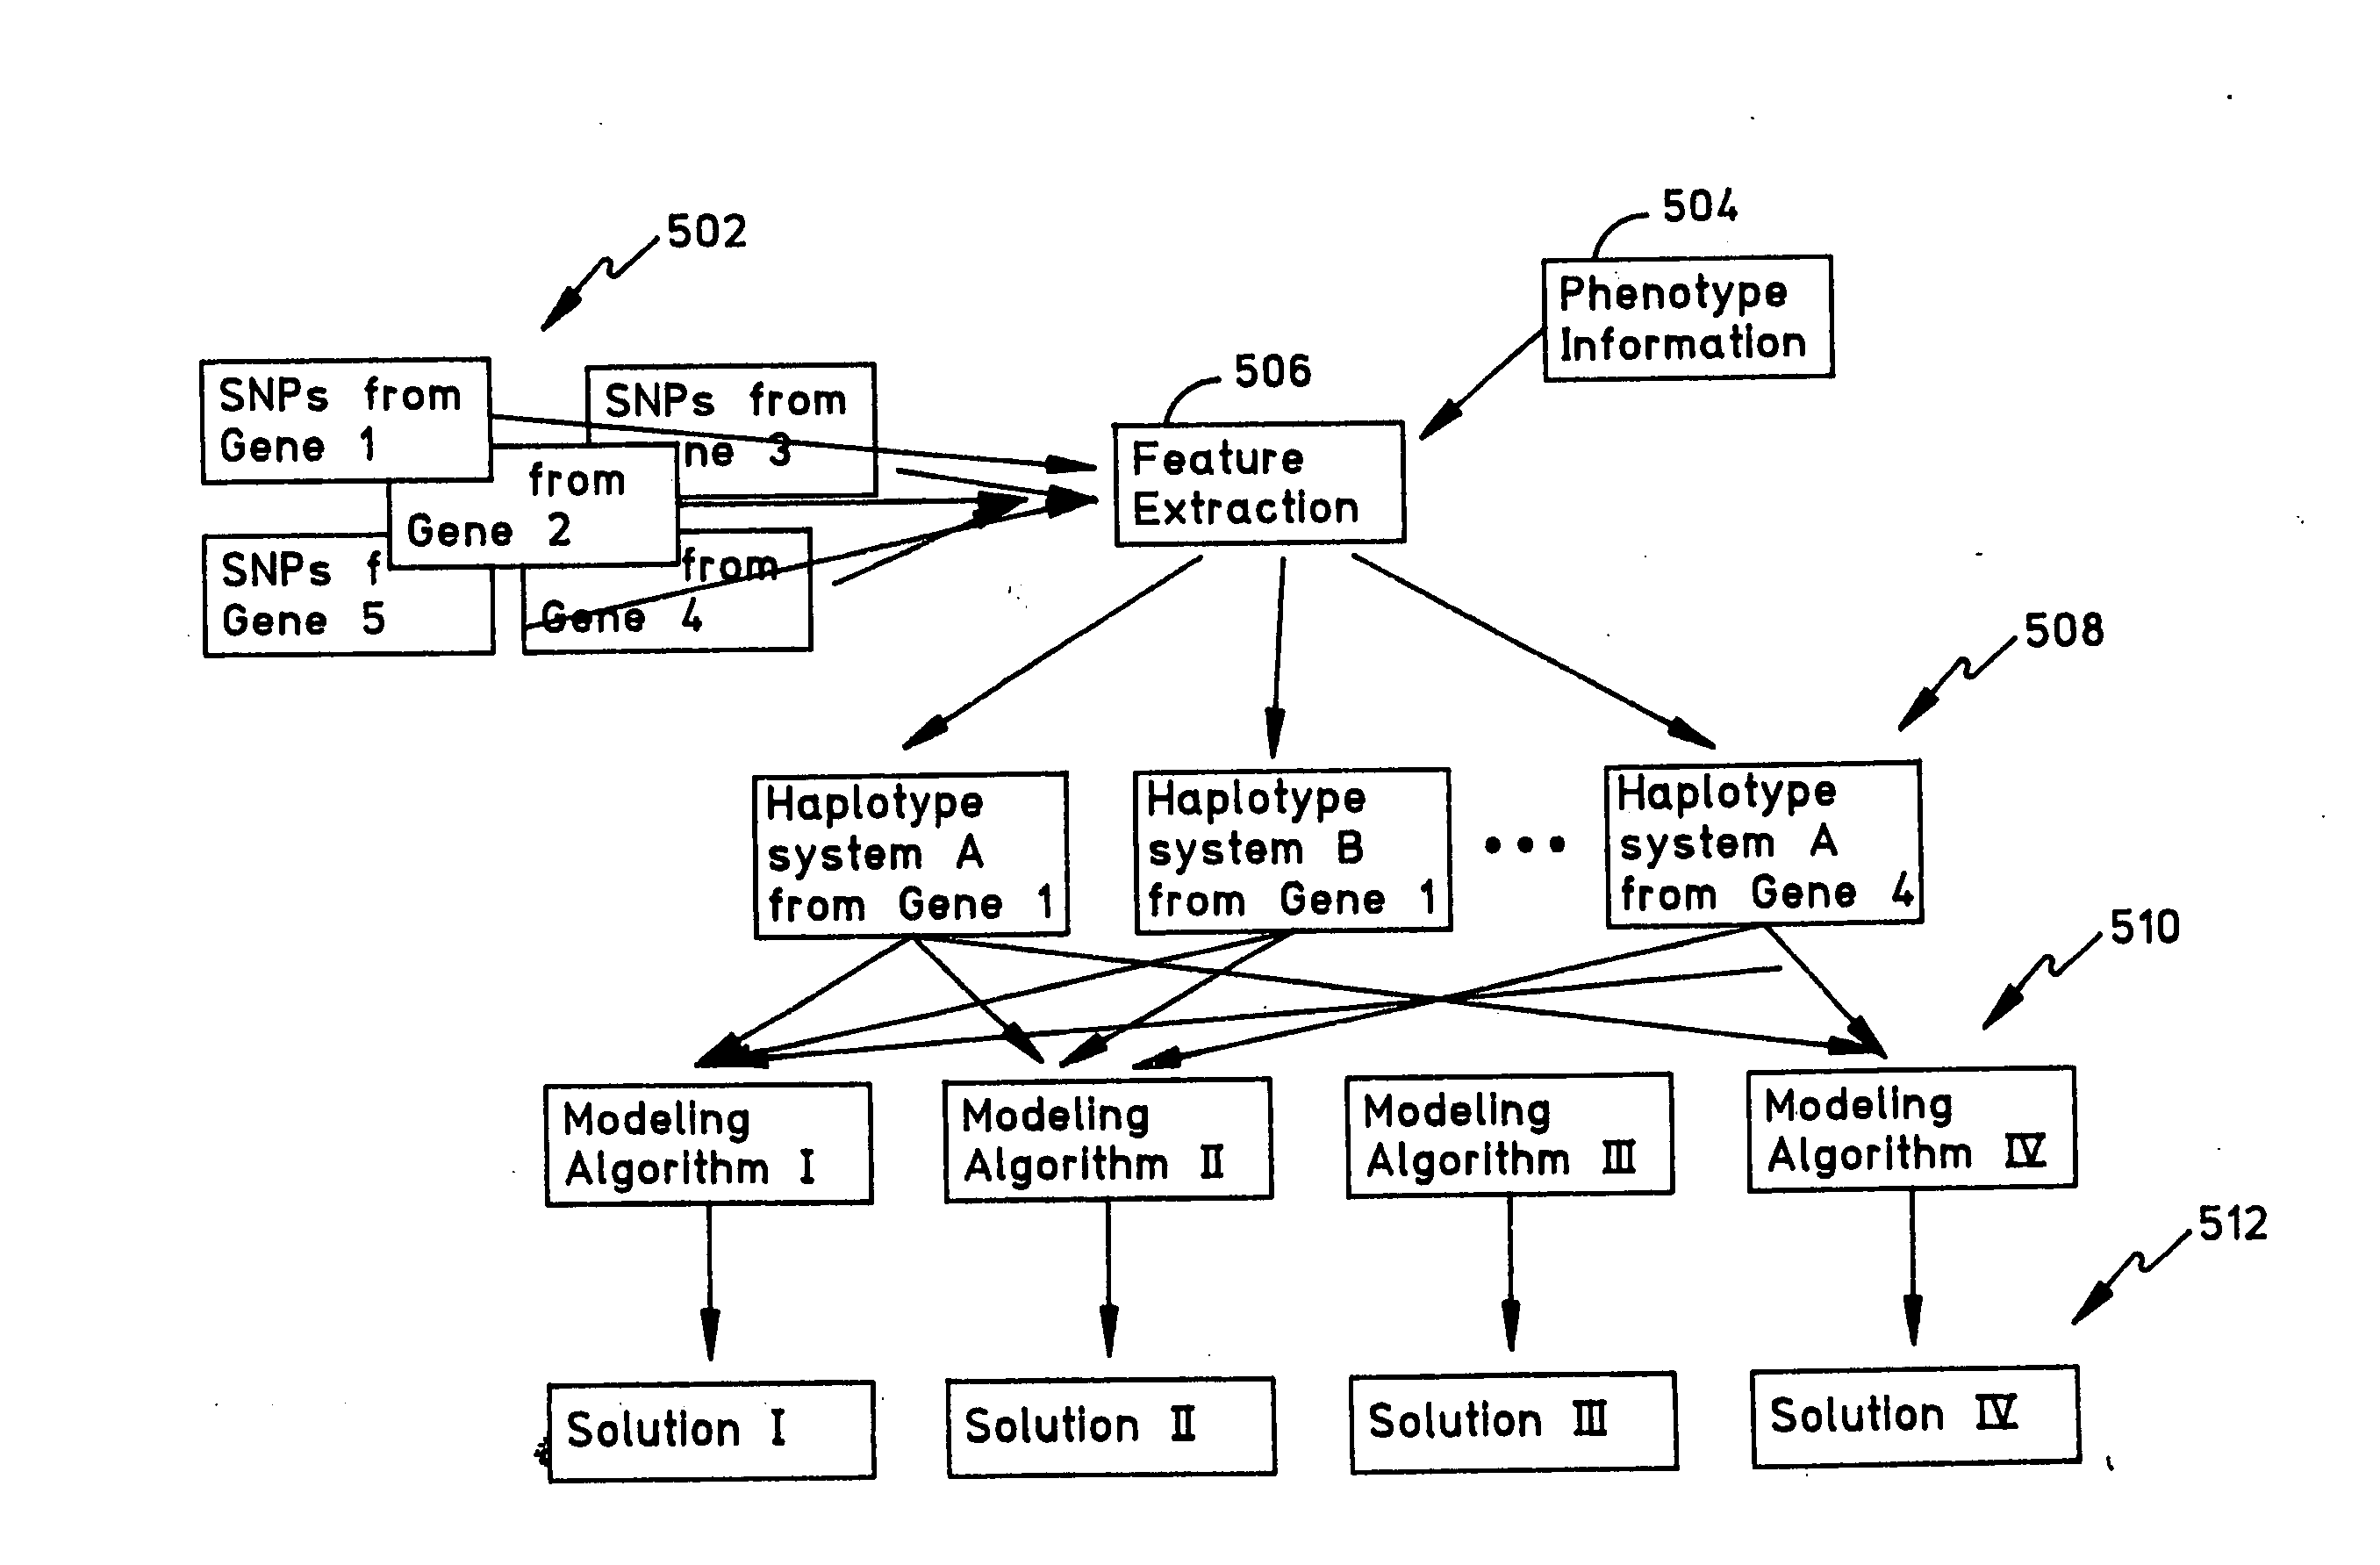
As apparent, a significant problem with conventional methods is that there is no logic or computer software that exists to predict which sets of SNPs define the optimal haplotype system for understanding the trait.
In either case, there is no way to predict which will be the case.
First, short haplotype systems have fewer possible haplotypes and fewer diploid haplotype combinations than do long haplotype systems.
This is because SNPs found in other regions are not relevant for the trai

Method used


Image

  • Methods and apparatus for complex gentics classification based on correspondence anlysis and linear/quadratic analysis
  • Methods and apparatus for complex gentics classification based on correspondence anlysis and linear/quadratic analysis
  • Methods and apparatus for complex gentics classification based on correspondence anlysis and linear/quadratic analysis

Examples


example

[0252] In the study of the association between genotypes and eye color, Table 1 is constructed for OCA3LOC109 gene.

TABLE 1Genotype / Eye ColorLightDarkTotalG11: (ATA, ATA)471158G12: (ATA, ATG)551065G13: (ATA, ACG)101G14: (ATA, GCA)29736G15: (ATA, GCG)16622G16: (ATA, GTA)347G17: (ATA, GTG)347G22: (ATG, ATG)16622G23: (ATG, ACG)101G24: (ATG, GCA)8816G25: (ATG, GCG)101020G26: (ATG, GTA)011G27: (ATG, GTG)022G44: (GCA, GCA)5611G45: (GCA, GCG)347G47: (GCA, GTG)101G55: (GCG, GCG)123G56: (GCG, GTA)011Total19982281

The Chi-square value=42.5478. Under the significant level of 0.05, when the 15 degree of freedom is 17, the critical value of χ2 is 32.2020. So, the null hypothesis H0(Ω) needs to be rejected. Then some specific genotypes are chosen based on the above table, which explain this significance.

[0253] If using 3.0 as standard, the whole table of 18 rows can be divided into two subsets: U0={G12, G24, G25, G27, G44} and V0={G11, G13, G14, G15, G16, G17, G22, G23, G26, G45, G47, G55, G56}...


PUM


Abstract

Software methods for identifying associations between genetic information and particular genetic traits are described. A candidate single nucleotide polymorphism (SNP) combination is selected from a plurality of candidate SNP combinations for a gene associated with (or suspected to be associated with) a genetic trait. Haplotype data associated with this candidate SNP combination are read for a plurality of individuals and grouped into a positive-responding group and a negative-responding group based on whether a predetermined trait criteria for an individual is met. A statistical analysis on the grouped haplotype data is performed to obtain a statistical measurement associated with the candidate SNP combination. The acts of selecting, reading, grouping, and performing are repeated as necessary to identify the candidate SNP combination having the optimal statistical measurement (if one exists). In one approach, all possible SNP combinations are selected and statistically analyzed. In another approach, a directed search based on results of previous statistical analysis of SNP combinations is performed until the optimal statistical measurement is obtained. In addition, the number of SNP combinations selected and analyzed may be reduced based on a simultaneous testing procedure.

Description

CROSS-REFERENCE TO RELATED APPLICATIONS [0001] This application claims the benefit of U.S. Provisional Patent Application Ser. No. 60 / 338,771 filed on Dec. 3, 2001, and U.S. patent application Ser. No. 10 / 120,804 filed on Apr. 11, 2002 which is a conversion thereof.SEQUENCE LISTING [0002] This patent hereby incorporates by reference a Sequence Listing on compact disc (CD). More particularly, two CDs (one original and one duplicate copy) named DNAPRINT_SEQLIST have been submitted to the Patent Office, each of which includes the Sequence Listing in a file named “seq_listing” created on Jul. 10, 2002 and having a size of 4.27 KB. TECHNICAL FIELD [0003] The present invention relates generally to methods for identifying genetic features of a particular complex genetic trait, and more particularly to software-based methods which utilize statistical analyses for identifying one or more haplotype systems, alleles of which are useful for predicting a particular complex genetic trait. BACKGRO...

Claims


Application Information

Patent Timeline
IPC IPC(8): G16B20/40C12PG01N33/48G01N33/50G16B20/00G16B20/20G16B40/00
CPCG06F19/24G06F19/18G16B20/00G16B40/00G16B20/20G16B20/40
Inventor FRUDAKIS, TONY NICKKONDRAGUNTA, VENKATESWARLUNATARAJAN, SIVAMANI
Owner DNAPRINT GENOMICS
Why Eureka
Try Eureka