Analyte filter method and apparatus

an analytical filter and filter method technology, applied in the field of biomedical methods and apparatus, can solve the problems of increasing errors, unrealistic identification performance of analytical instruments, and differences between spectrometers even of the same design, so as to enhance the analysis of non-invasive spectra and improve analytical performan

Inactive Publication Date: 2006-01-26
GLT ACQUISITION
View PDF29 Cites 308 Cited by
  • Summary
  • Abstract
  • Description
  • Claims
  • Application Information

AI Technical Summary

Problems solved by technology

Therefore, as the instrument or environment state changes the model components does not exactly match the current state.
Identical performance of analytical instruments is unrealistic even with the successful implementation of tight quality control on instrument hardware.
For example, variation in the output of a source, quality of lenses or mirrors, alignment, and detector response, which are limited by manufacturing tolerances, result in differences between spectrometers even of the same design.
Variations between the spectrometers result in errors when using a calibration developed on a spectrometer to determine parameters with a second spectrometer.
Generally, this error is increasingly detrimental as the signal-to-noise ratio of the determined analyte decreases.
However, the technique is not efficient in terms of time and money.
Also, the quality of the calibration is suspect in terms of inability to predict future conditions that need to be incorporated into the original calibration.
In addition, the technique does not readily allow incorporation of future conditions that are later identified without a new experimental design and development of a new or updated calibration.
Full recalibration of an analyzer is not preferable due to time requirements, technical expertise requirements, and expense.
In addition, recalibration often fails to capture a full range of parameters, such as variations in the environment and instrument, thereby forcing additional recalibrations as the state of these parameters change.
A number of difficulties exist for remeasuring standards.
First, instability of the sample creates difficulties in producing a spectrum that is constant across time.
Second, reproducing the environment, which affects the resulting spectra is difficult.
Third, movement of the analyzer is an issue due to alignment.
Replacement of analyzer components also leads to generation of spectra that are not reproducible.
Diabetes is a chronic disease that results in improper production and use of insulin, a hormone that facilitates glucose uptake into cells.
Diabetes is a leading cause of death and disability worldwide.

Method used


Image

  • Analyte filter method and apparatus
  • Analyte filter method and apparatus
  • Analyte filter method and apparatus

Examples


example i

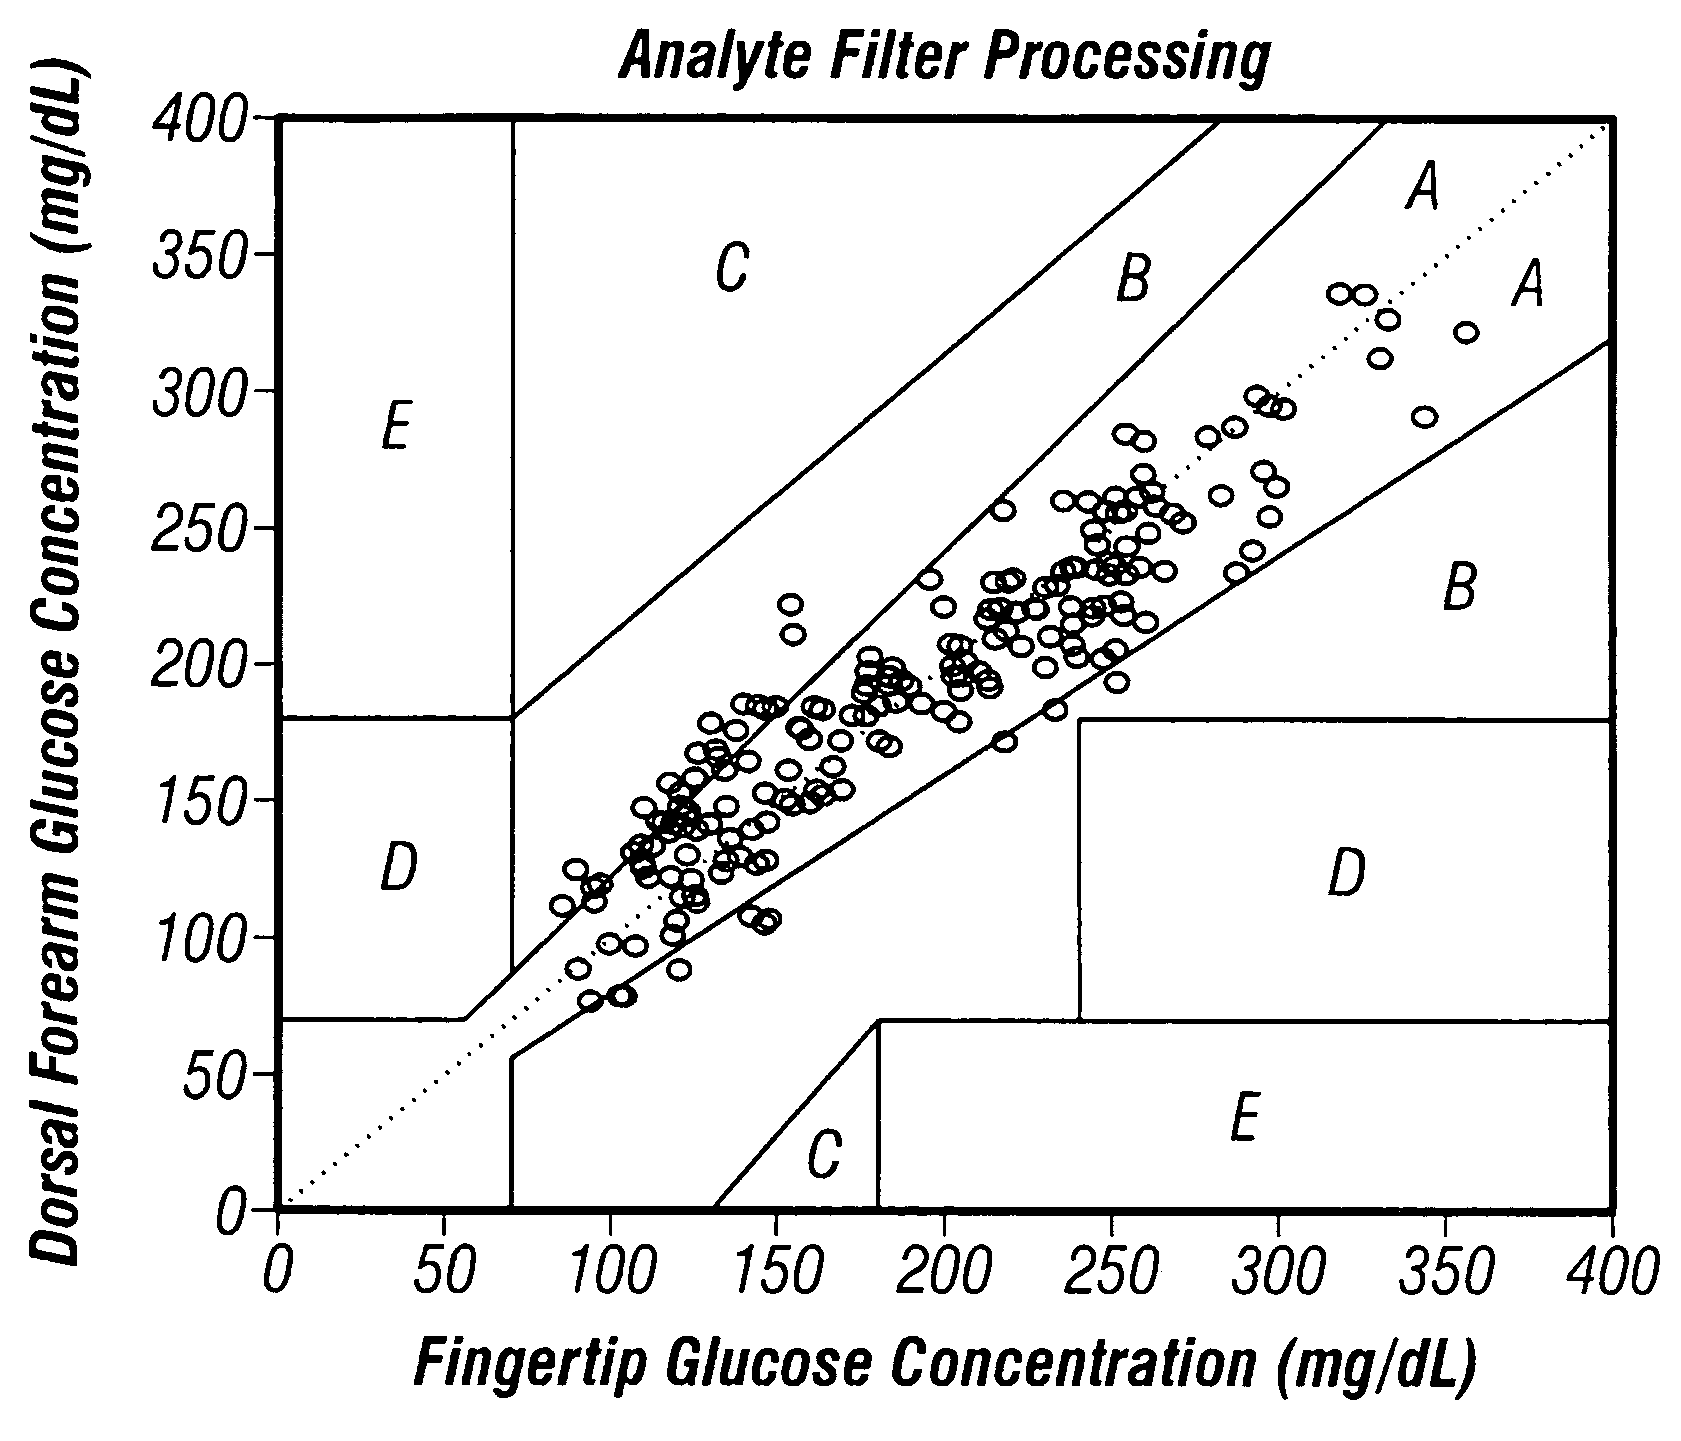
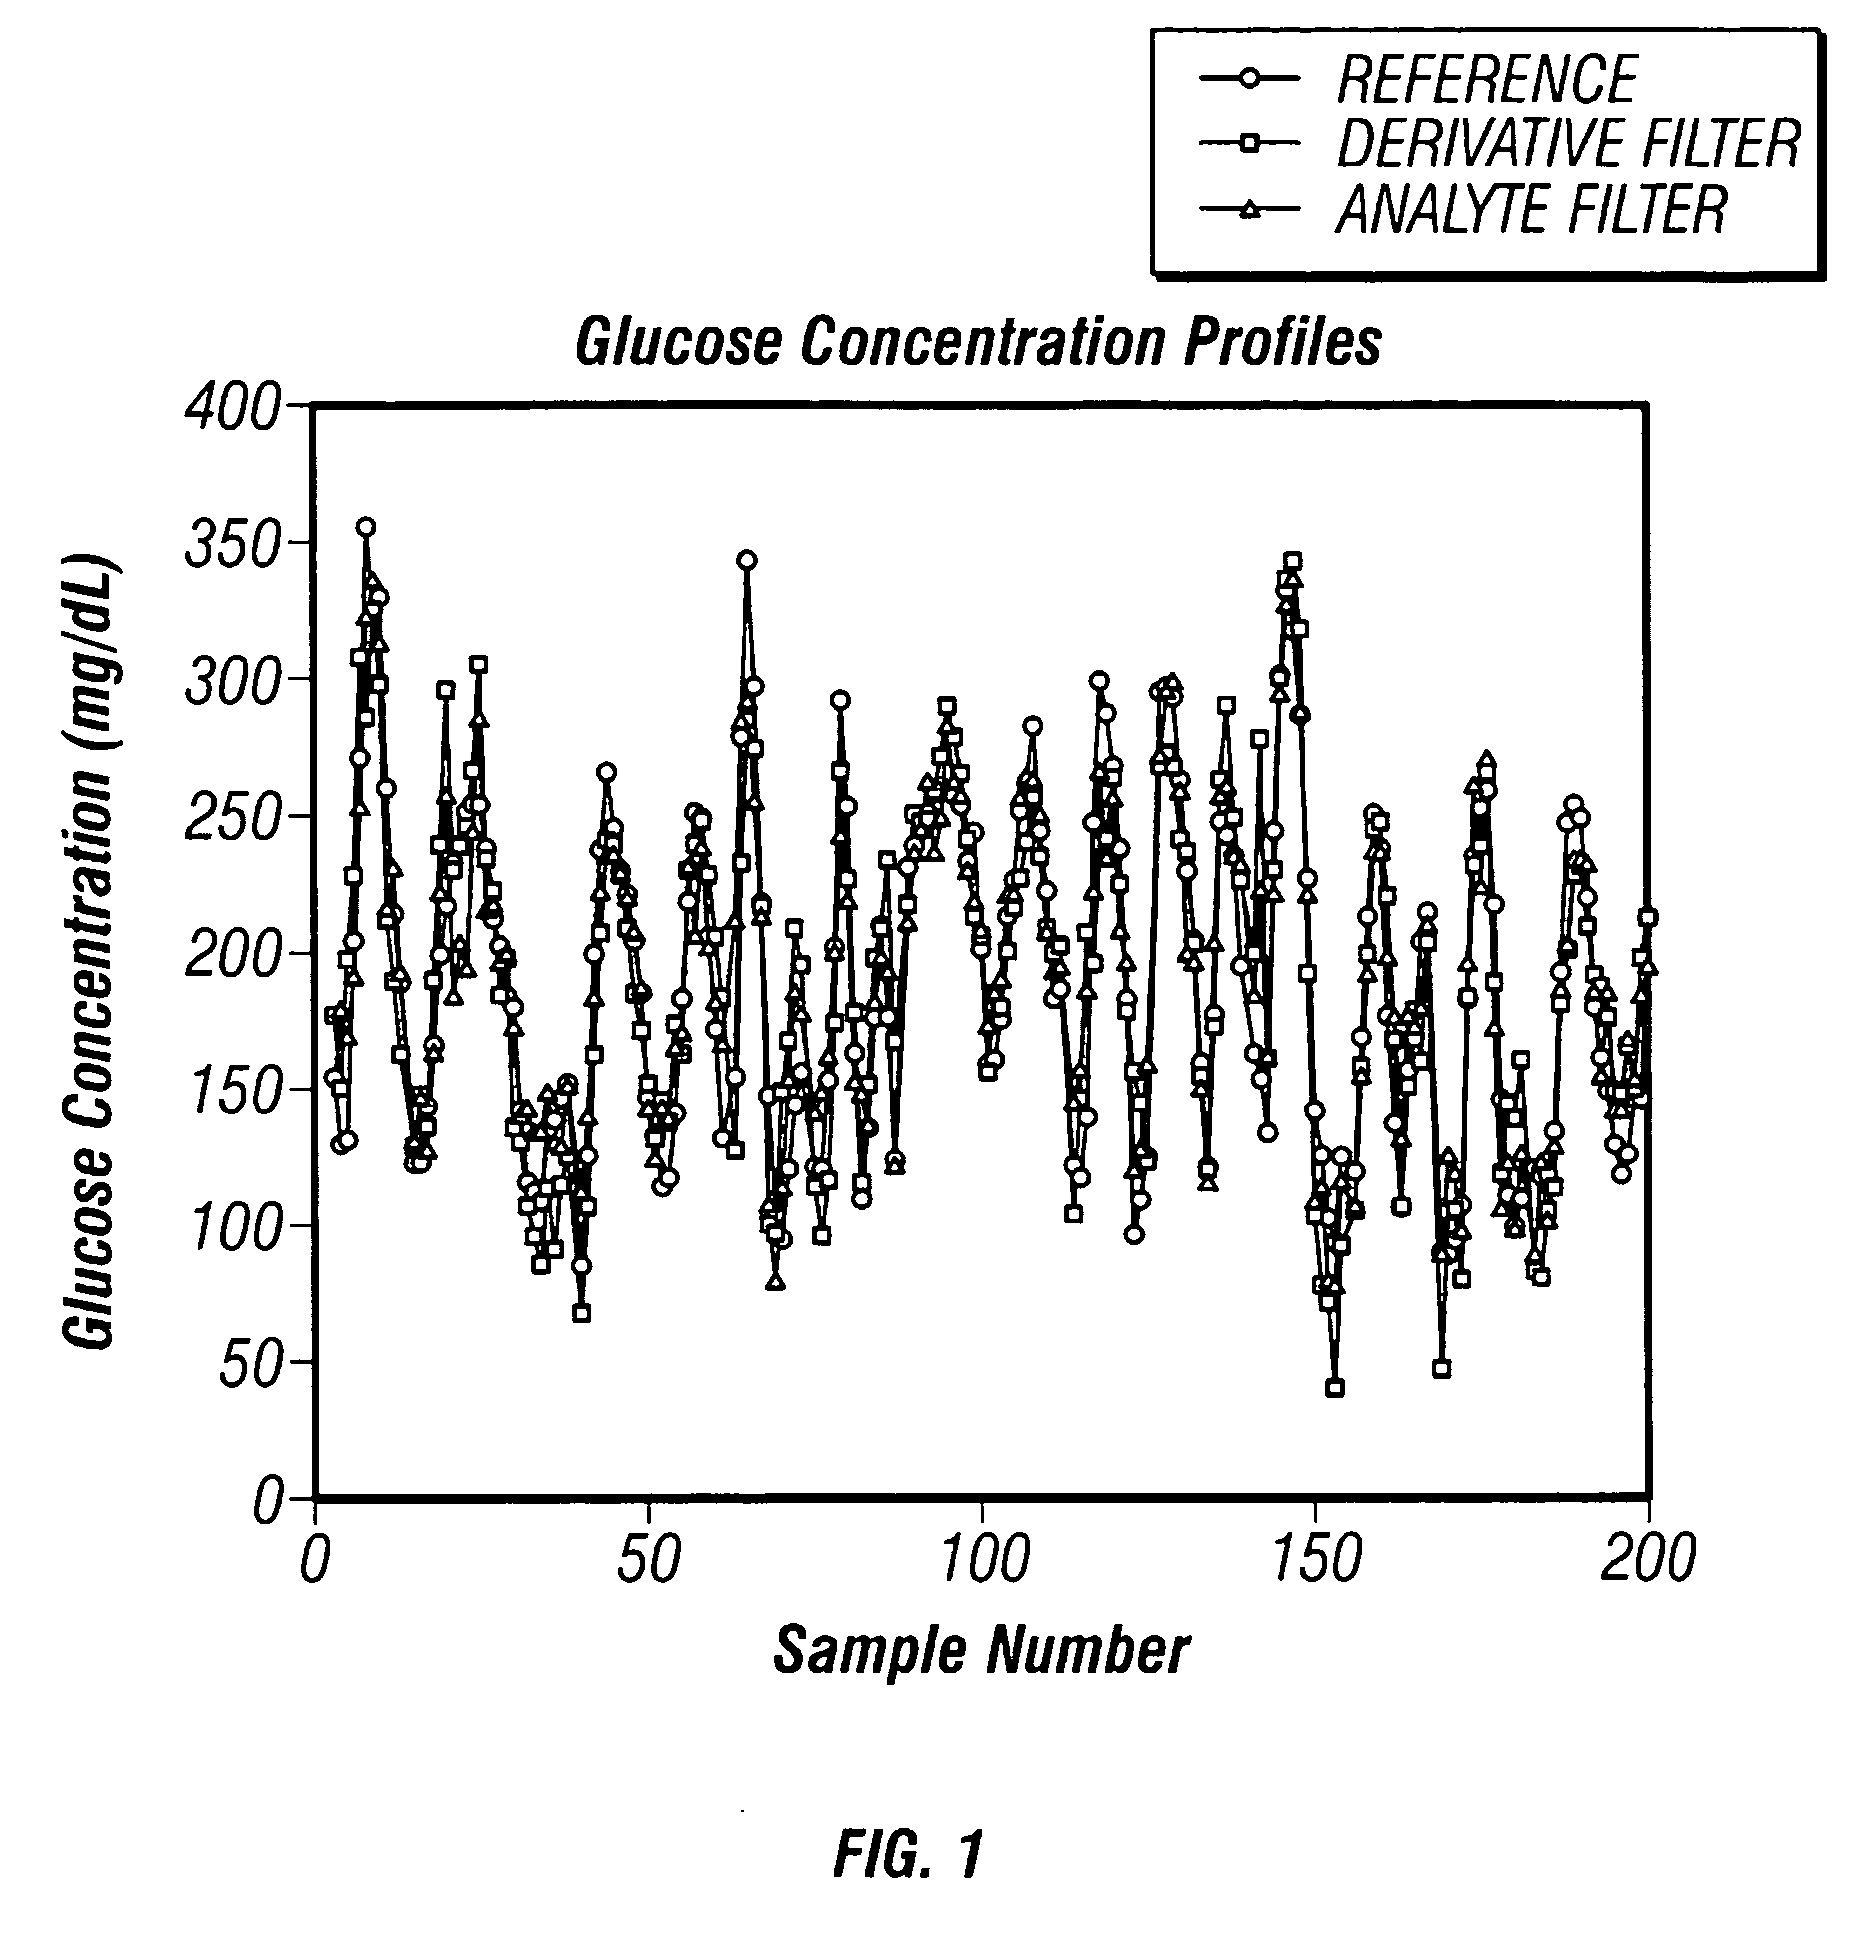
[0035] A data set is provided requiring multivariate analysis to derive an analyte property from a spectral data set. The data set, without modification, is processed separately first with a derivative filter and second with an analyte filter. Enhanced analyte property estimation is demonstrated with the analyte filter approach compared to the derivative filter approach demonstrating the advantage of an analyte filter over a derivative filter.

Instrumentation

[0036] A diffuse reflectance based glucose analyzer was used to collect calibration and estimation, also referred to as prediction, near-infrared spectra. The glucose analyzer included a sample module and a base module coupled by a communication bundle. The sample module included a source, backreflector, and optics. The communication bundle carried power and optical signal. The base module included a grating and a linear photo diode array detector. Wavelength and intensity references were collected and used. In this case, the ...

example ii

Shape Based Design

[0058] An analyte filter is optionally created or optimized using the shape of the target analyte, preferably in conjunction with interference. The pure component spectrum of a target analyte is often considered the signal of interest in applications involving spectroscopy and noninvasive analyte property determination. The use of preprocessing techniques is traditionally aimed at enhancing and extracting the pure component analyte signal. However, the true signal of interest in multivariate applications is contained in the shape of the target analyte after orthogonalization with respect to the interference. Specifically, the net analyte signal defines that portion of the pure component analyte spectrum that is accessible for analyte measurement and is often significantly different than the pure component spectrum related to the target analyte.

[0059] Therefore, shape is the signal in the presence of interference. One measure of signal strength is the net analyte ...

example iii

Theoretical Design

[0065] In another embodiment of the invention, a-priori knowledge of the measured system is used in the creation and / or optimization of an analyte filter. The use of a-priori knowledge for the development of an analyte filter is accomplished by selecting, parameterizing, and implementing an optimized filter using what is known about noise, interference, and the signal of interest. This method does not directly rely on a set of empirical data for the determination of the analyte filter, but instead uses theoretical methods to make a robust and optimal system for separating the spectroscopic signal from noise and interference. Optionally, a-priori knowledge is used in conjunction with, subsequent to, concurrently with, or iteratively with empirical data in analyte filter creation.

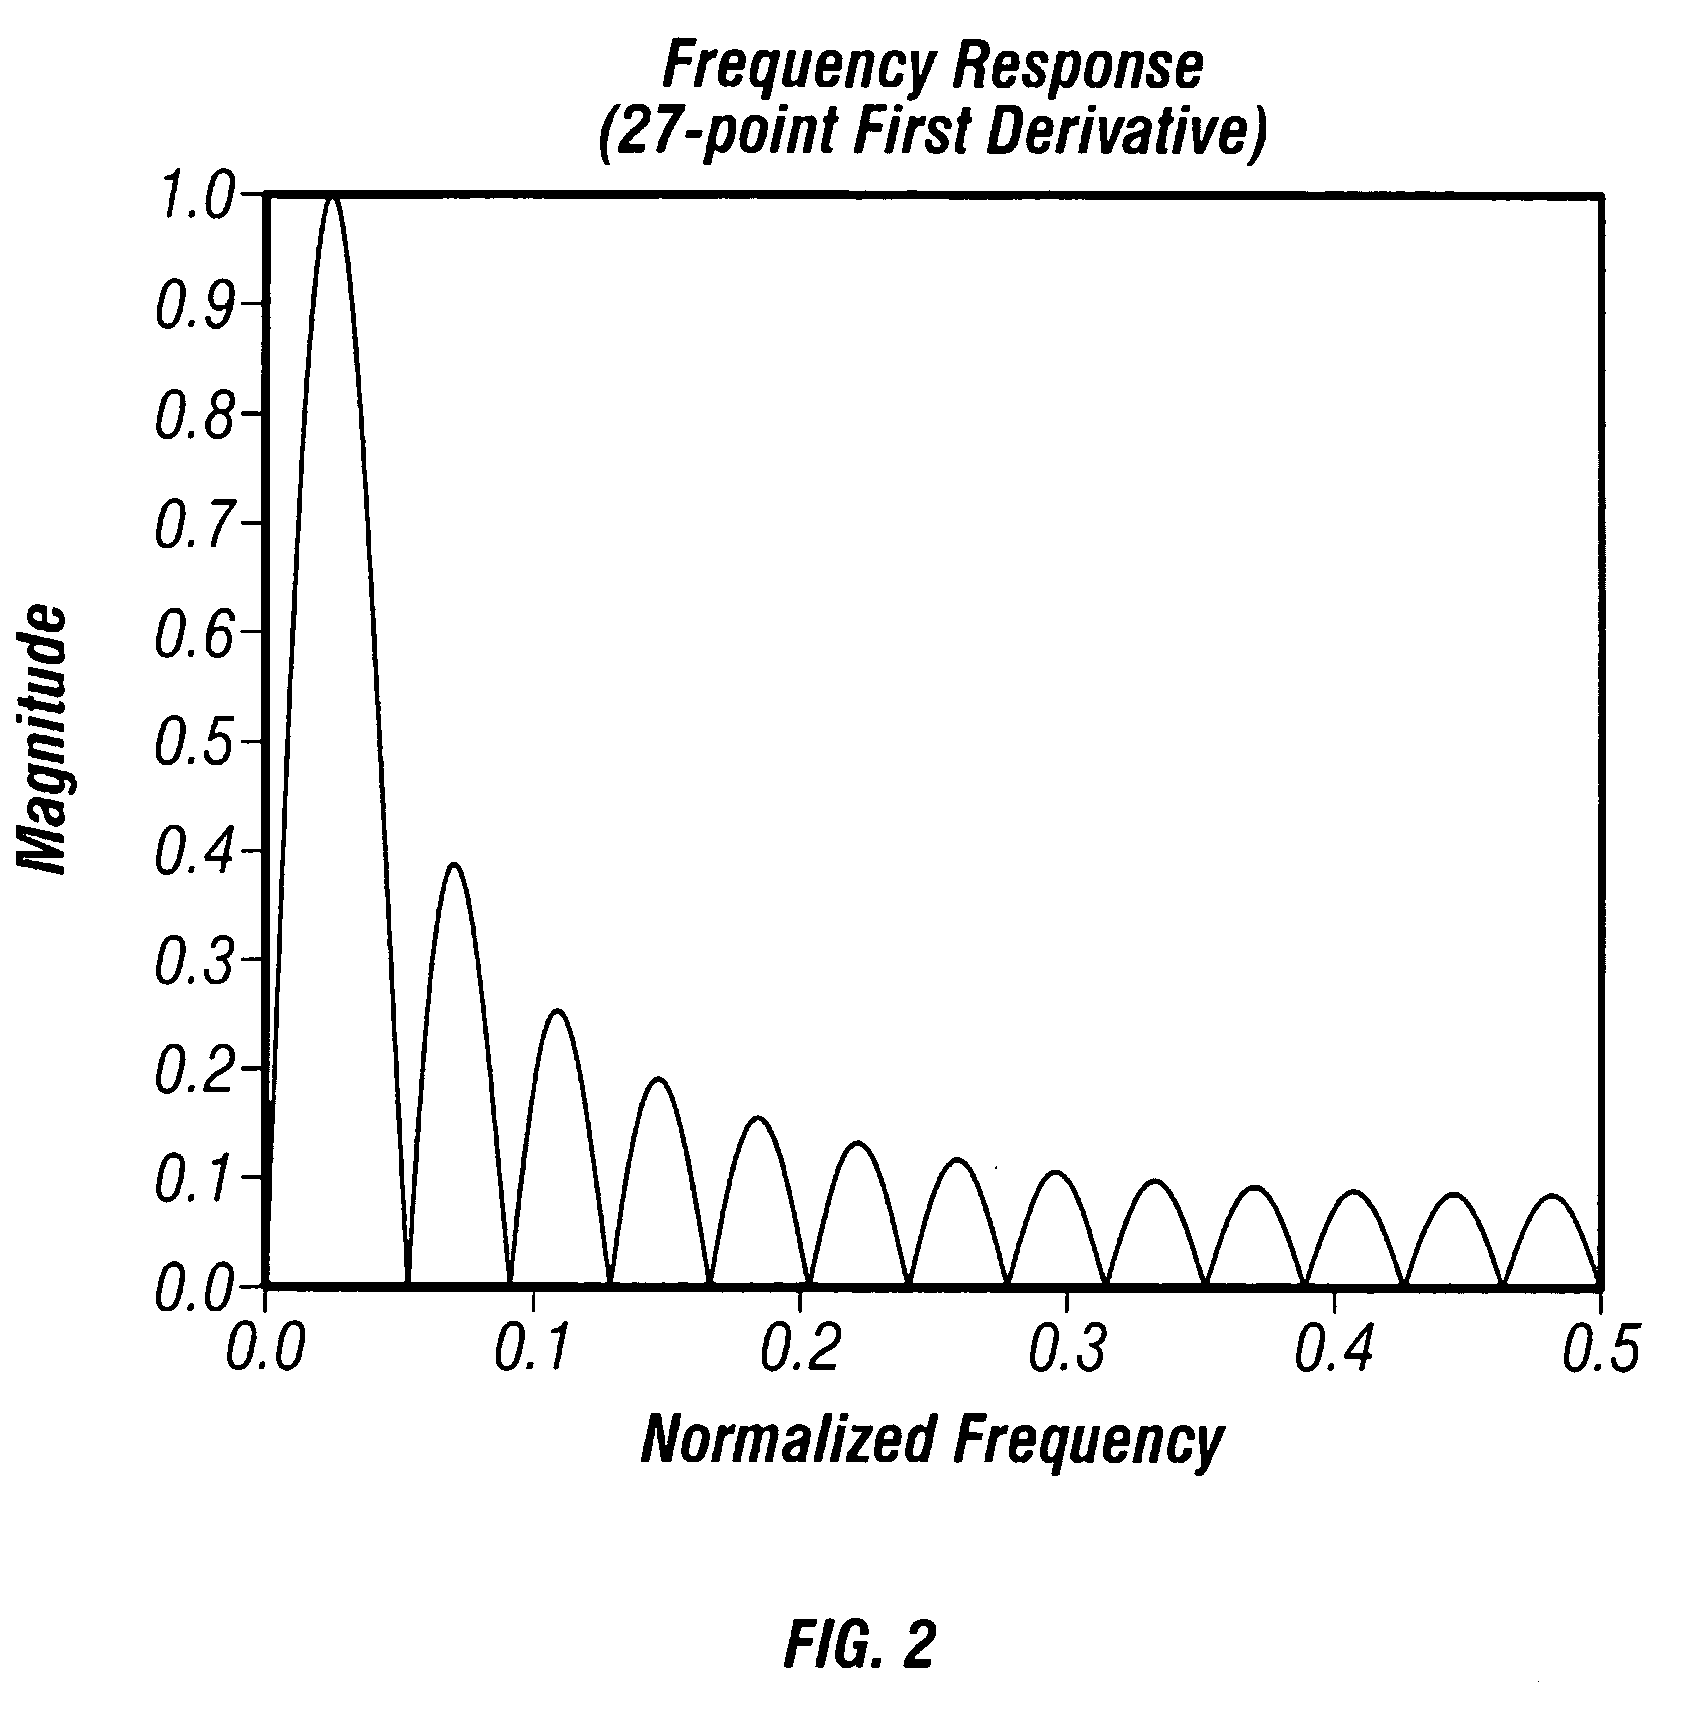
[0066] The a-prior information about random noise is in the form of one or more models, such as a statistical model, that are used to provide the corresponding frequency characteristics, N...


PUM


Abstract

The invention comprises a method and apparatus for enhancing the analysis of noninvasive spectra, resulting in improved analytical performance. More particularly, the invention comprises a method and apparatus for processing noninvasive spectra with an analyte filter that preferably rejects variation likely to be detrimental to the measurement system, while passing signal that probabilistically is unique to the target analyte. Subsequently, the analyte filtered data are used to estimate an analyte property, such as a glucose concentration, in the presence of noise, interferences, state changes, and / or across analyzers.

Description

CROSS REFERENCE TO RELATED APPLICATIONS [0001] This application claims benefit of U.S. provisional patent application Ser. No. 60 / 599,431 filed Aug. 6, 2004 and is a continuation-in-part of U.S. patent application Ser. No. 10 / 870,727 filed Jun. 16, 2004, which is a divisional of U.S. patent application Ser. No. 09 / 664,973 filed Sep. 18, 2000 now U.S. Pat. No. 6,864,978, which is a continuation-in-part of U.S. patent application Ser. No. 09 / 359,191, filed Jul. 22, 1999, now U.S. Pat. No. 6,280,381, which claims benefit of U.S. provisional patent application Ser. No. 60 / 116,883 filed Jan. 22, 1999.BACKGROUND OF THE INVENTION [0002] 1. Technical Field [0003] The invention relates generally to biomedical methods and apparatus. More particularly, the invention relates to processing spectra to yield enhanced analyte property estimations. Still more particularly, the invention relates to generating and using an analyte filter designed to an analyte signal shape in the presence of interfere...

Claims


Application Information

Patent Timeline
Patent Type & Authority Applications(United States)
IPC IPC(8): G01J3/28
CPCG01J3/28G01J3/433G01N2201/1293G01N21/359G01N2201/129G01N21/274
Inventor RUCHTI, TIMOTHY L.LORENZ, ALEXANDER D.HAZEN, KEVIN H.
Owner GLT ACQUISITION
Why Eureka
Try Eureka