Non-invasive tissue glucose level monitoring
a glucose level and tissue technology, applied in the field of non-invasive tissue glucose level monitoring, can solve the problems of severe damage to vital organs, insufficient insulin production or response of the body, and inability to properly monitor the glucose level of the tissue,
- Summary
- Abstract
- Description
- Claims
- Application Information
AI Technical Summary
Benefits of technology
Problems solved by technology
Method used
Image
Examples
example 1
Glucose Levels of Diabetic Versus Non-Diabetic Mice
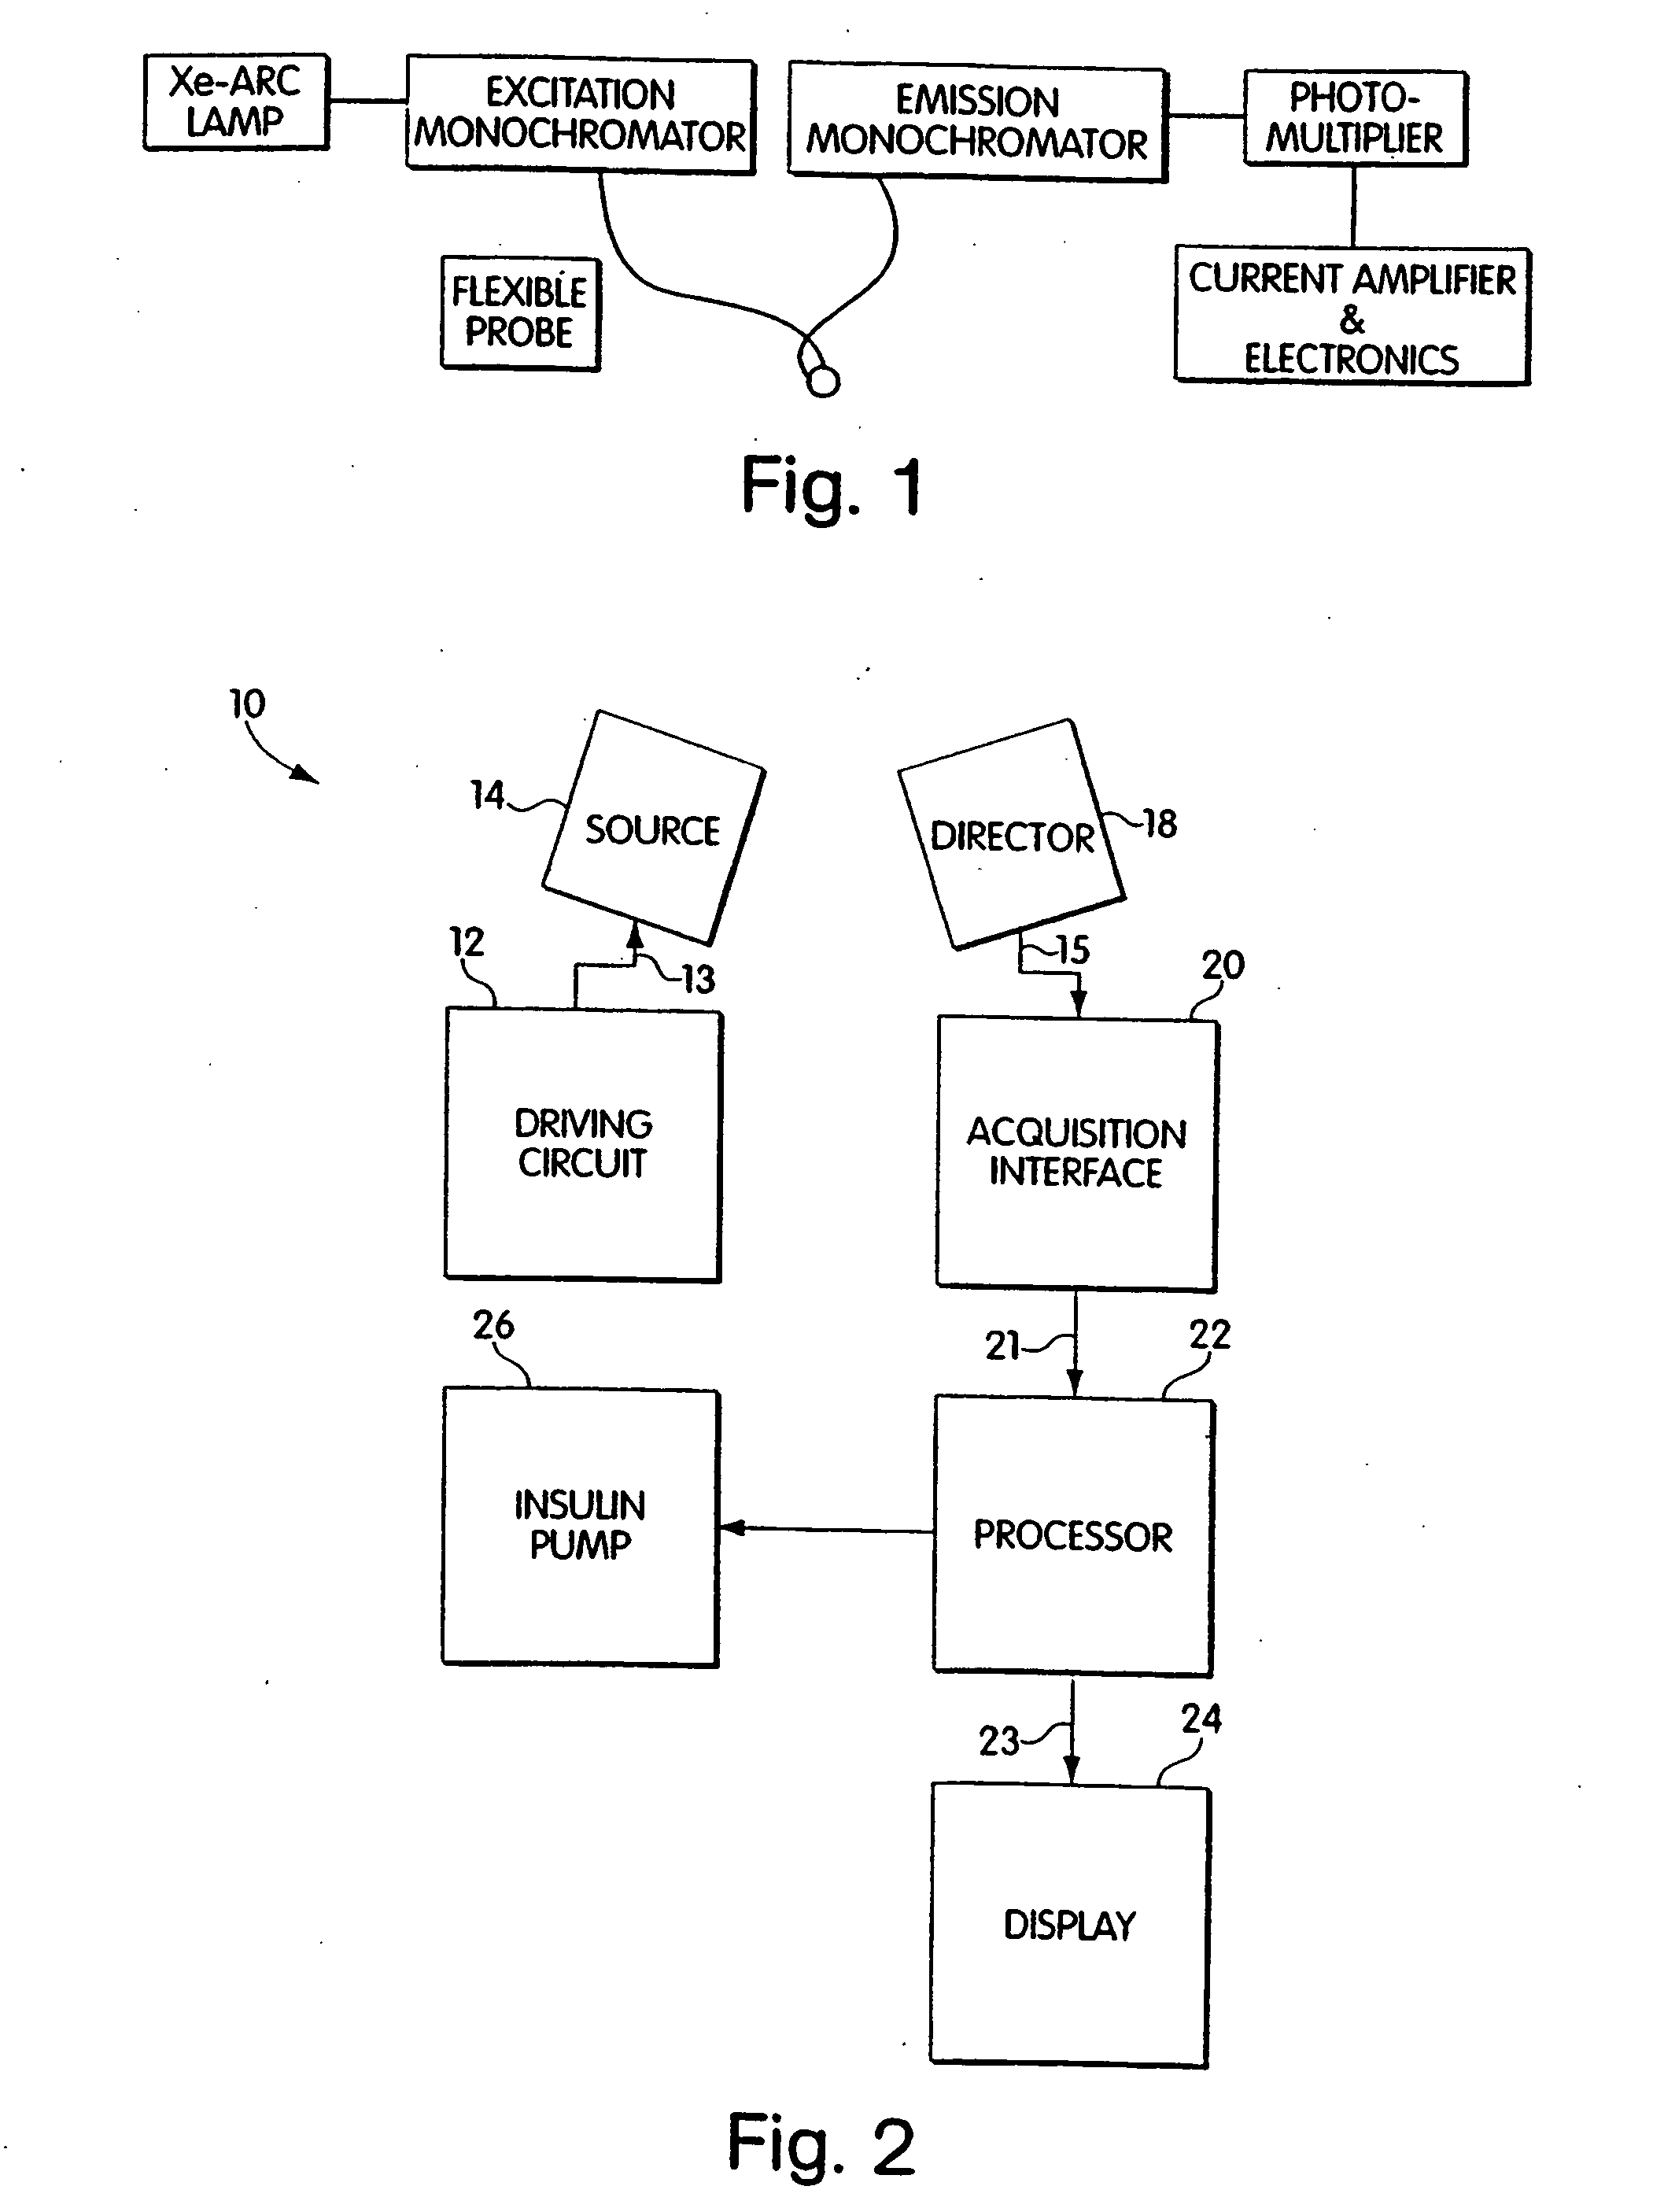
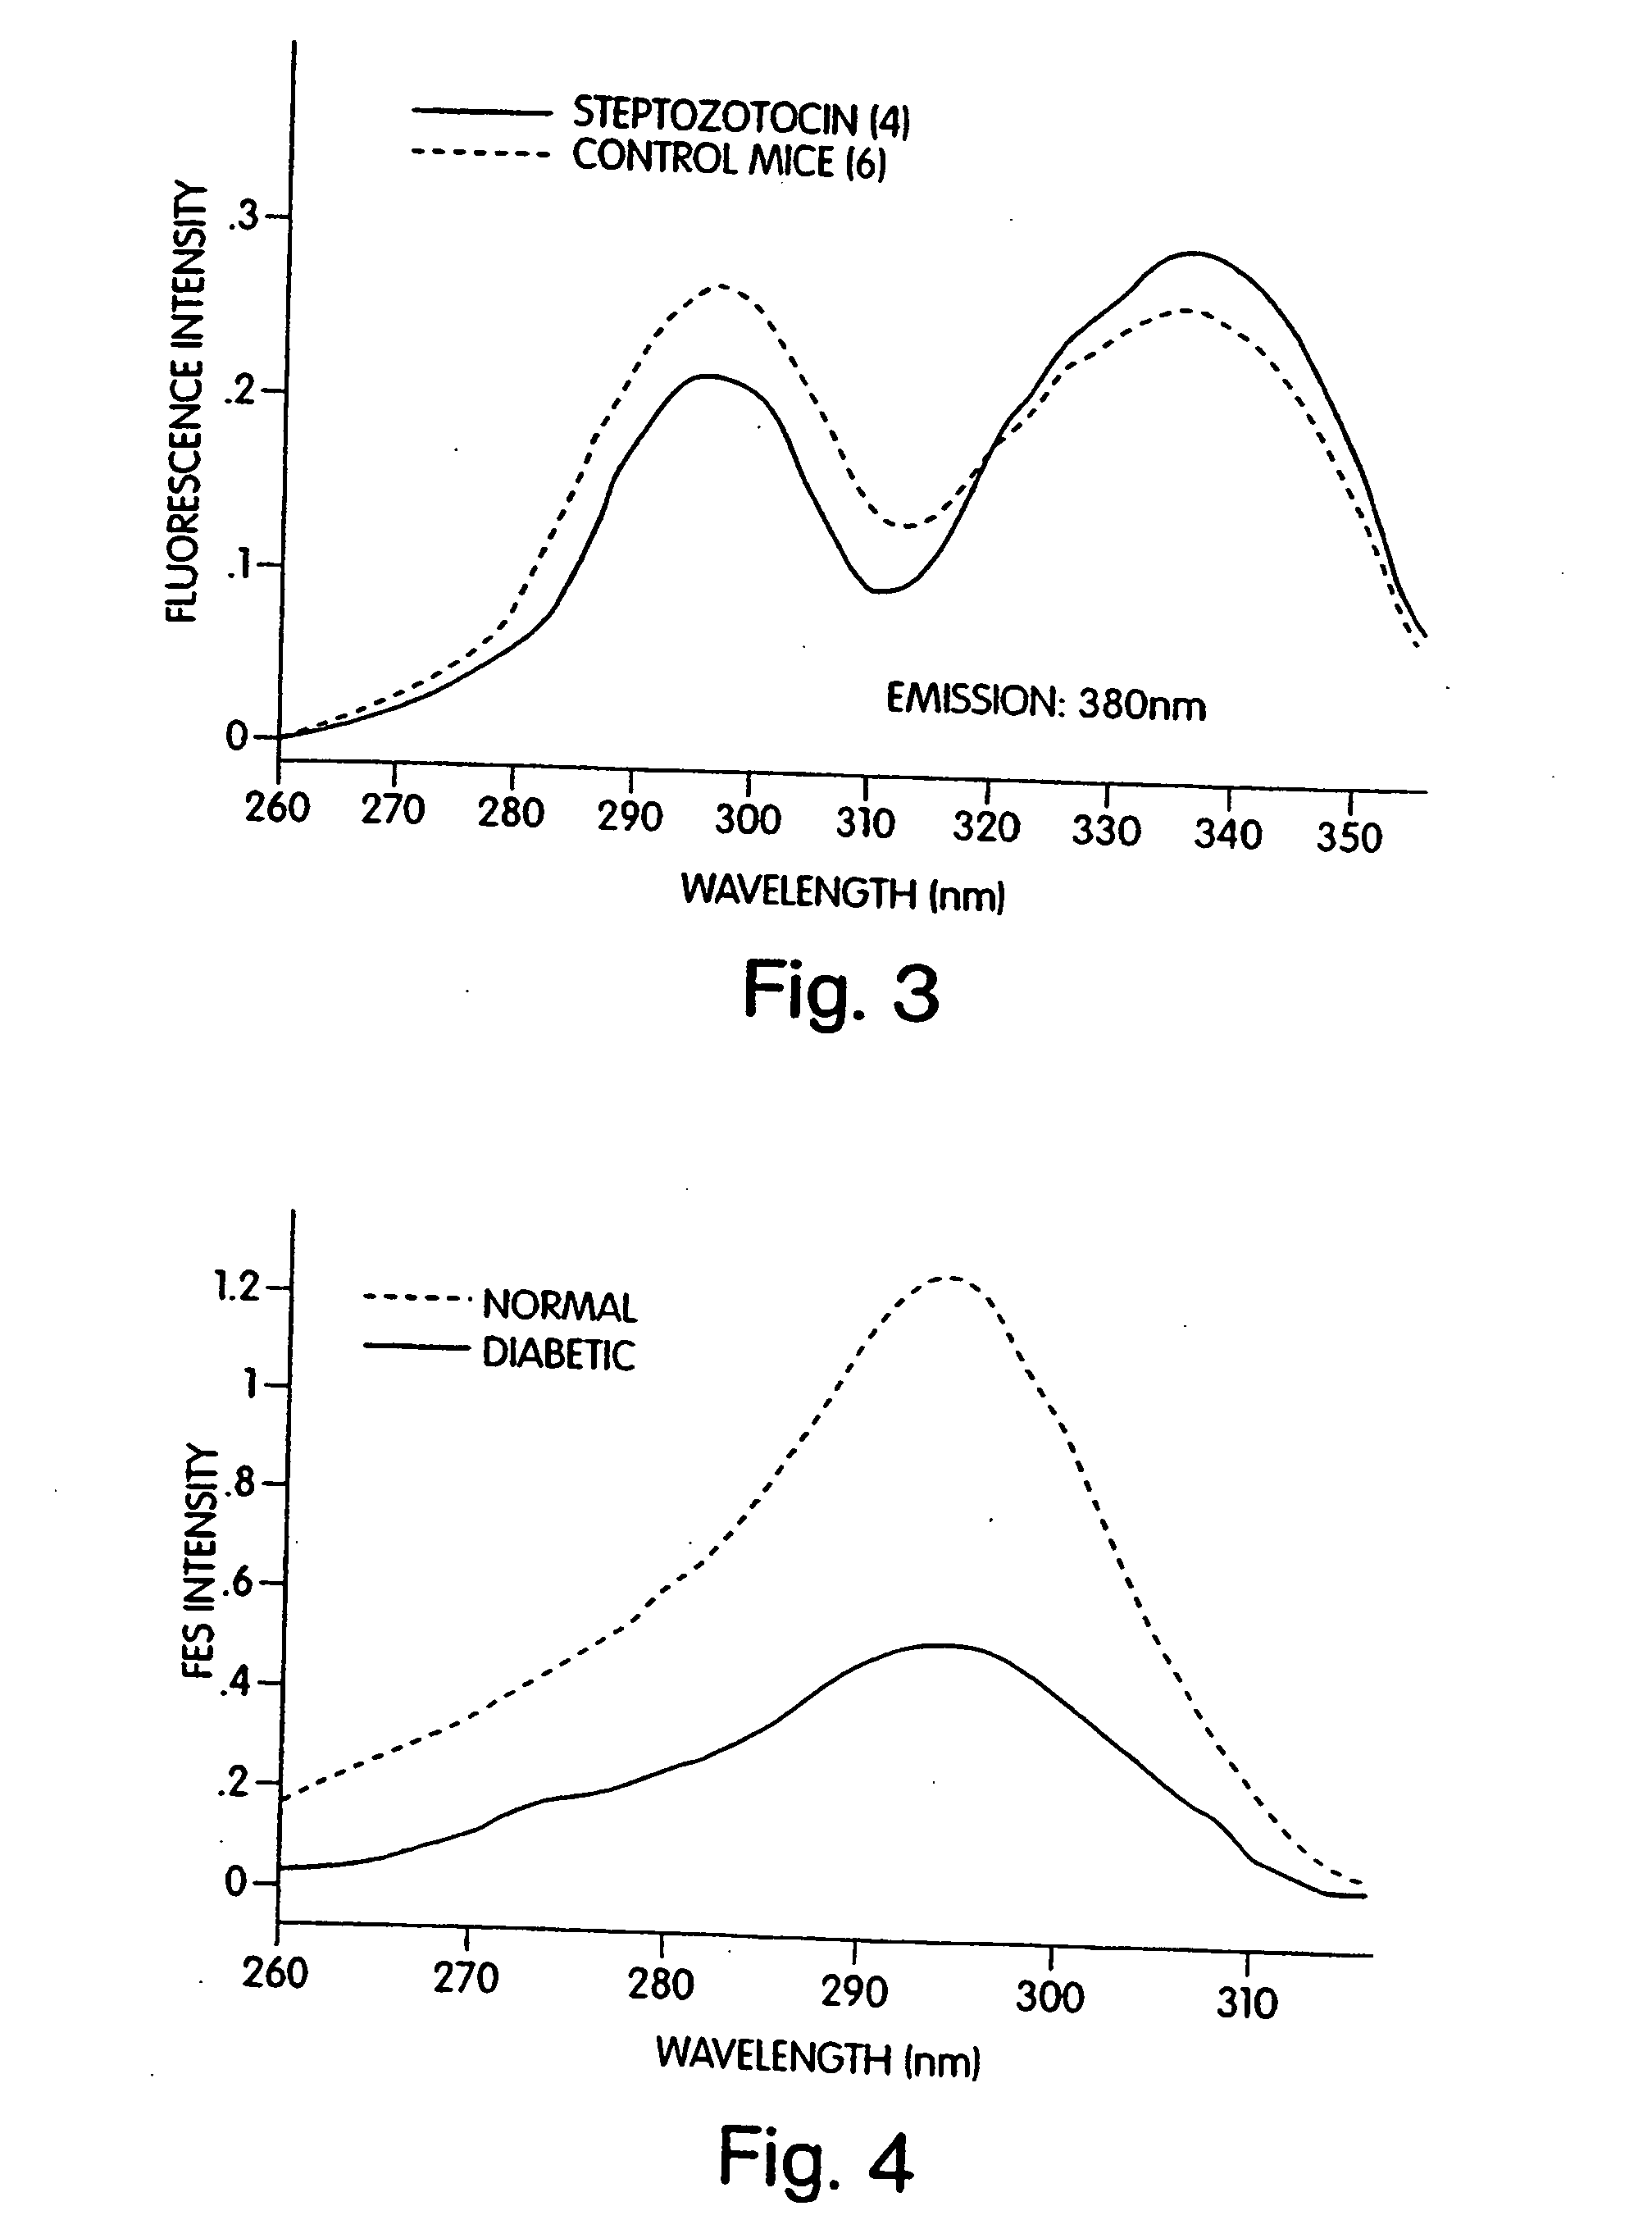
[0133] Experiments were conducted for six hairless (SKH) diabetic mice made diabetic by the injection of streptozotocin, and six hairless (SKH) non-diabetic (normal) mice. Excitation spectra at emission wavelengths of 380 nm and 340 nm were collected for each of the twelve mice. A Xenon arc source coupled to a monochromator were fed into a fiber optic probe, which was then used to illuminate the backs of all of the mice at an intensity level of approximately 0.1-1.0 mW / cM2. A spectrometer was used to collect the resulting spectra, which are shown in FIGS. 3 and 4 for emission at 380 nm and 340 nm, respectively. The plots indicate a significantly lower excitation intensity at 295 nm and a significantly higher excitation intensity at 340 nm for the diabetic mice. Urine collected from the animals confirmed that the glucose levels of the diabetic mice were higher at 340 nm for the diabetic mice.
example 2
Glucose Levels of a Non-Diabetic Rat Following Ketamine and Insulin Treatments
[0134] Referring to FIG. 5, experiments were also conducted using a normal rat. The experimental apparatus used was the same as that used in Example 1. Fluorescence excitation spectra were obtained for the rat in the following situations, (A) at rest (diamonds), (B) after the administration of Ketamine (squares), (C) after the administration of insulin (triangles) and (D) after the administration of additional insulin (crosses). The glucose levels in situations A-D were determined to be 120, 240, 100, and 40 gm / ml, respectively. The results are believed to be superimposed on a light leakage signal that increases steadily with wavelength, although the use of double monochromators should eliminate this source of background noise. Spectra collected for this rat indicate that blood glucose level has a positive effect on fluorescence excitation in the 340 nm range. This is more clearly depicted in FIG. 6 in wh...
example 3
Glucose Levels of Human Subjects Before and After Glucose Ingestion
[0135] Preliminary experiments were also conducted on humans. FIGS. 7, 8 and 9 depict fluorescence excitation spectra for three human subjects, two males and one female, respectively, before (dashes), 30 minutes after (dotted / dashed line), and 60 minutes after (solid line) the ingestion of 100 grams of glucose. In each situation, the emission monochromator was set to a wavelength of 380 nm. Collagen and tryptophan spectra were found to change in ways similar to those for the animal models, although there appear to be individual differences. Dashed lines represent measurements before glucose intake. Dashed and dotted lines represent changes induced after glucose intake. Solid lines represent maximal changes induced by the intake of glucose.
PUM
 Abstract
Description
Claims
Application Information
 - R&D
- Intellectual Property
- Life Sciences
- Materials
- Tech Scout
- Unparalleled Data Quality
- Higher Quality Content
- 60% Fewer Hallucinations
Browse by: Latest US Patents, China's latest patents, Technical Efficacy Thesaurus, Application Domain, Technology Topic, Popular Technical Reports.
© 2025 PatSnap. All rights reserved.Legal|Privacy policy|Modern Slavery Act Transparency Statement|Sitemap|About US| Contact US: help@patsnap.com


