Genetic diagnosis using multiple sequence variant analysis

a gene and multiple sequence technology, applied in the field of nucleic acid-based genetic analysis, can solve the problems of complex structure, shaped, and not simple functions of ld, and achieve the effects of improving the accuracy of results and reducing the difficulty of ld detection

Inactive Publication Date: 2006-11-16
METHEXIS GENOMICS
View PDF2 Cites 32 Cited by
  • Summary
  • Abstract
  • Description
  • Claims
  • Application Information

AI Technical Summary

Benefits of technology

[0104]FIG. 5 exemplifies the effect of a limited number of historical recombination events on the SPC structure. An imaginary genetic variation data set was used; non-clustering polymorphisms were omitted for the sake of simplicity. Different colors are used to indicate the various SPCs. Throughout the Figure, the same numbering is used to indicate the various SPCs. FIG. 5A shows the genetic variation table onto which the SPCs are visualized at a threshold value of C=1. The first two rows in FIG. 5A indicate respectively the SNPs and the SPCs to which the SNPs belong. The original table was sorted such that individuals that share the same SPC are grouped. Certain samples reveal recombination events between SPC-0 and SPC-1. As a result, adjacent sets of SNPs do not cluster perfectly (C=1)and form dependent SPC-1x and SPC-1y. FIG. 5B shows the matrix of the pairwise C-values calculated from the data set of FIG. 5A. All positions for which C=1 are differentially highlighted and all positions for which C=0 are left blank. FIG. 5C shows an SPC map of the locus in question. While SPC-1 is interrupted on both sides, the other SPCs are continuous. FIG. 5D is a network representation of the SPCs detected at C=1. FIGS. 5E and 5F show the various SPCs found at a threshold level of C≧0.9 and the corresponding network. FIGS. 5G and 5H show the various SPCs at threshold level C≧0.8 and the corresponding network.
[0105]FIG. 6 exemplifies the effect of a recombination hotspot on the SPC structure. An imaginary genetic variation data set was used. Different colors are used to indicate the various SPCs. The recombination hotspot demarcates two adjacent regions. A black bar indicates the junction and in the two regions the major alleles (i.e. SPC-0) are differentially highlighted . FIG. 6A shows the original genetic variation table onto which the SPCs are depicted. The first two rows in FIG. 6A indicate respectively the SNPs and the SPCs to which the SNPs belong. The genetic variation table is arranged such that individuals that share the same SPCs in the left region are grouped. Polymorphic sites that do not cluster are marked in grey (e.g. SNPs 33, 37 and 38). Note that all SPCs are in an independent relationship and that the SPCs that belong to the distinct regions occur in various combinations, as indicated in the left margin. FIG. 6B shows the matrix of the pairwise C-values calculated from the data set of FIG. 6A. All positions for which C=1 are differentially highlighted and all positions for which C=0 are left blank. Note that in this case the matrix can be spit into two sub-matrices as indicated by the frames. Within each sub-matrix it can be seen that all SNPs belonging to the same SPC have pairwise values of C=1, while all SNPs belonging to the different SPCs have pairwise values of C=0. Note that the pairwise C-values between the SNPs of region 1 and region 2 are all <0.5 indicating that there is no clustering between the SPCs of the two regions. FIG. 6C shows an SPC map of the locus in question. The SPCs found in the two distinct regions are shown separately (since they can occur in various combinations). FIG. 6D shows that each region is characterized by a distinct SPC network.

Problems solved by technology

Unfortunately, LD is not a simple function of distance and the patterns of genetic polymorphisms, shaped by the various genomic processes and demographic events, appear complex.
Thus, an important analytical challenge is to identify the minimal set of SNPs with maximum total relevant information and to balance any reduction in the variation that is examined against the potential reduction in utility / efficiency of the genome-wide survey.
Any SNP selection algorithm that is ultimately used should also account for the cost and difficulty of designing an assay for a given SNP on a given platform—a particular SNP may be the most informative in a region but it may also be difficult to measure.
The determination of haplotypes from diploid unrelated individuals, heterozygous at multiple loci, is difficult.
Conventional genotyping techniques do not permit determination of the phase of several different markers.
These probabilistic methods all have limitations in accuracy (dependent on the number of SNPs being handled and the size of the population being examined) and scalability.
It should be noted, however, that for example the haplotype block concept remains to be validated, that not all regions of the human genome may fit the concept and / or that the concept may have limited value in other species.

Method used


Image

  • Genetic diagnosis using multiple sequence variant analysis
  • Genetic diagnosis using multiple sequence variant analysis
  • Genetic diagnosis using multiple sequence variant analysis

Examples


example 1

Intraspecies SPC Map of the sh2 Locus of Maize

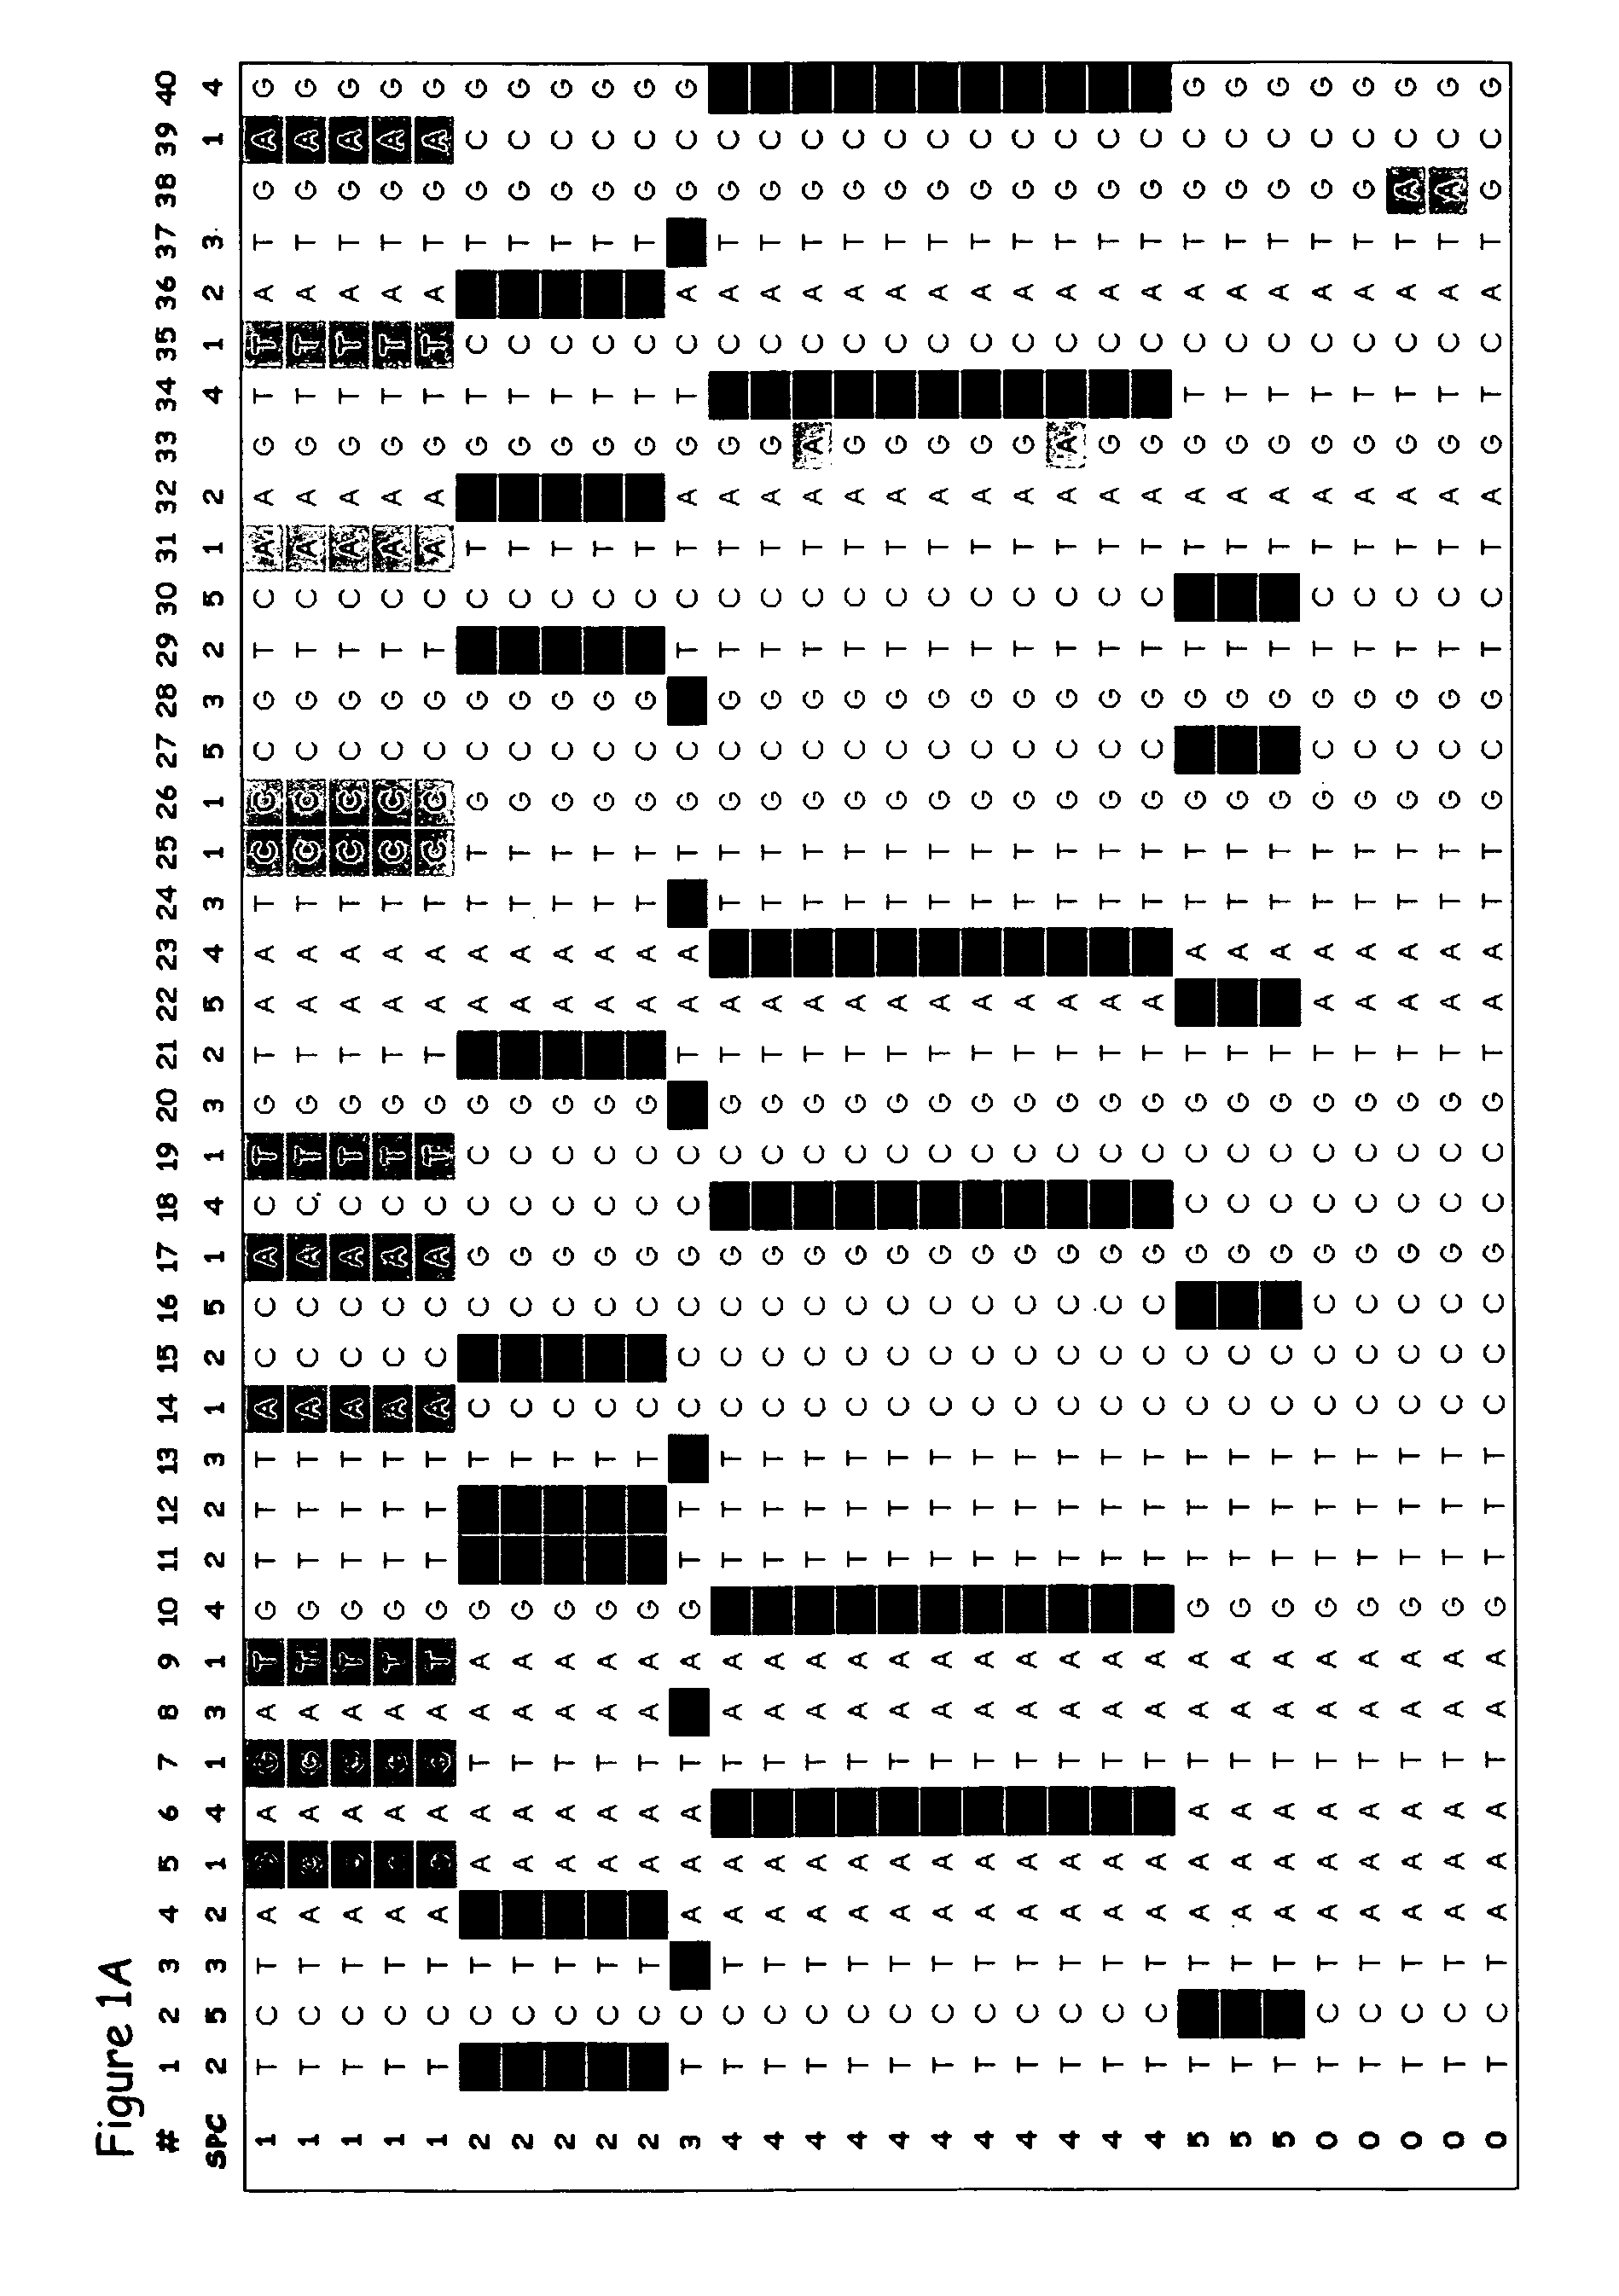
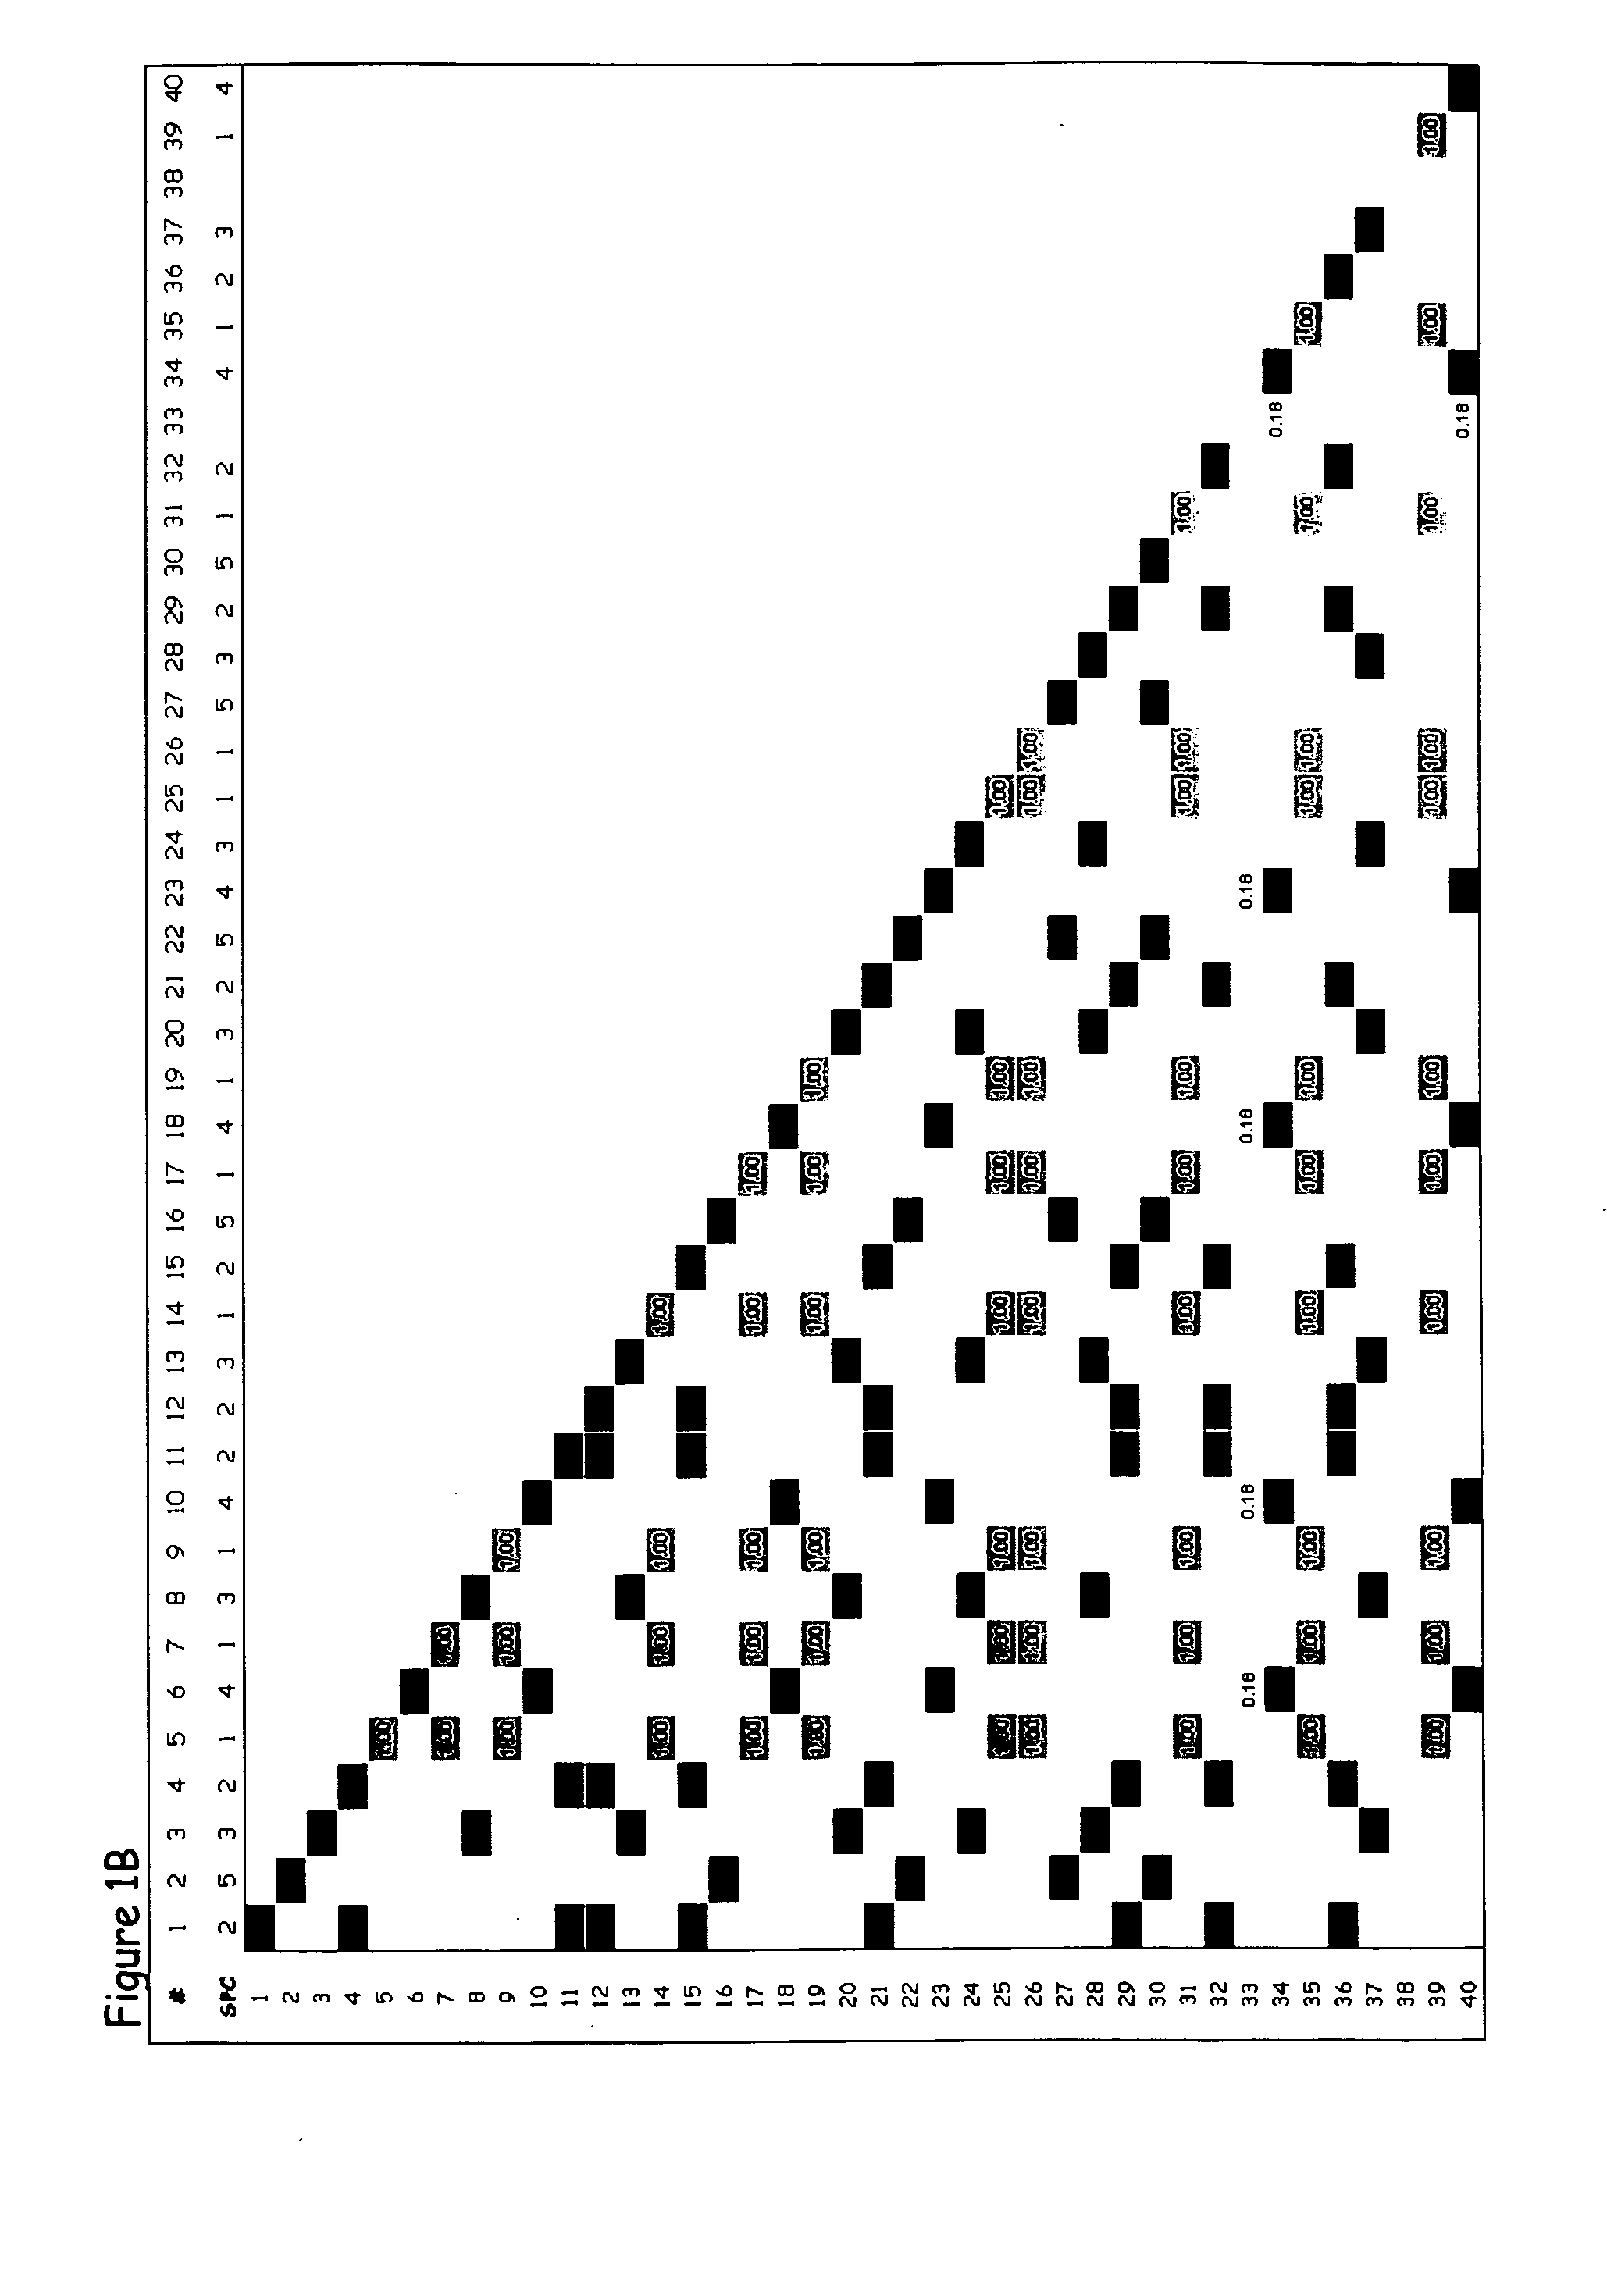
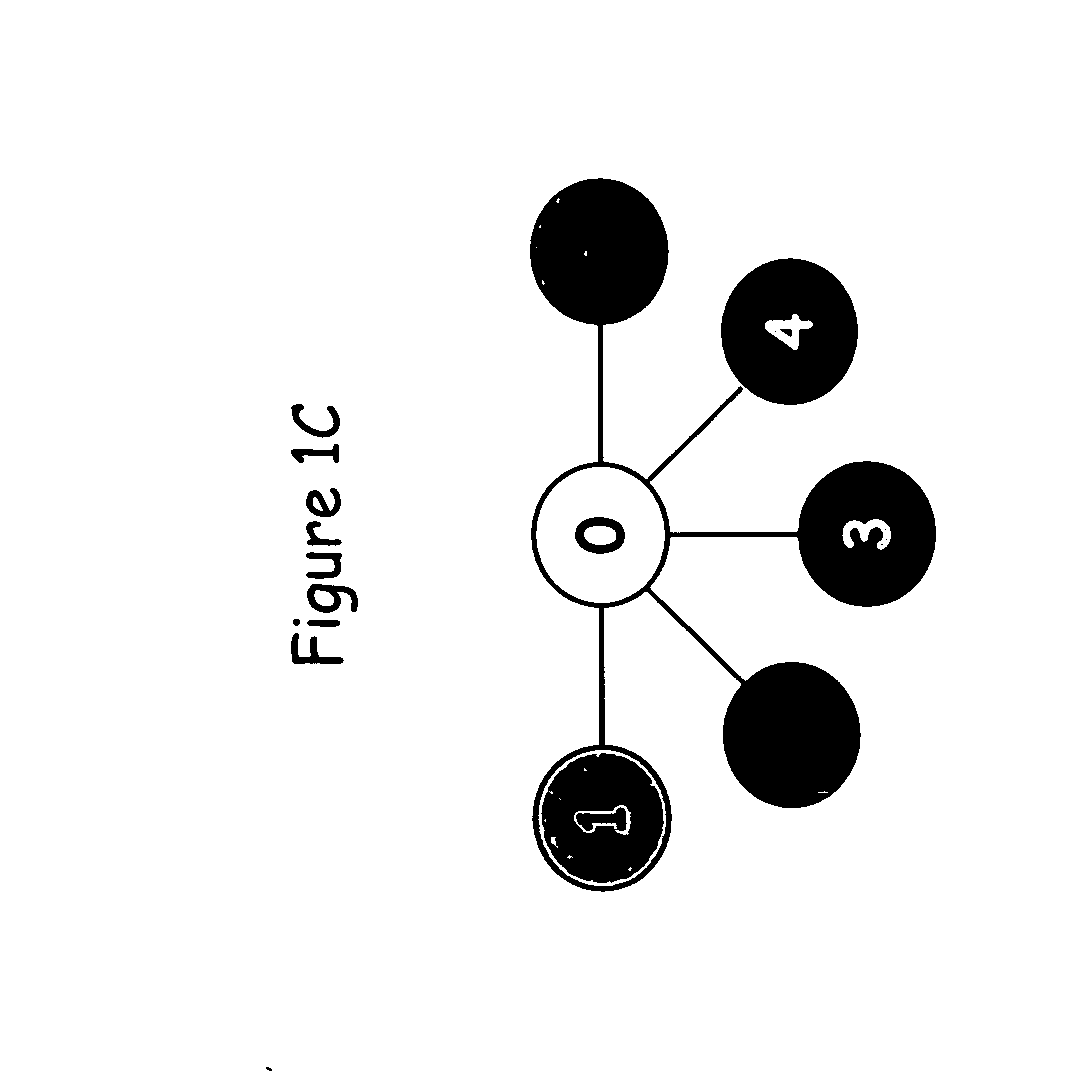
[0320] The present example provides proof of concept that the methods of the present invention can be used to generate an SPC map of a complete gene locus that has been sequenced in a number of individuals of a particular species. Many studies on the genetic diversity of specific genes have been conducted in a broad range of plant and animal species; and these sequences are publicly available from GenBank (http: / / www.ncbi.nlm.nih.gov). In most of these studies relatively short gene segments, less than 1000 bp, have been sequenced and only in a few studies have complete genes been sequenced. From the available complete or near complete gene sequences available in GenBank, the shrunken2 (sh2) locus from maize was chosen to exemplify the different aspects of the invention. The published shrunken2 locus sequences from 32 maize cultivars (Zea mays subsp. mays) comprise a region of 7050 bp containing the promoter and the coding region of the ...

example 2

Intraspecies SPC Map of the sh1 Locus of Maize

[0328] The present example provides proof of concept that the methods of the present invention can be used to generate an SPC map of a complete gene in which extensive recombination has occurred. This example presents an analysis of the polymorphic sites in the shrunken1 (sh1) locus from maize to exemplify further aspects of the invention. The published shrunkenl locus sequences from 32 maize cultivars (Zea mays subsp. mays) comprise a region of 6590 bp containing the promoter and the coding region of the sh2 gene [Whitt et al., Proc. Natl. Acad. Sci. USA 99: 12959-12962, 2002].

[0329] The sequences for this analysis were retrieved from GenBank (http: / / www.ncbi.nlm.nih.gov) accession numbers AF5441 00-AF544131. The sequences were aligned to generate a genetic variation table as described in detail in Example 1. The genetic variation table of the sh1 gene comprises 418 polymorphic sites. Because of this very large number of polymorphic s...

example 3

Intraspecies SPC Map of the Y1 Locus of Maize

[0332] The present example provides proof of concept that the method of the present invention can be used to generate an SPC map of a locus in which several historical recombination events have occurred. This example presents an analysis of the polymorphisms in the Y1 phytoene synthase locus of maize to exemplify further aspects of the invention. The Y1 phytoene synthase gene, which is involved in endosperm color, was sequenced in 75 maize inbred lines [Palaisa et al., The Plant cell 15: 1795-1806, 2003], comprising 41 orange / yellow endosperm lines and 32 white endosperm lines.

[0333] The sequences for this analysis were retrieved from GenBank (http: / / www.ncbi.nlm.nih.gov) accession numbers AY296260-AY296483 and AY300233-AY300529. The sequences comprise 7 different segments from a region of 6000 bp containing the promoter and the coding region of the Y1 phytoene synthase gene. The individual sequences were aligned to generate 7 genetic v...


PUM

PropertyMeasurementUnit
nucleic acid sequenceaaaaaaaaaa
nucleic acidaaaaaaaaaa
distanceaaaaaaaaaa

Abstract

The present invention is in the field of nucleic acid-based genetic analysis. More particularly, it discloses novel insights into the overall structure of genetic variation in all living species. The structure can be revealed with the use of any data set of genetic variants from a particular locus. The invention is useful to define the subset of variations that are most suited as genetic markers to search for correlations with certain phenotypic traits. Additionally, the insights are useful for the development of algorithms and computer programs that convert genotype data into the constituent haplotypes that are laborious and costly to derive in an experimental way. The invention is useful in areas such as (i) genome-wide association studies, (ii) clinical in vitro diagnosis, (iii) plant and animal breeding, (iv) the identification of micro-organisms.

Description

[0001] The present application claims the benefit of priority of, and a continuation-in-part application of U.S. application Ser. No. 11 / 077,564, which was filed on Mar. 9, 2005, which in turn was a continuation-in-part of both U.S. application Ser. No. 10 / 788,260 filed on Feb. 26, 2004, and U.S. application Ser. No. 10 / 788,043 also filed on Feb. 26, 2004, both of which claimed priority to EPO Application No. 03447042.7, which was filed Feb. 27, 2003. Each of the aforementioned applications is incorporated herein by reference in its entirety.FIELD OF INVENTION [0002] The present invention is in the field of nucleic acid-based genetic analysis. More particularly, it discloses novel insights into the overall structure of genetic variation in all living species. BACKGROUND OF THE INVENTION [0003] Variation in the human genome sequence is an important determinative factor in the etiology of many common medical conditions. Heterozygosity in the human population is attributable to common ...

Claims


Application Information

Patent Timeline
Patent Type & Authority Applications(United States)
IPC IPC(8): C12Q1/68G06F19/00G16B10/00G16B20/20G16B20/40G16B30/10
CPCG06F19/14G06F19/22G06F19/18G16B10/00G16B20/00G16B30/00G16B30/10G16B20/20G16B20/40
Inventor ZABEAU, MARCSTANSSENS, PATRICKGANSEMANS, YANNICK
Owner METHEXIS GENOMICS
Why Eureka
Try Eureka