Image based correction for unwanted light signals in a specific region of interest

Inactive Publication Date: 2007-05-24
ABBOTT LABARIES
23 Cites 2 Cited by

AI-Extracted Technical Summary

Problems solved by technology

All of these sources of variation can contribute to a dynamically changin...

Method used

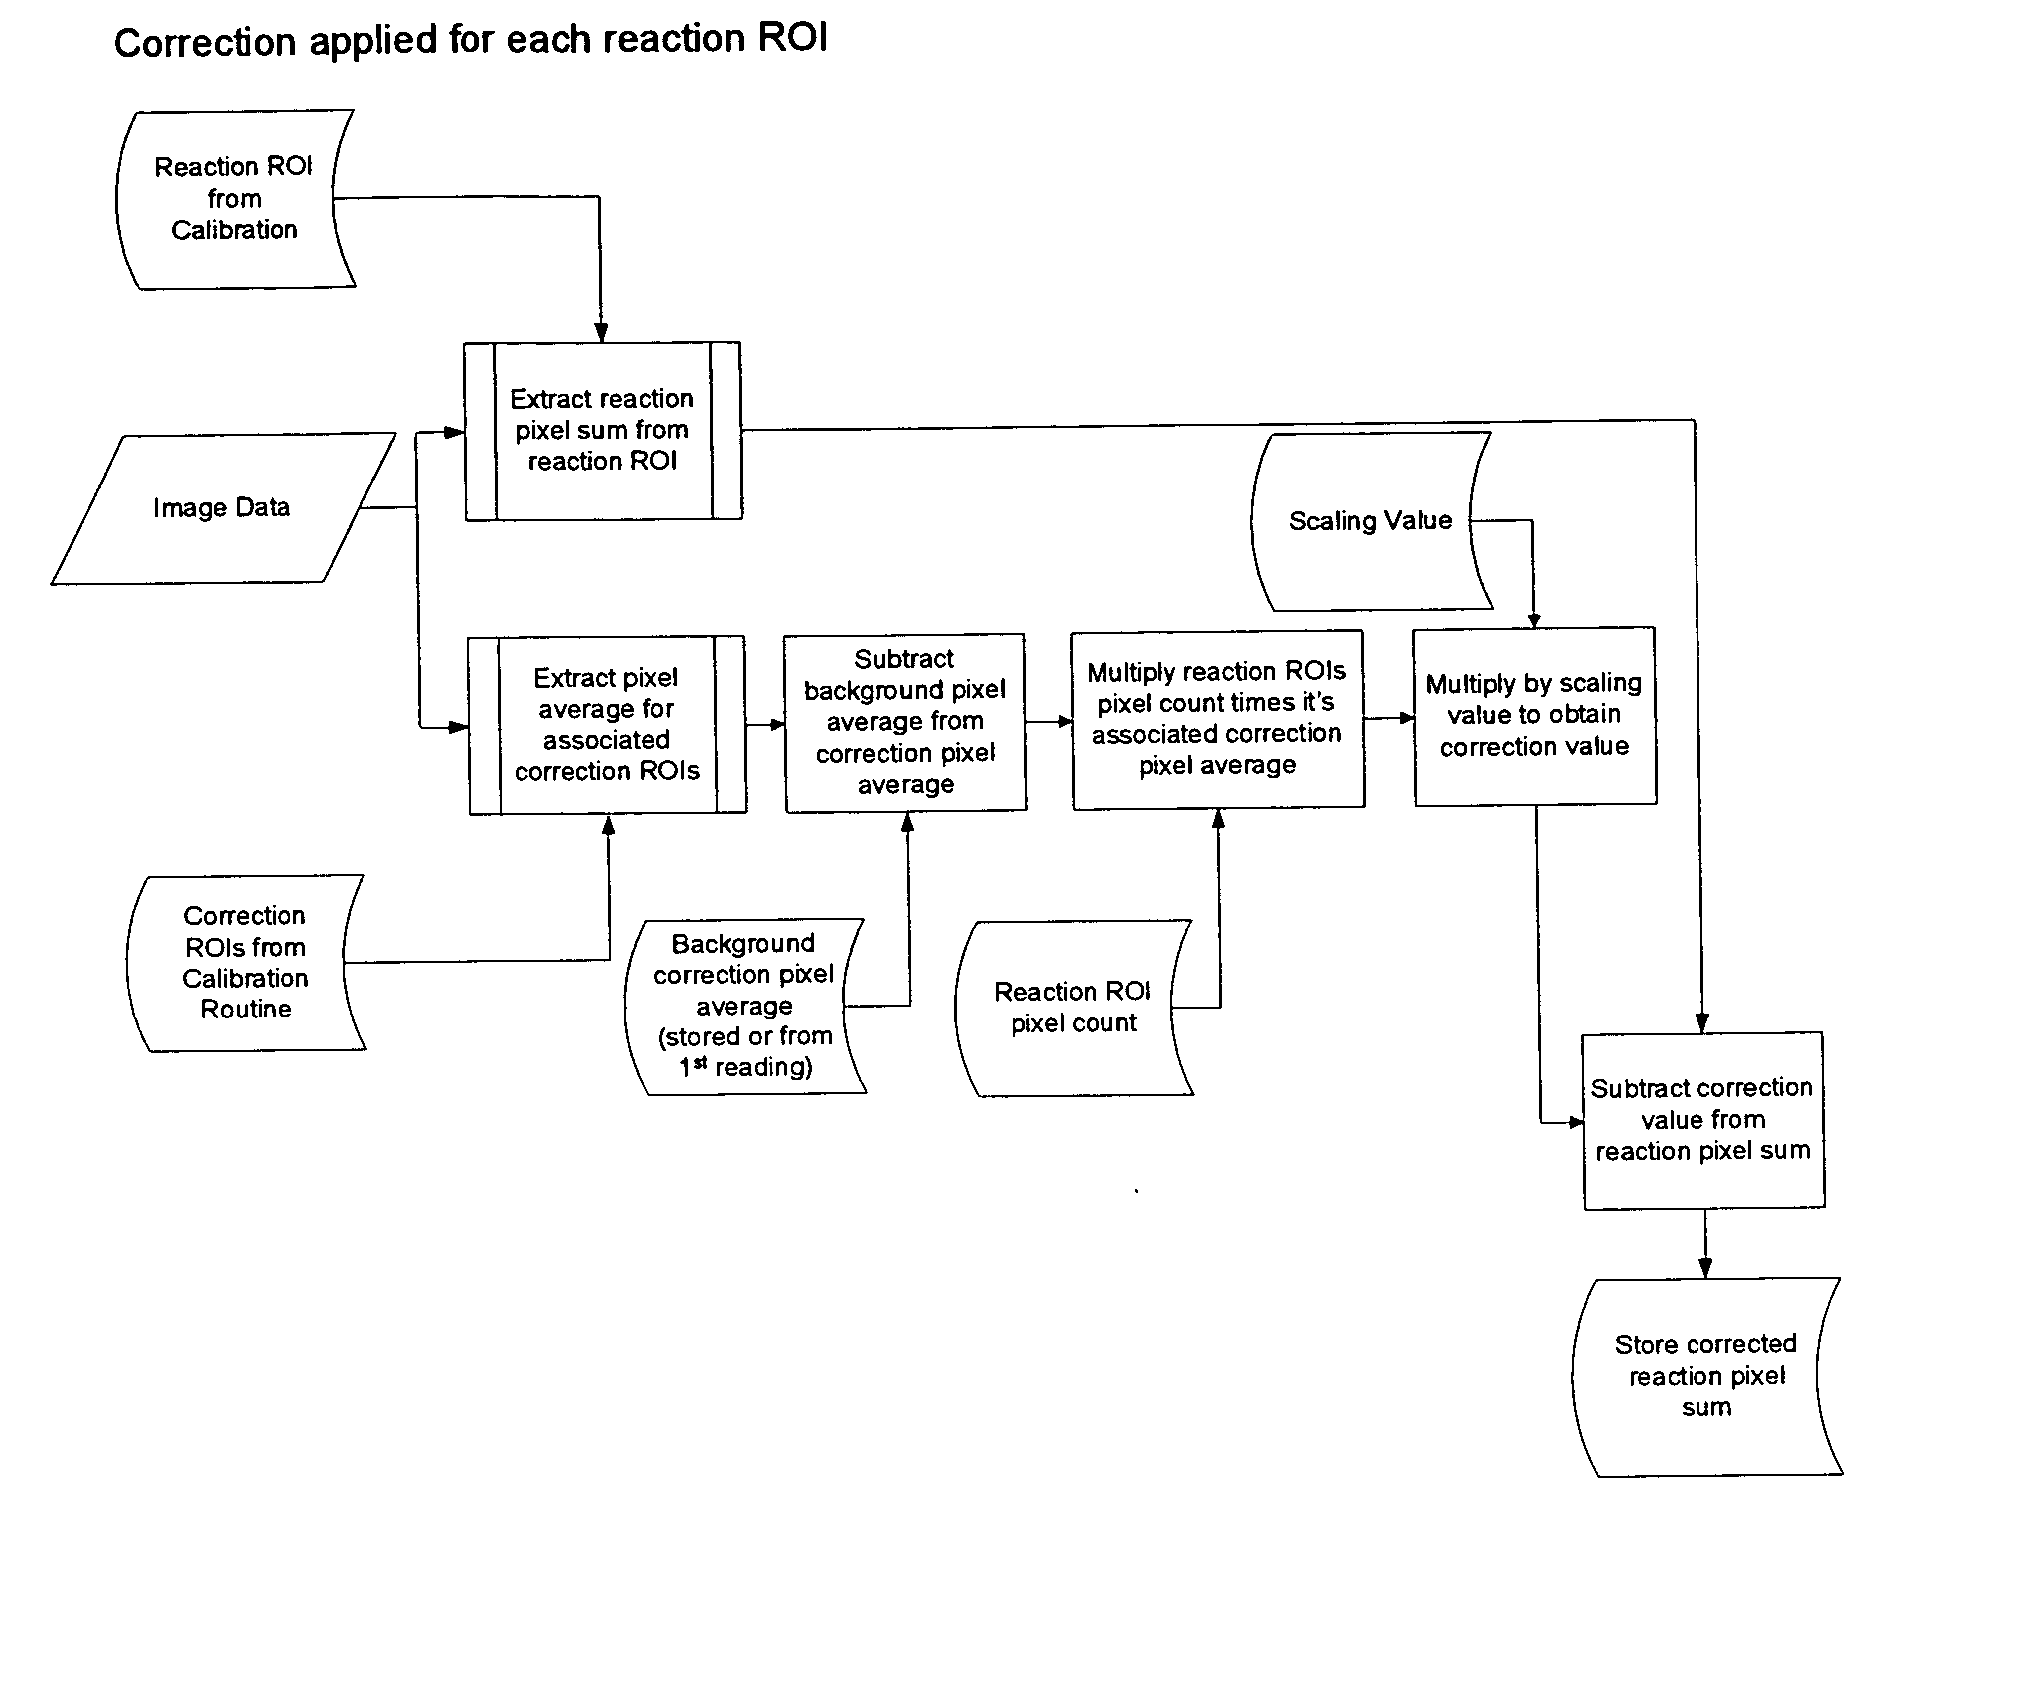
[0040] After the region of correction calibration is performed, the correction based upon from the region of correction can be applied by using the following method. Once the region of correction calibration is performed, a background offset value needs to be generated. This value can be generated in at least two ways. According to a first alternative, a background calibration can be performed. In this method, an image is taken of a plate without any fluorescent dye. During the background calibration, the average pixel value for each region of correction is calculated by dividing the pixel sum by the pixel count in that region of correction to obtain an average pixel value. This average pixel value is indicative of the background light level and is referred to as the background offset value. The background offset values are stored for use in future runs, e.g., PCR runs. Alternatively, the background offset value can be determined on a run-by-run basis by calculating the average pixel value for each region of correction for the first reading of a run, e.g., a PCR run. Because the first (or first few) readings of a PCR run occur before a significant reaction signal is produced, this alternative method provides a good representation of the background.
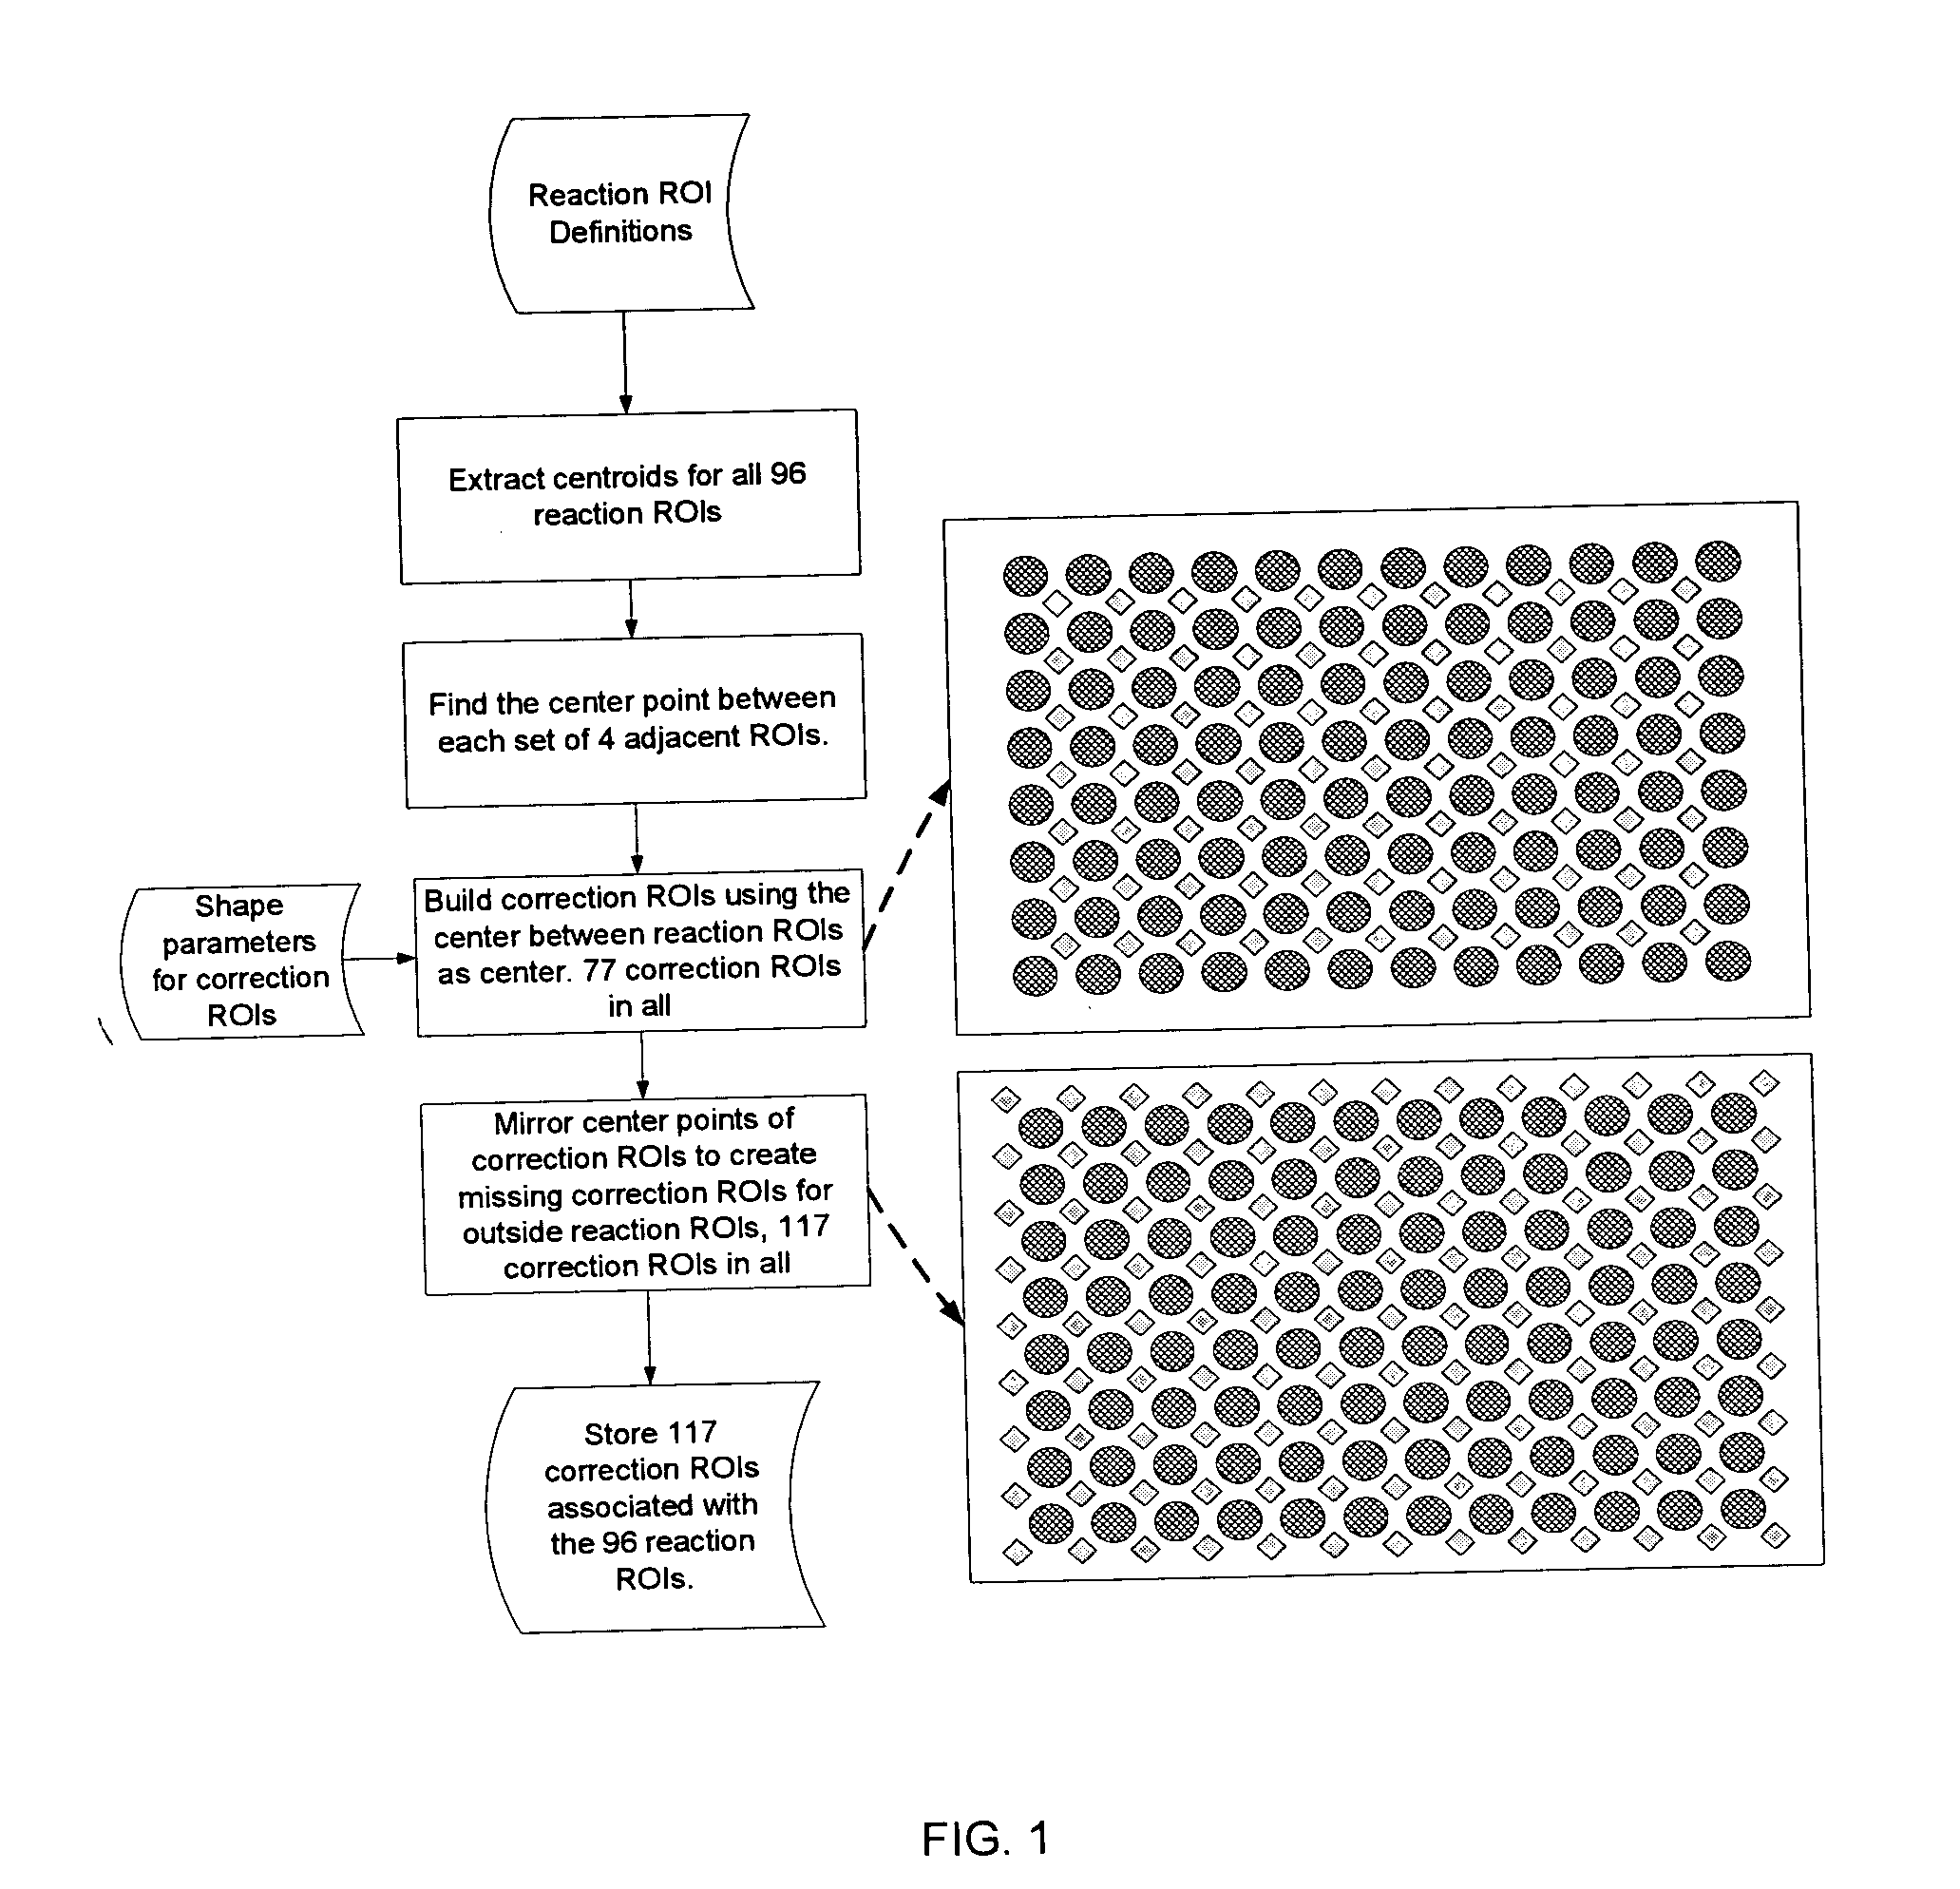
[0041] The signal correction is performed in the following manner. Performance of signal correction is depicted in FIGS. 1 and 3. For each reaction, the reaction pixel sum and the reaction pixel count are calculated by using the reaction region of interest. The average pixel value for the four regions of correction associated with a given reaction region of interest is calculated. Although four regions of corr...

Benefits of technology

[0019] The method of this invention can be used to measure a dynamically changing signal and the effect of the dynamically changing signal on a region of interest of a specific reaction. Correcting for the cross-talk inherent in a dynamically changing signal will greatly increase the sensitivity of the method of detection used in an assay emp...

Abstract

A method for correcting the signal in an image having a plurality of regions of interest, the method comprising the steps of: (a) providing an image having a plurality of regions of interest, these regions of interest having areas between them; (b) determining a region of correction between at least two regions of interest; (c) calculating a correction signal from the region of correction; and (d) using the correction signal to correct a measured signal from one or more regions of interest. This invention also provides a method for defining a region of correction for use in a method for correcting the signal in an image having a plurality of regions of interest, the defining method comprising the steps of: (a) providing an image having a plurality of regions of interest; (b) extracting geometric information for a plurality of regions of interest; (c) selecting a location between at least two regions of interest; (d) selecting at least one parameter to describe regions of correction; and (e) constructing regions of correction between the at least two regions of interest.

Application Domain

Image enhancementImage analysis +3

Technology Topic

Region of interestImage based +2

Image

  • Image based correction for unwanted light signals in a specific region of interest
  • Image based correction for unwanted light signals in a specific region of interest
  • Image based correction for unwanted light signals in a specific region of interest

Examples

  • Experimental program(1)

Example

EXAMPLE
[0044] A real time PCR run for HIV was performed on an ABI Prism 7500 instrument (Applied Biosystems, Foster City, Calif.). This instrument utilizes a 96-well plate format with wells arranged in a 12×8 array. The run was configured so that there were 84 wells containing positive samples with a concentration of 1×10⁶ copies/mL and 12 wells not containing positive samples, i.e., negative wells. The negative wells were distributed on the plate to maximize the potential cross-talk from the wells containing positive samples. FIG. 4 illustrates the layout of the plate.
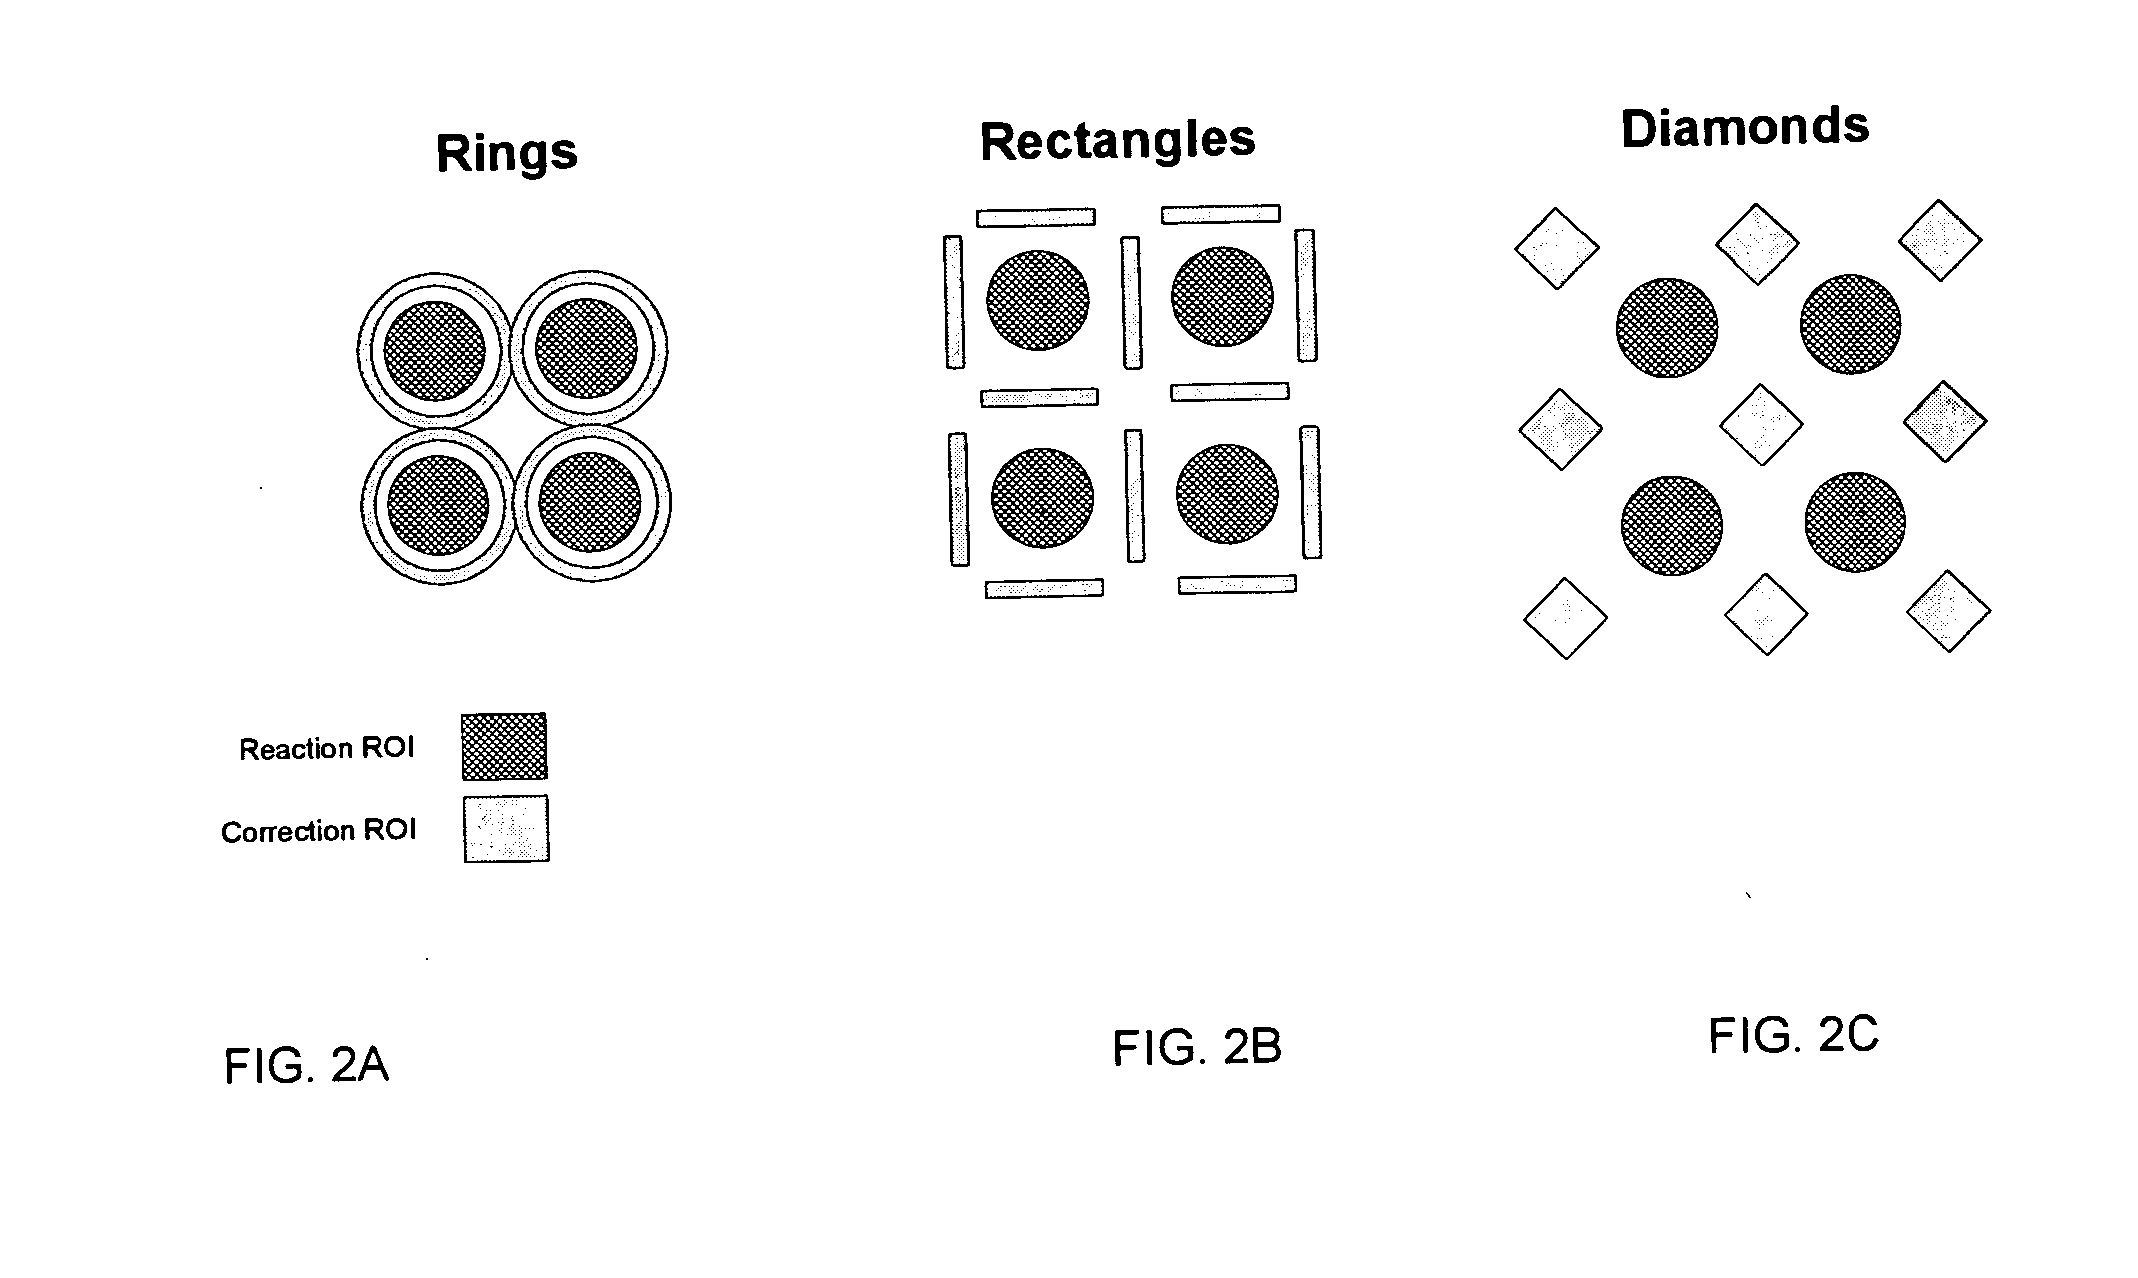
[0045] The ABI Prism 7500 instrument uses a CCD camera and measures fluorescence in five wavelength bands. FIG. 5 shows one image from the end of the PCR run. FIG. 6 shows the same image with the reaction regions of interest and the regions of correction superimposed. In this example, a diagonal array of diamond-shaped regions of correction, each of which contained of 25 pixels, were used. The first reading in the PCR run was used to establish the background offset values for each subsequent reading. The scaling factor used was 1.15.
[0046]FIG. 7 shows the raw fluorescence signals for all 96 samples without any image-based correction applied. As can be seen, the 84 positive samples generated signals significantly above the background fluorescence by cycle 15 and approached their maximum fluorescence by cycle 25. FIG. 8 shows the same responses with the Y-axis scaled to focus on the responses in wells not containing positive samples. All of the negative responses showed a small but significant rise from cycles 15 through 25, which is caused by cross-talk from the responses of the positive samples. FIG. 9 shows the effect of the image-based correction on the negative responses. As can be seen, the cross-talk signal has been effectively eliminated. FIG. 10 shows the response for well F-11 with and without the image-based correction applied.
[0047] The method is also applicable to images that contain a fewer or a greater number of regions of interest.
[0048] Various modifications and alterations of this invention will become apparent to those skilled in the art without departing from the scope and spirit of this invention, and it should be understood that this invention is not to be unduly limited to the illustrative embodiments set forth herein.

PUM

no PUM

Description & Claims & Application Information

We can also present the details of the Description, Claims and Application information to help users get a comprehensive understanding of the technical details of the patent, such as background art, summary of invention, brief description of drawings, description of embodiments, and other original content. On the other hand, users can also determine the specific scope of protection of the technology through the list of claims; as well as understand the changes in the life cycle of the technology with the presentation of the patent timeline. Login to view more.

Similar technology patents

Bottom seismic system

InactiveUS20140185408A1increase sensitivityminimal impact
Owner:KYASPER VLADIMIR EDUARDOVICH +3

Collateral gene inactivation biomarkers and targets for cancer therapy

ActiveUS20140378529A1reduction in tumor size and burdenincrease sensitivity
Owner:BOARD OF REGENTS +1

Method of treating osteoarthritis

InactiveUS20200170939A1increase sensitivity
Owner:ORTHOTROPHIX INC

Classification and recommendation of technical efficacy words

  • increase sensitivity
  • not affect

Ocular analyte sensor

InactiveUS6681127B2increase rangeincrease sensitivity
Owner:EYESENSE AG

Neutron detector

InactiveUS6924487B2increase sensitivityefficiently measure
Owner:CONSTELLATION TECH

Biochemical ultrasensitive charge sensing

InactiveUS20050218464A1increase signal outputincrease sensitivity
Owner:UNIV OF HAWAII
Why Eureka
Try Eureka