Quantitative dual-dye photometric method for determining dilution impact

a photometric method and dual-dye technology, applied in the field of quantitative dual-dye photometric methods for determining the impact of diluting a solution, can solve the problems of affecting the calculation of results, the limitations of the mvs® system and the method of publication, and the types of solvents that may be used to create test solutions from mvs® stock solutions, etc., to achieve accurate calculation of analyte concentration, accurate determination of each dilution

Active Publication Date: 2008-03-20
ARTEL
View PDF41 Cites 52 Cited by
  • Summary
  • Abstract
  • Description
  • Claims
  • Application Information

AI Technical Summary

Benefits of technology

[0016] The second method of the present invention also involves a dual-dye photometric process providing results indicating plate washing efficiency. In this method, a solution contains a known concentration of a first chromophore (sometimes referred to herein as a dye) at a very high concentration that absorbs light at a first wavelength, but does not require another chromophore, and a diluent contains a known concentration of a second chromophore that absorbs light at a second wavelength. The method involves dispensing the diluent into a vessel such that the volume of the diluent is larger than would be left behind by a plate washer. The plate washer is then used to aspirate and remove the volume of diluent to the point that the diluent height equals an aspirate tip height of the washer. The absorbance of the diluent is then measured and used to determine a pathlength of light corresponding to the diluent height in the vessel. That information is then used to determine the dilutive effect of a plate washing i

Problems solved by technology

However, there are limitations to the MVS® system and to the method of Publication No. 2007/0141709.
For example, there are limitations to the types of solvents that may be used to create test solutions from MVS® stock solutions while still maintaining accurate calculations following the mathematical approaches described in U.S. Pat. Nos. 6,741,365 and 7,187,455.
Namely, any solvent that significantly alters the solution meniscus in the microtiter well can have a detrimental effect on the results calculated by said approaches.
When an uncharacterized solvent included in a new test solution from MVS® stock solutions (as described in Publication No. 20

Method used


Image

  • Quantitative dual-dye photometric method for determining dilution impact
  • Quantitative dual-dye photometric method for determining dilution impact
  • Quantitative dual-dye photometric method for determining dilution impact

Examples


example one

[0089] The process of Example One was carried out for the purpose of determining the dispense accuracy of a liquid handling device, which specifically was a Rainin, 20-200 μL LTS multichannel pipette.

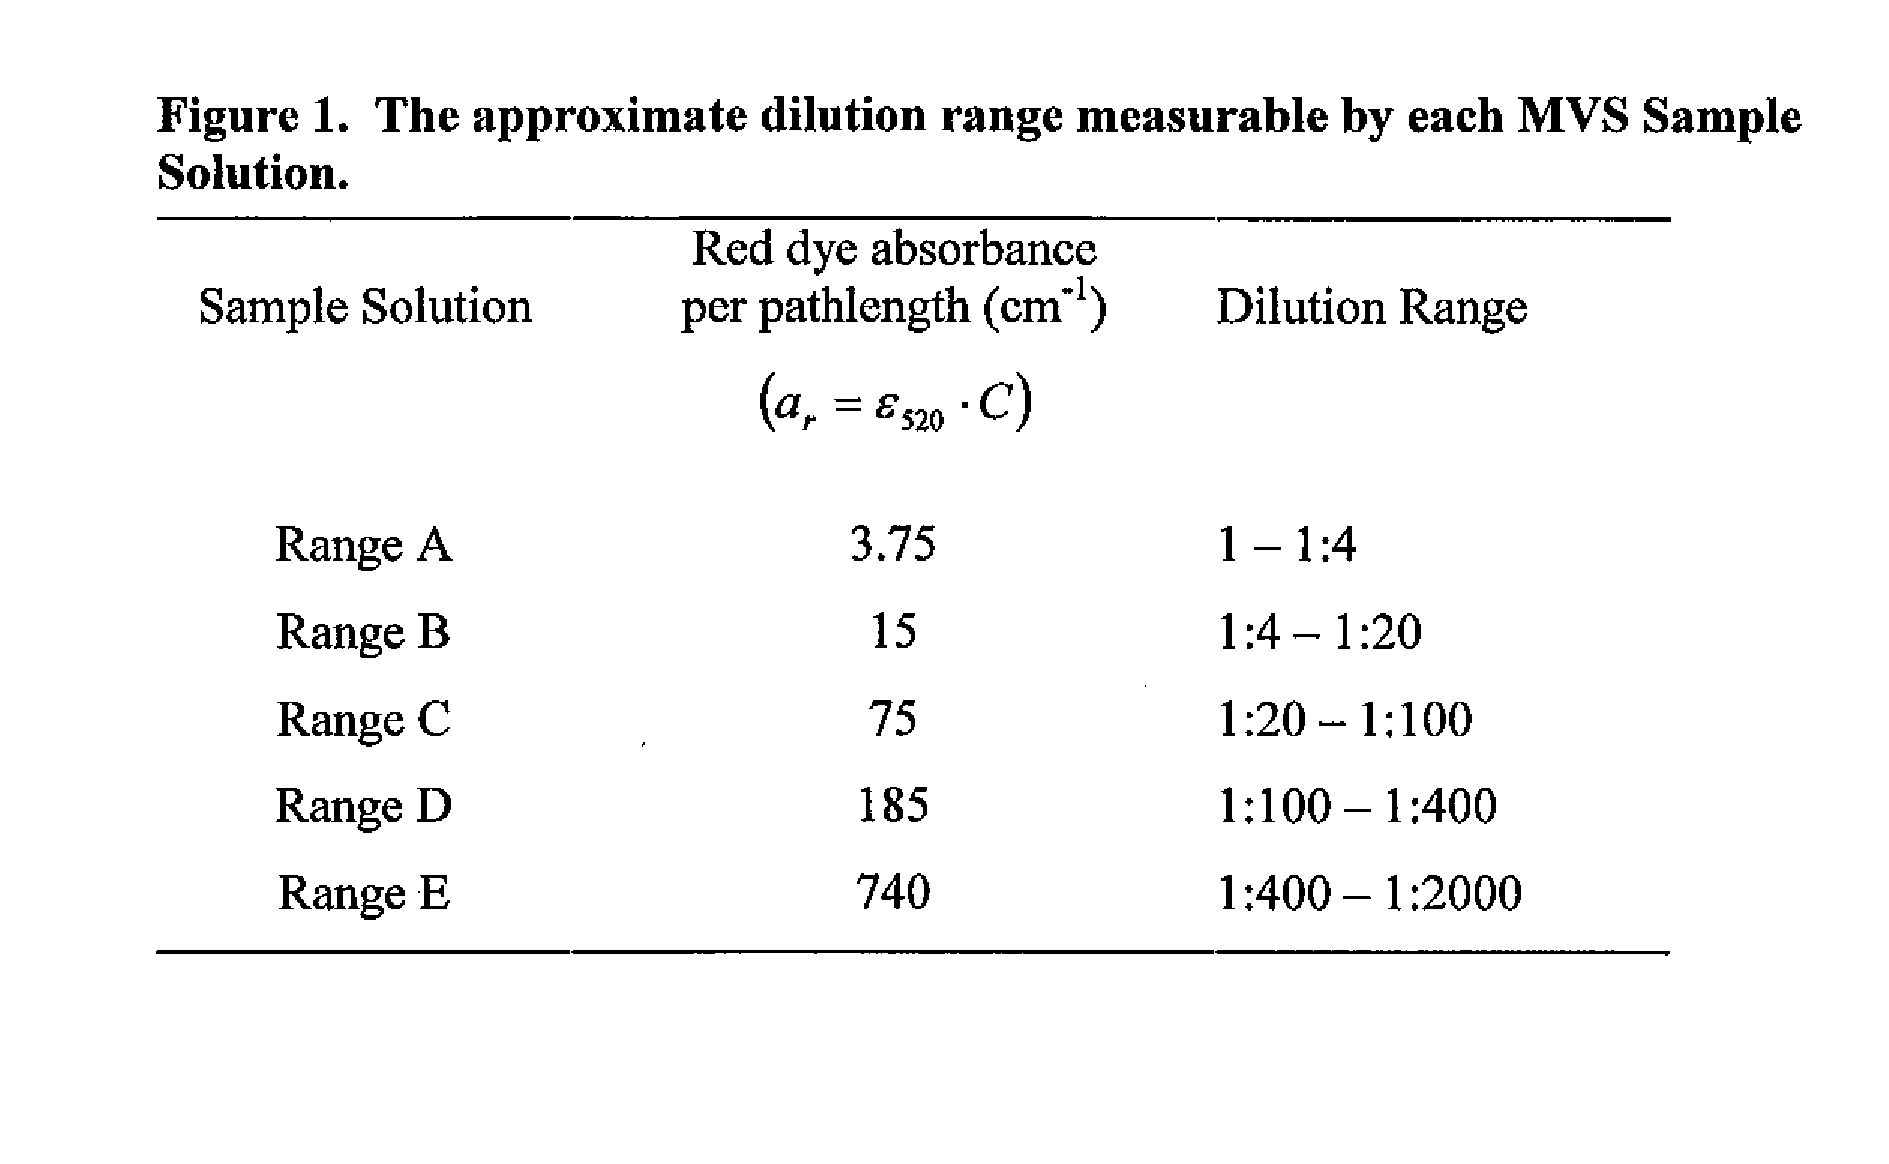
[0090] The process of Example One included the use of a plurality of MVS® Diluent and Sample Solutions (i.e., “Range A”, “Range B”, “Range C”, “Range D” and “Range E” sample Solutions), which arc commercially available from Artel, Inc. of Westbrook, Me. The MVS® Sample Solutions included a common, fixed blue dye (chromophore) concentration and a variable red dye (chromophore) concentration. MVS® Diluent contained the same blue dye concentration as in the MVS® Sample Solutions. The concentrations of red and blue dyes in each of the Sample Solutions and the Diluent are known and well controlled through a rigorous quality control process.

[0091] The MVS® Diluent and Sample Solutions are characterized by the absorbance per pathlength values for their red and blue dyes, as defined in Equati...

example two

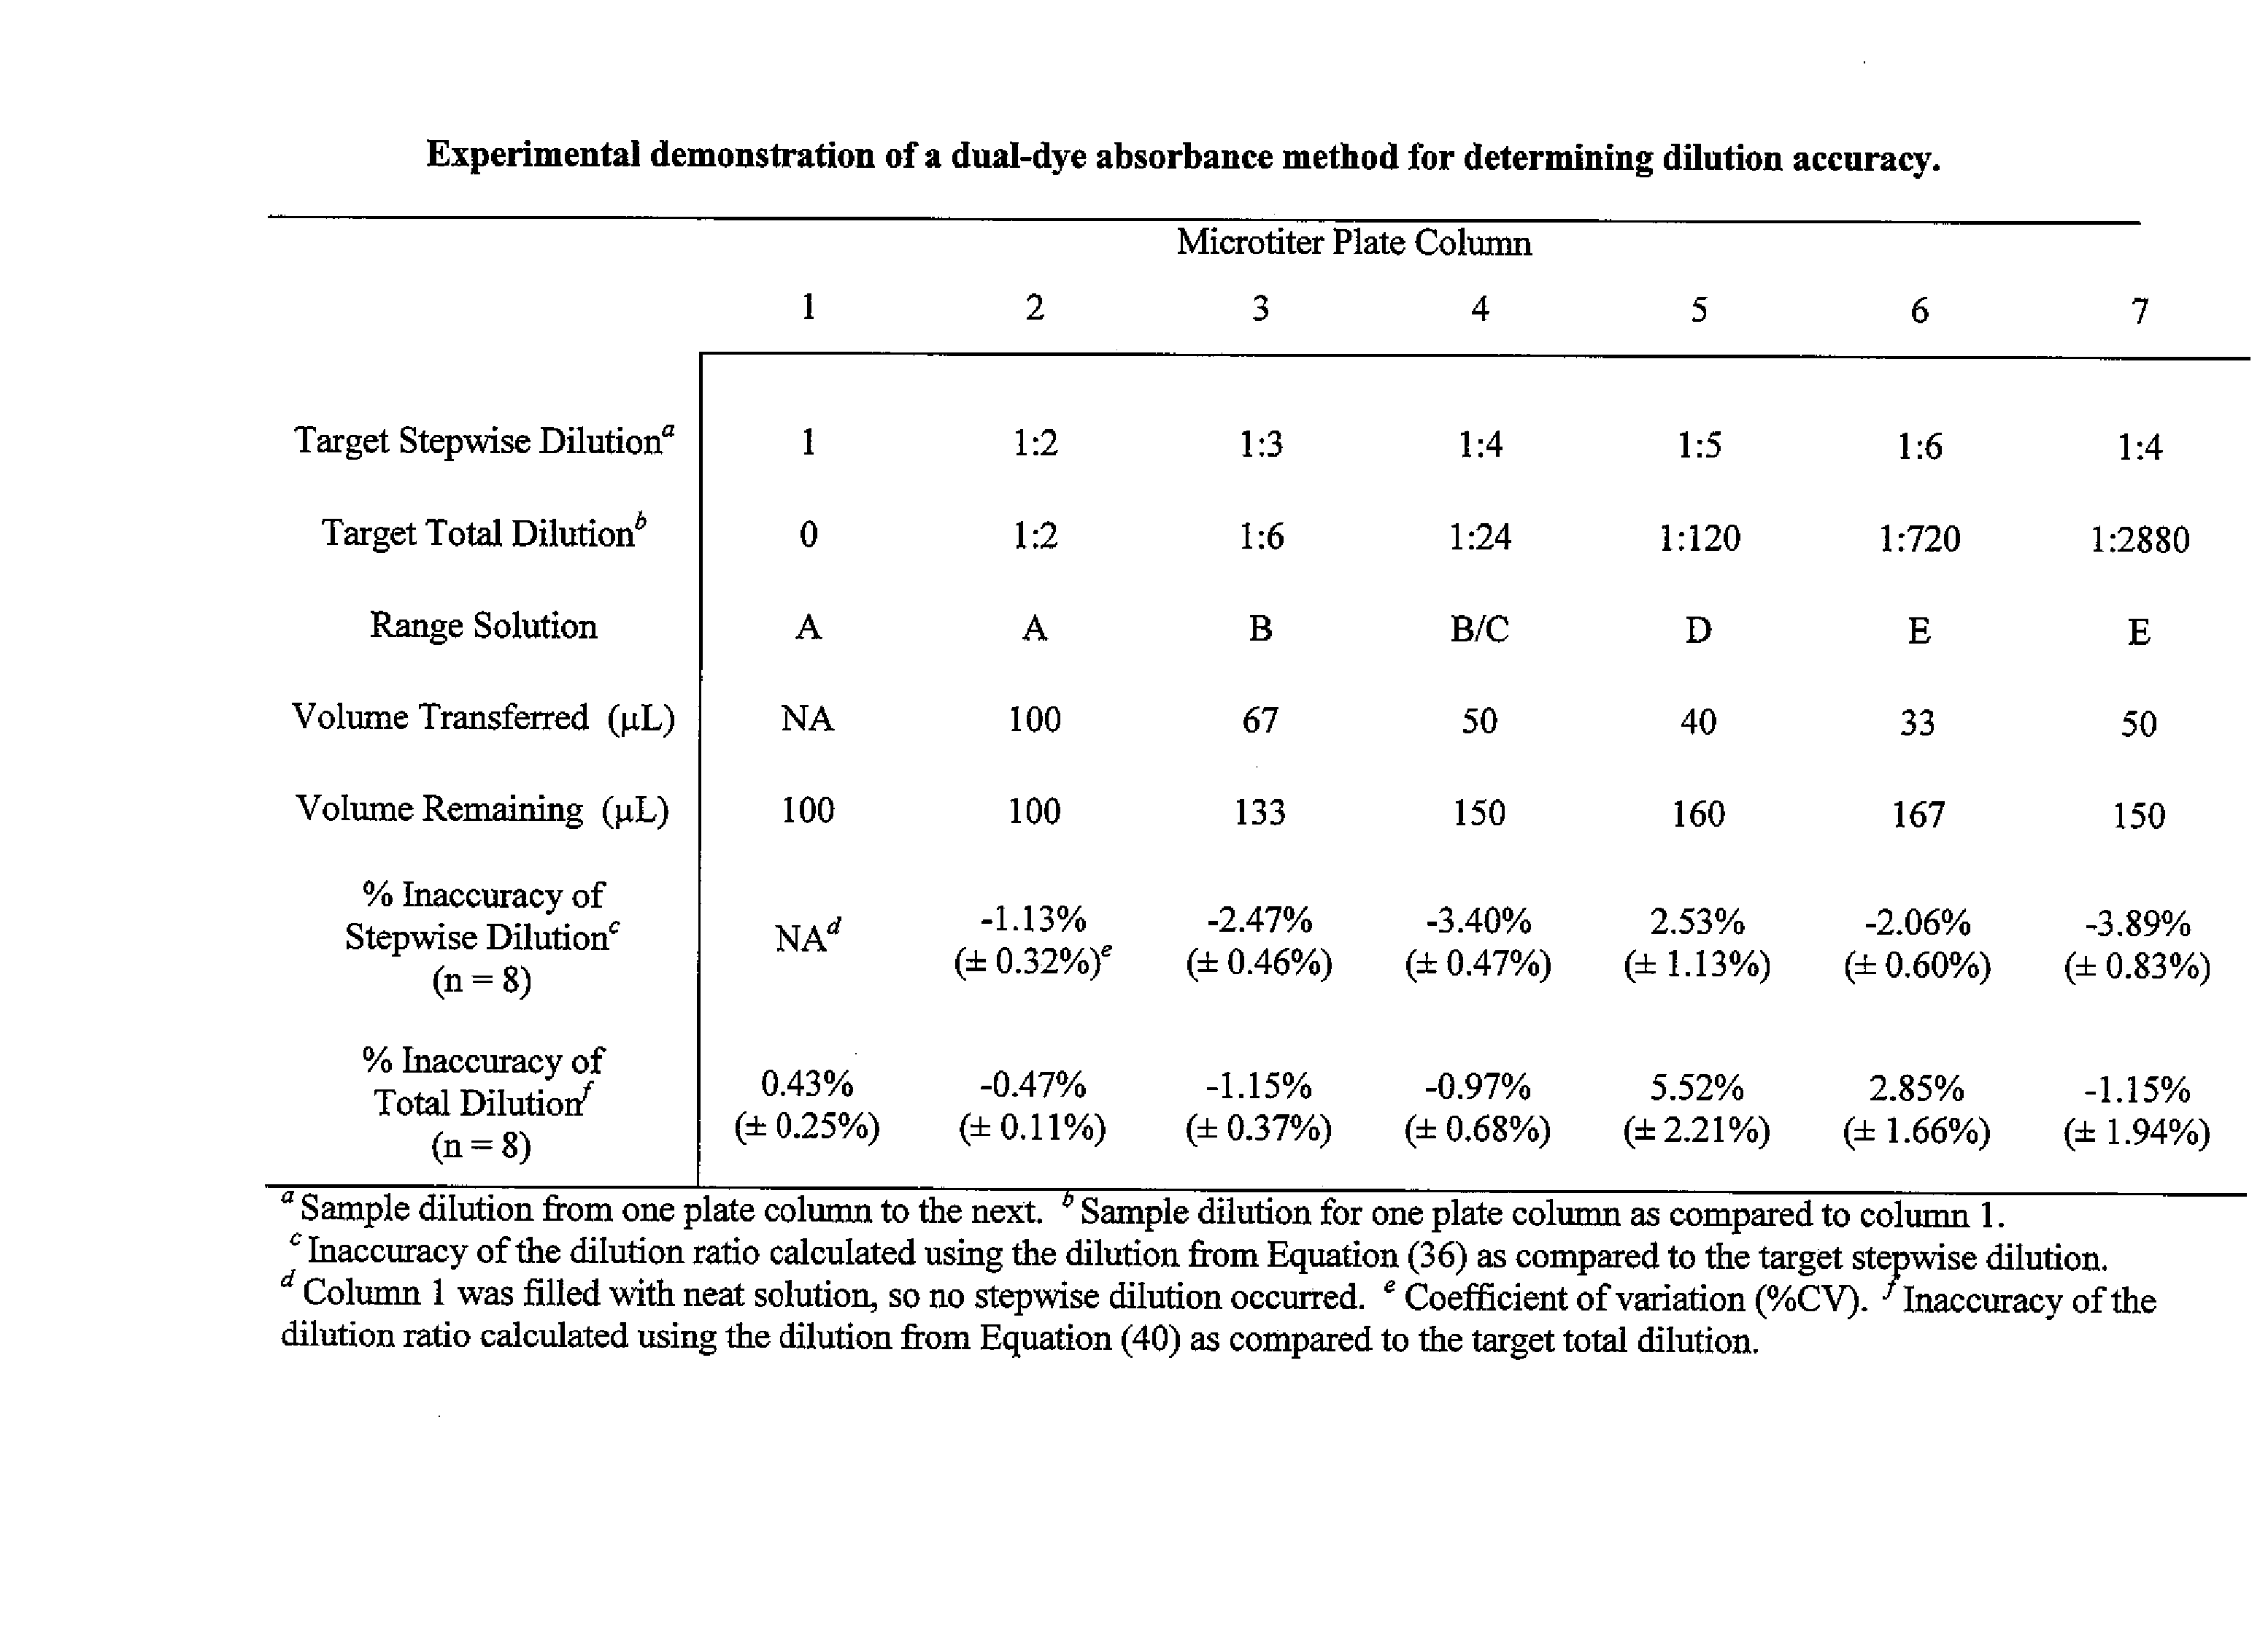
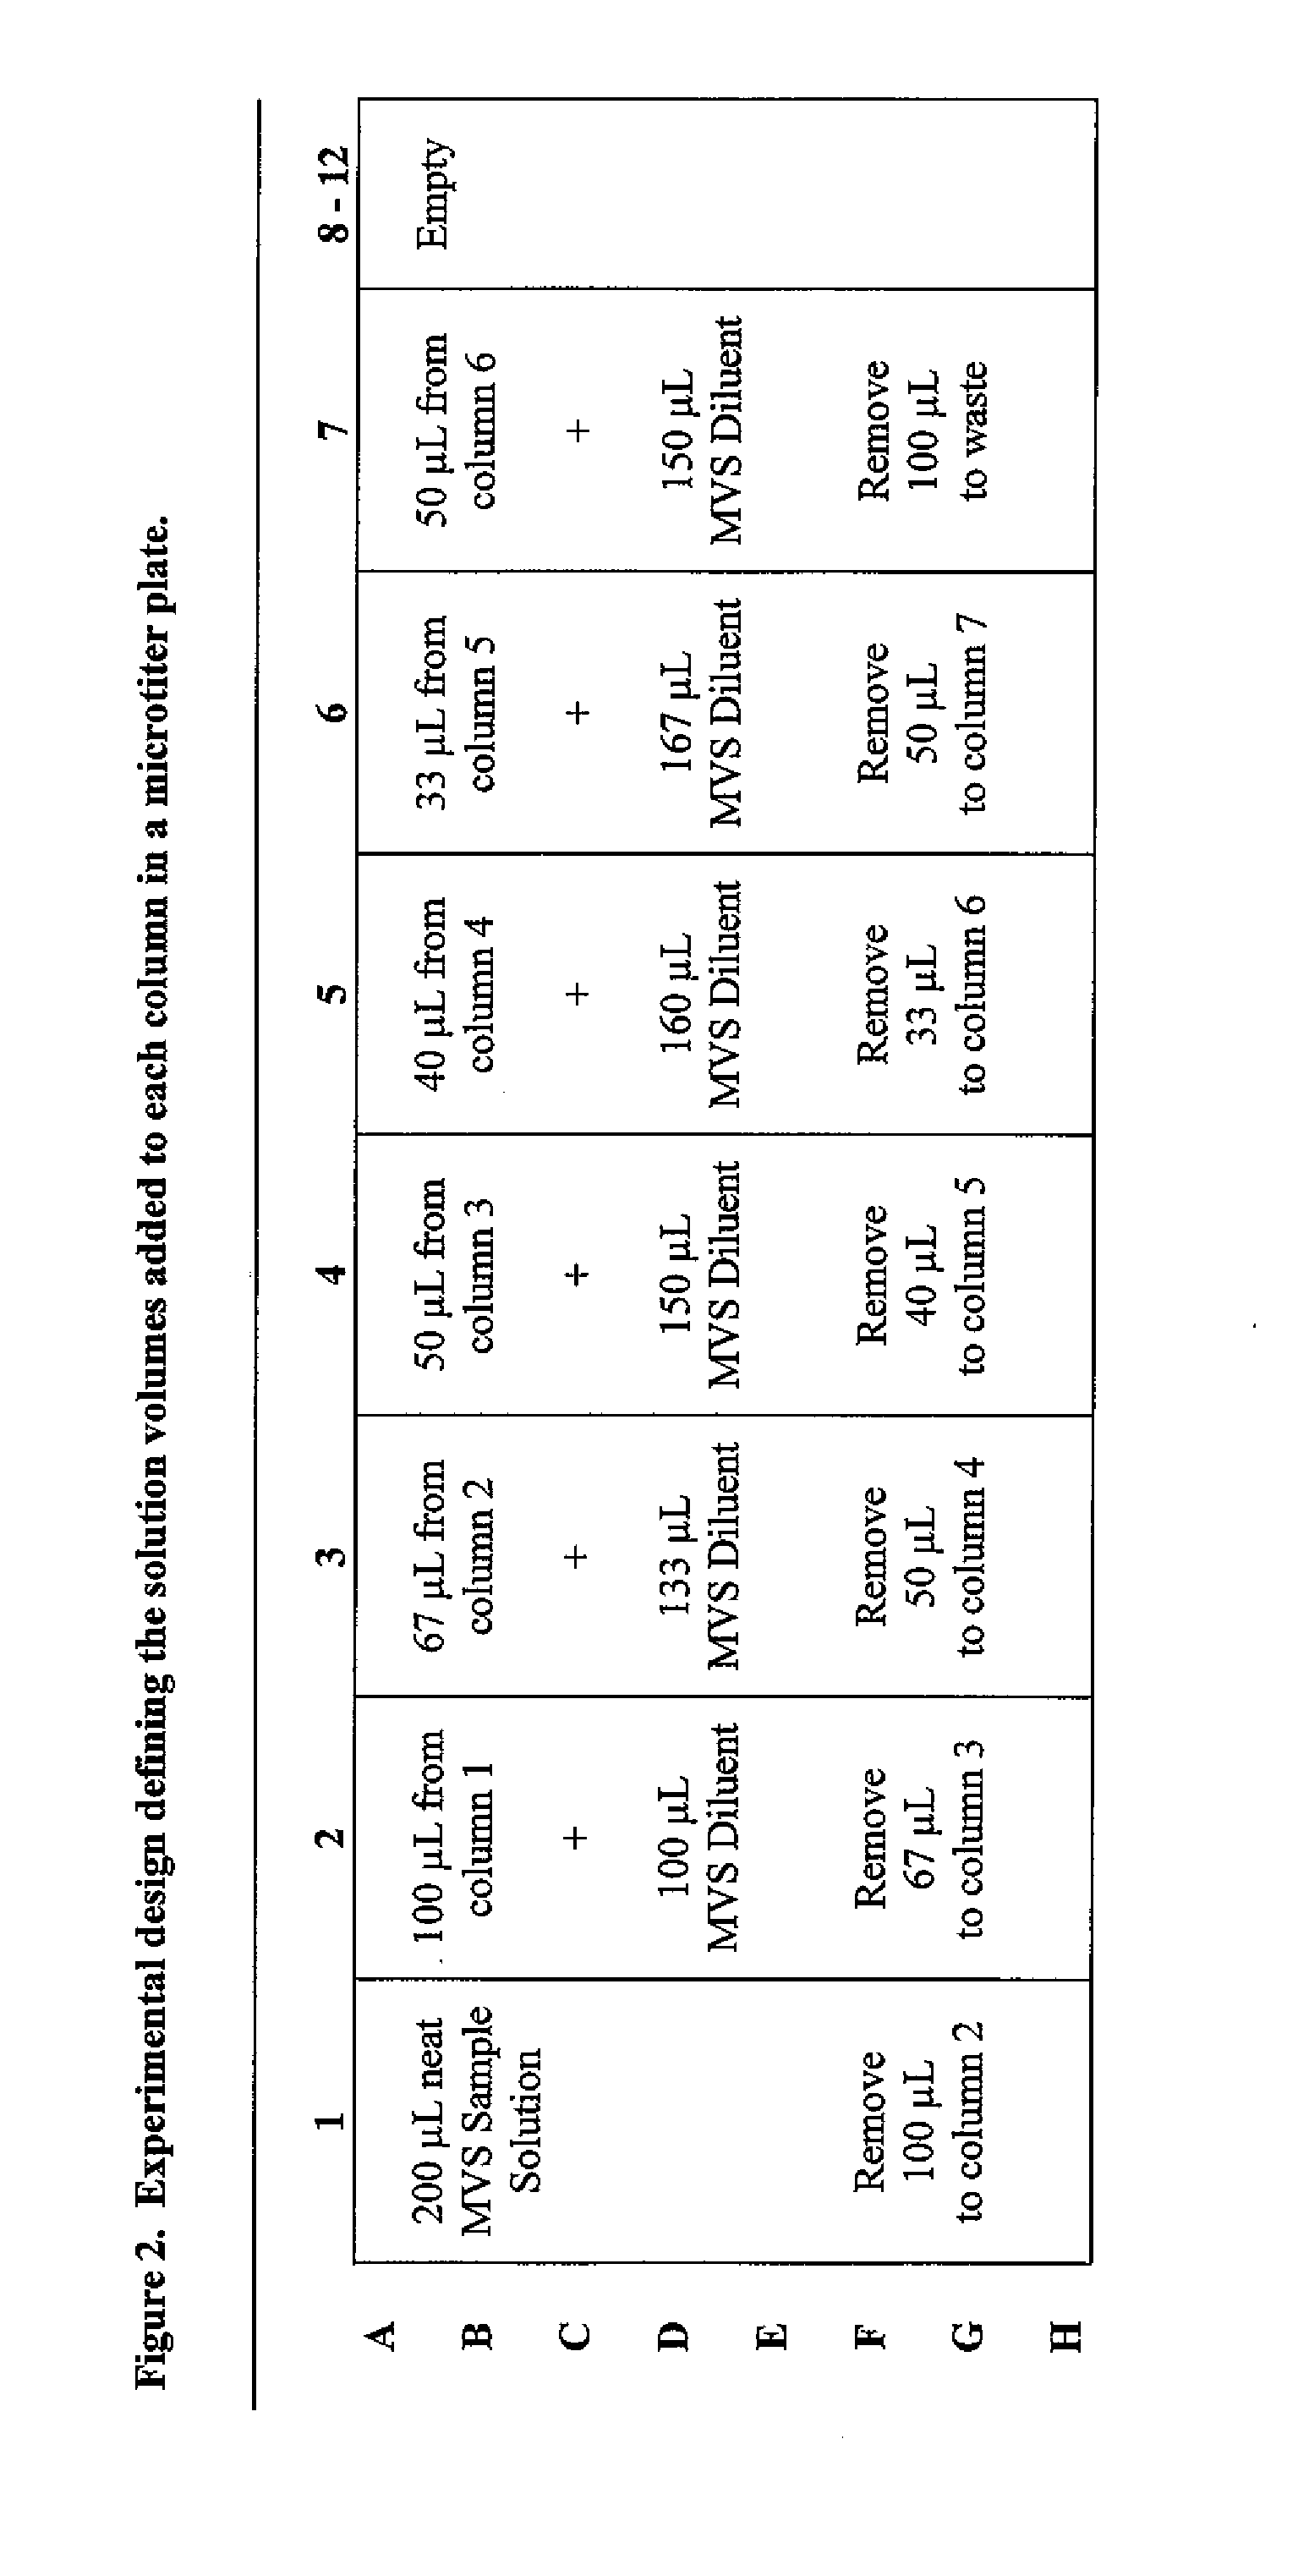
[0099] The process of Example Two included the use of the plurality of MVS® Diluent and Sample Solutions described in Example One and is summarized in representative form in the table of FIG. 4. Generally, 200 μL of undiluted (neat) MVS® Sample Solution was dispensed into each well of column 1 of a 96-well plate (i.e., into 8 wells total). 100 μL of the Sample Solution was aspirated from each well of column 1 using the multichannel pipette of Example One and dispensed into the corresponding wells of column 2, each of which contained 100 μL of Diluent solution. The contents of the wells in column two were then mixed by aspirating and dispensing 100 μL three times. 100 μL of the contents of each well of column 2 were aspirated and dispensed into the corresponding wells of column 3, each of which contained 100 μL of Diluent solution. The mixing step was then repeated for column 3. These steps were repeated across the plate resulting in 1:2 dilution steps for each well. The 100 μL sampl...

example three

[0102] Example Three demonstrates the use of the two stepwise dilution calculations presented in Equations (36) and (41) and is represented by the table of FIG. 5. The method of Example Three was not carried out in the same fashion as in the previous two Examples, wherein dilutions were produced from one well to the next in a microtiter plate. Instead, to minimize errors associated with making dilutions, gravimetric dilutions were made of MVS Range C Sample Solution (“Range C”). Three dilutions were gravimetrically made. The first dilution was a 1:20 fold dilution of Range C, made by weighing a desired amount of Range C into a bottle, followed by weighing the desired amount of MVS Diluent. The components were mixed. After mixing, a 1:2 dilution of the mixed sample was performed gravimetrically into a new bottle, and the contents were mixed. A third 1:2 dilution was performed into yet a new bottle. This resulted in three dilutions of Range C; 1:20, 1:40, 1:80.

[0103] Each of the thre...


PUM


Abstract

The invention provides ways to determine the impact of diluting a solution wherein the diluting may be carried out for any of a variety of purposes. In one embodiment, the method enables accurate volume dispensation calculations independent of meniscus shape. In another embodiment, the method enables accurate determination of plate washing efficiency. In yet another embodiment, the method enables the accurate determination of dilution ratio over a plurality of dilution steps. The methods described may be carried out using one or more systems arranged to perform the steps. A kit of the invention includes instructions for carrying out the steps of the methods and, optionally, one or more solutions suitable for conducting photometric measurements.

Description

CROSS REFERENCE TO RELATED APPLICATIONS [0001] The present application claims the priority benefit of U.S. provisional patent application Ser. No. 60 / 825,744, filed Sep. 15, 2006, entitled “QUANTITATIVE DUAL-DYE PHOTOMETRIC METHODS FOR DETERMINING VOLUME DISPENSE ACCURACY AND / OR THE CORRESPONDING DILUTION RATIO FOR VARIED LIQUIDS” of the present assignee. The present application also claims the priority benefit of U.S. provisional patent application Ser. No. 60 / 940,766, filed May 30, 2007, entitled “QUANTITATIVE DUAL-DYE PHOTOMETRIC METHODS FOR DETERMINING VOLUME DISPENSE ACCURACY AND / OR THE CORRESPONDING DILUTION RATIO FOR VARIED LIQUIDS” of the present assignee. The entire contents of those prior applications are incorporated herein by reference.BACKGROUND OF THE INVENTION [0002] 1. Field of the Invention [0003] The present invention relates to methods for determining the impact of diluting a solution. In particular, the present invention relates to a method for determining a volu...

Claims


Application Information

Patent Timeline
IPC IPC(8): G01N21/75
CPCG01N21/31Y10T436/25625Y10T436/2575
Inventor BRADSHAW, JOHN THOMASCURTIS, RICHARD H.ALBERT, KEITH J.KNAIDE, TANYA R.MCNALLY, CEARAROGERS, ALEX L.
Owner ARTEL
Why Eureka
Try Eureka