
Method, apparatus and solftware for identifying responders in clinical environment

a clinical environment and responder technology, applied in the field of clinical environment identifying responders, can solve the problems of spontaneous variability obscuring treatment-related effects, inability to accurately predict or plan future trials, and inability to salvage or otherwise learn from failed clinical trials, etc., to achieve the effect of improving performan

Inactive Publication Date: 2009-06-11
ACORDA THERAPEUTICS INC
View PDF2 Cites 21 Cited by
  • Summary
  • Abstract
  • Description
  • Claims
  • Application Information

AI Technical Summary

Benefits of technology

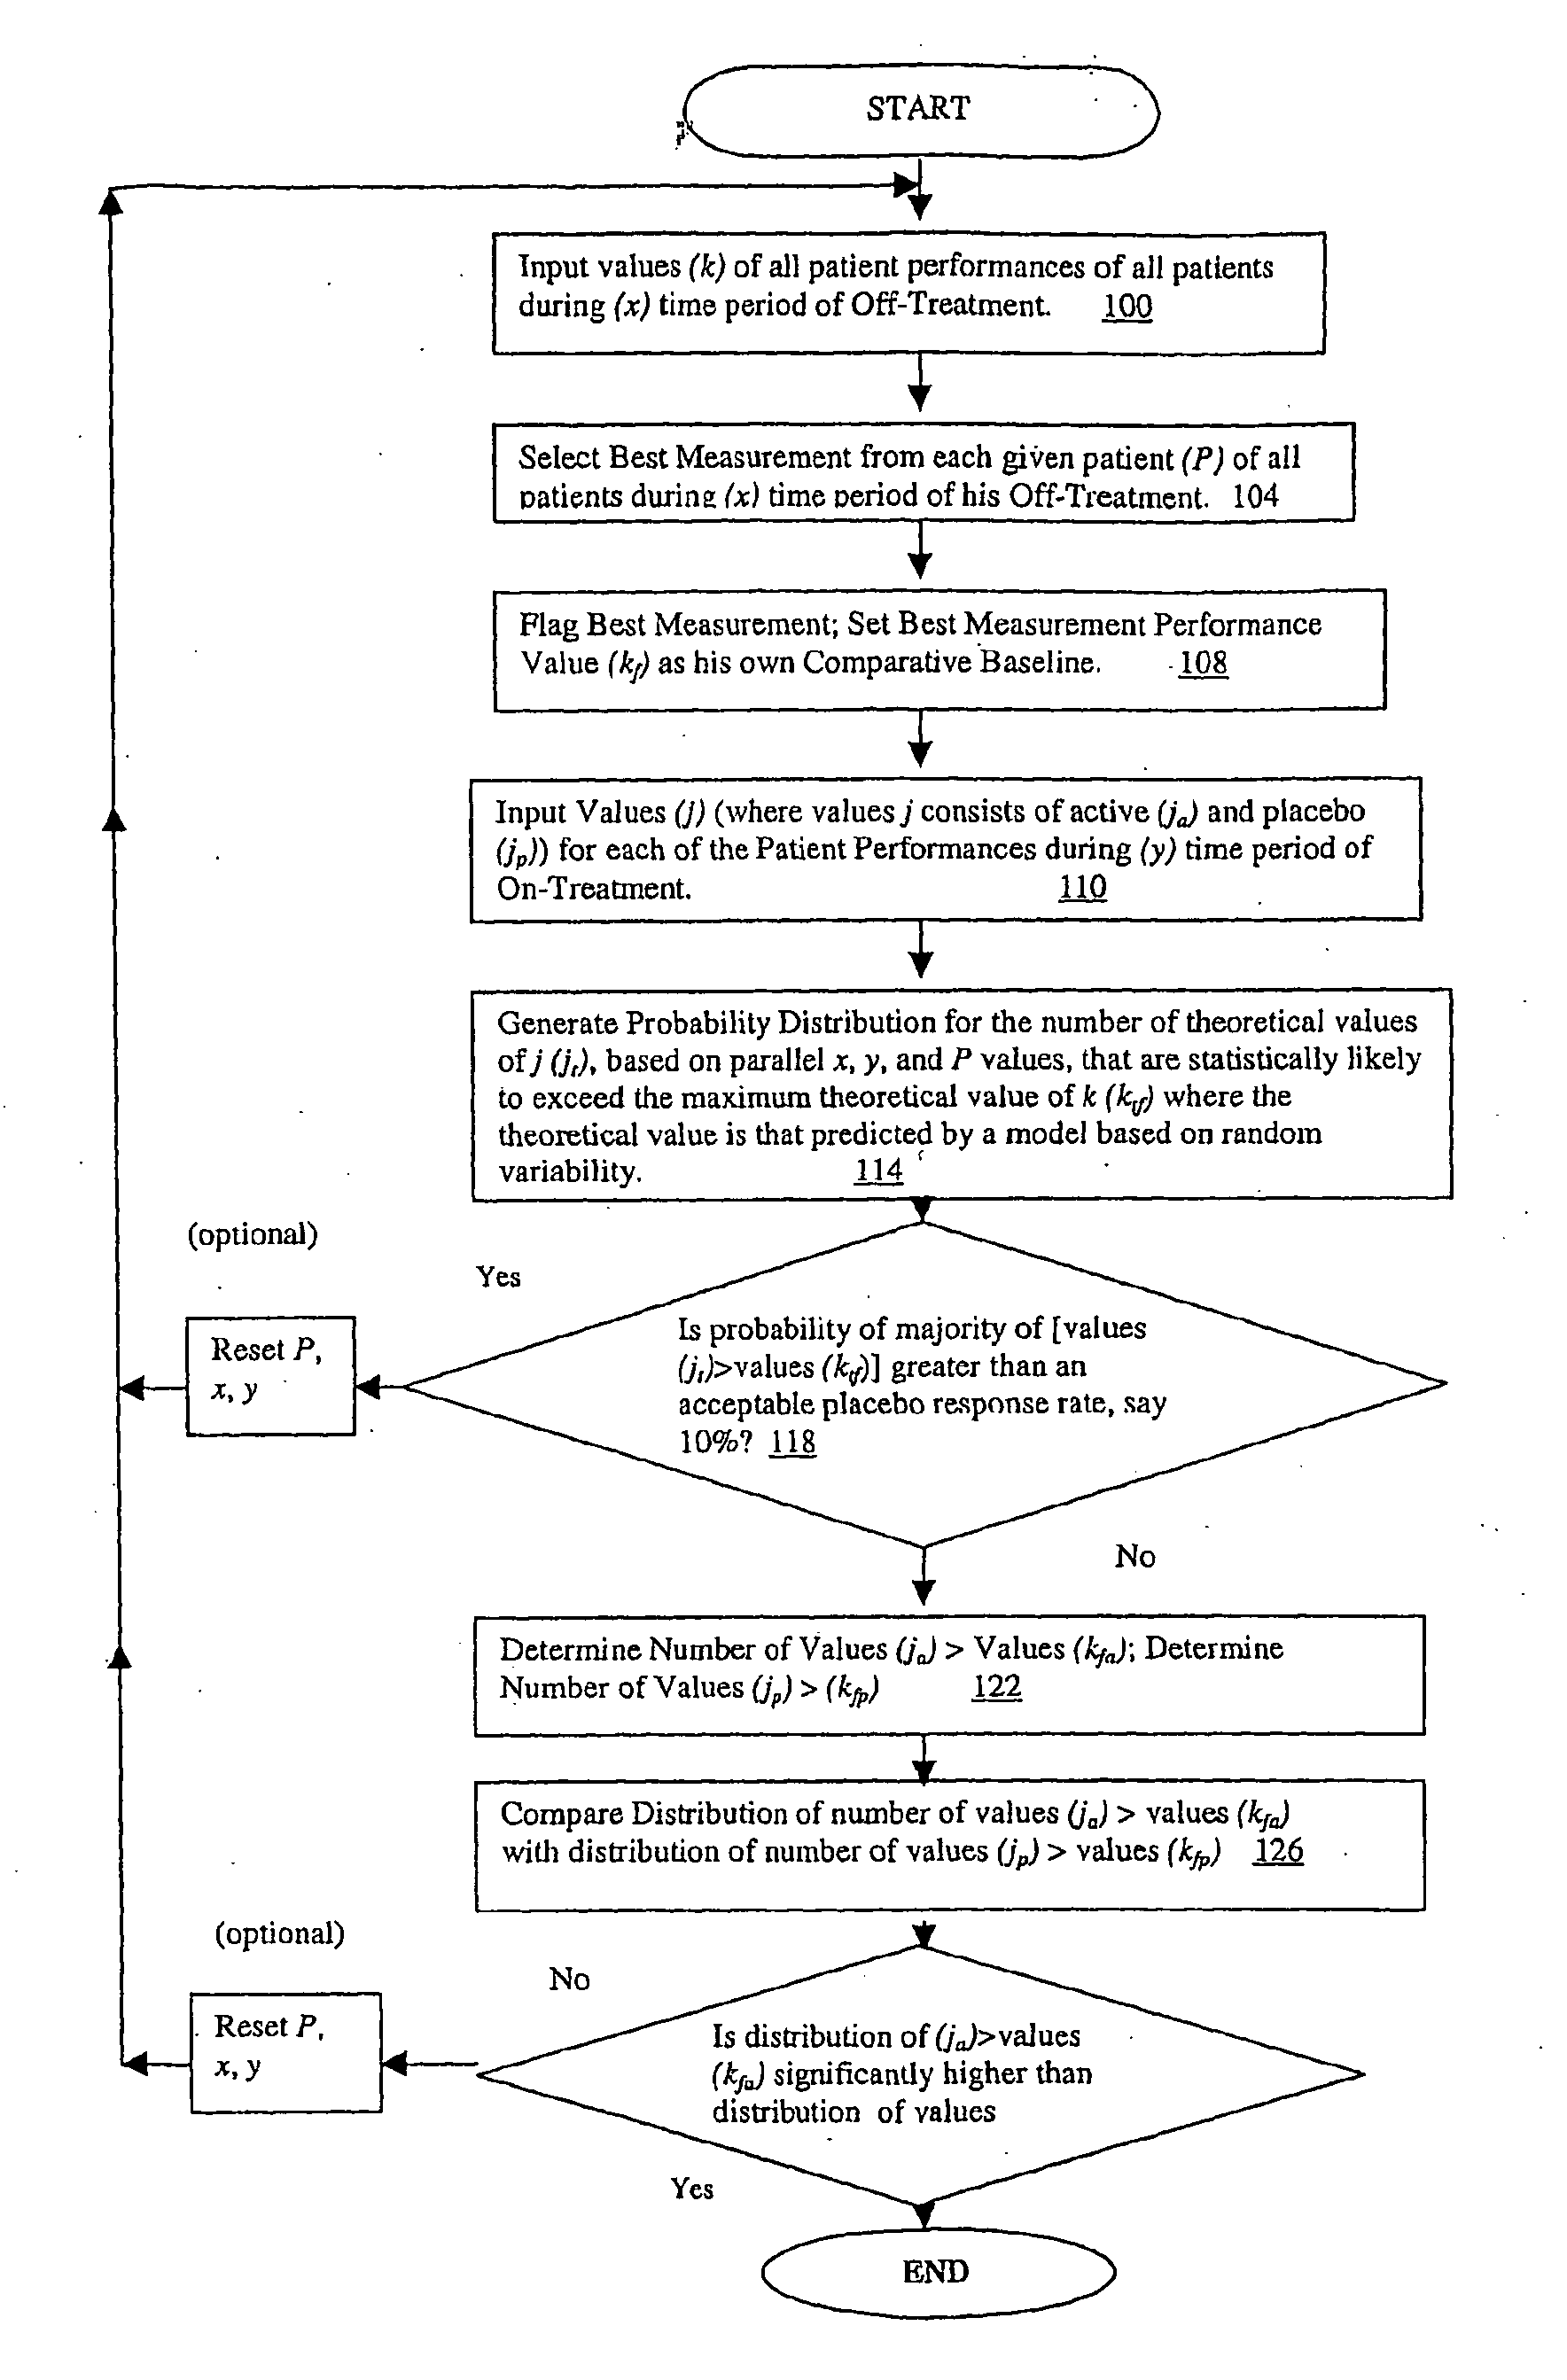
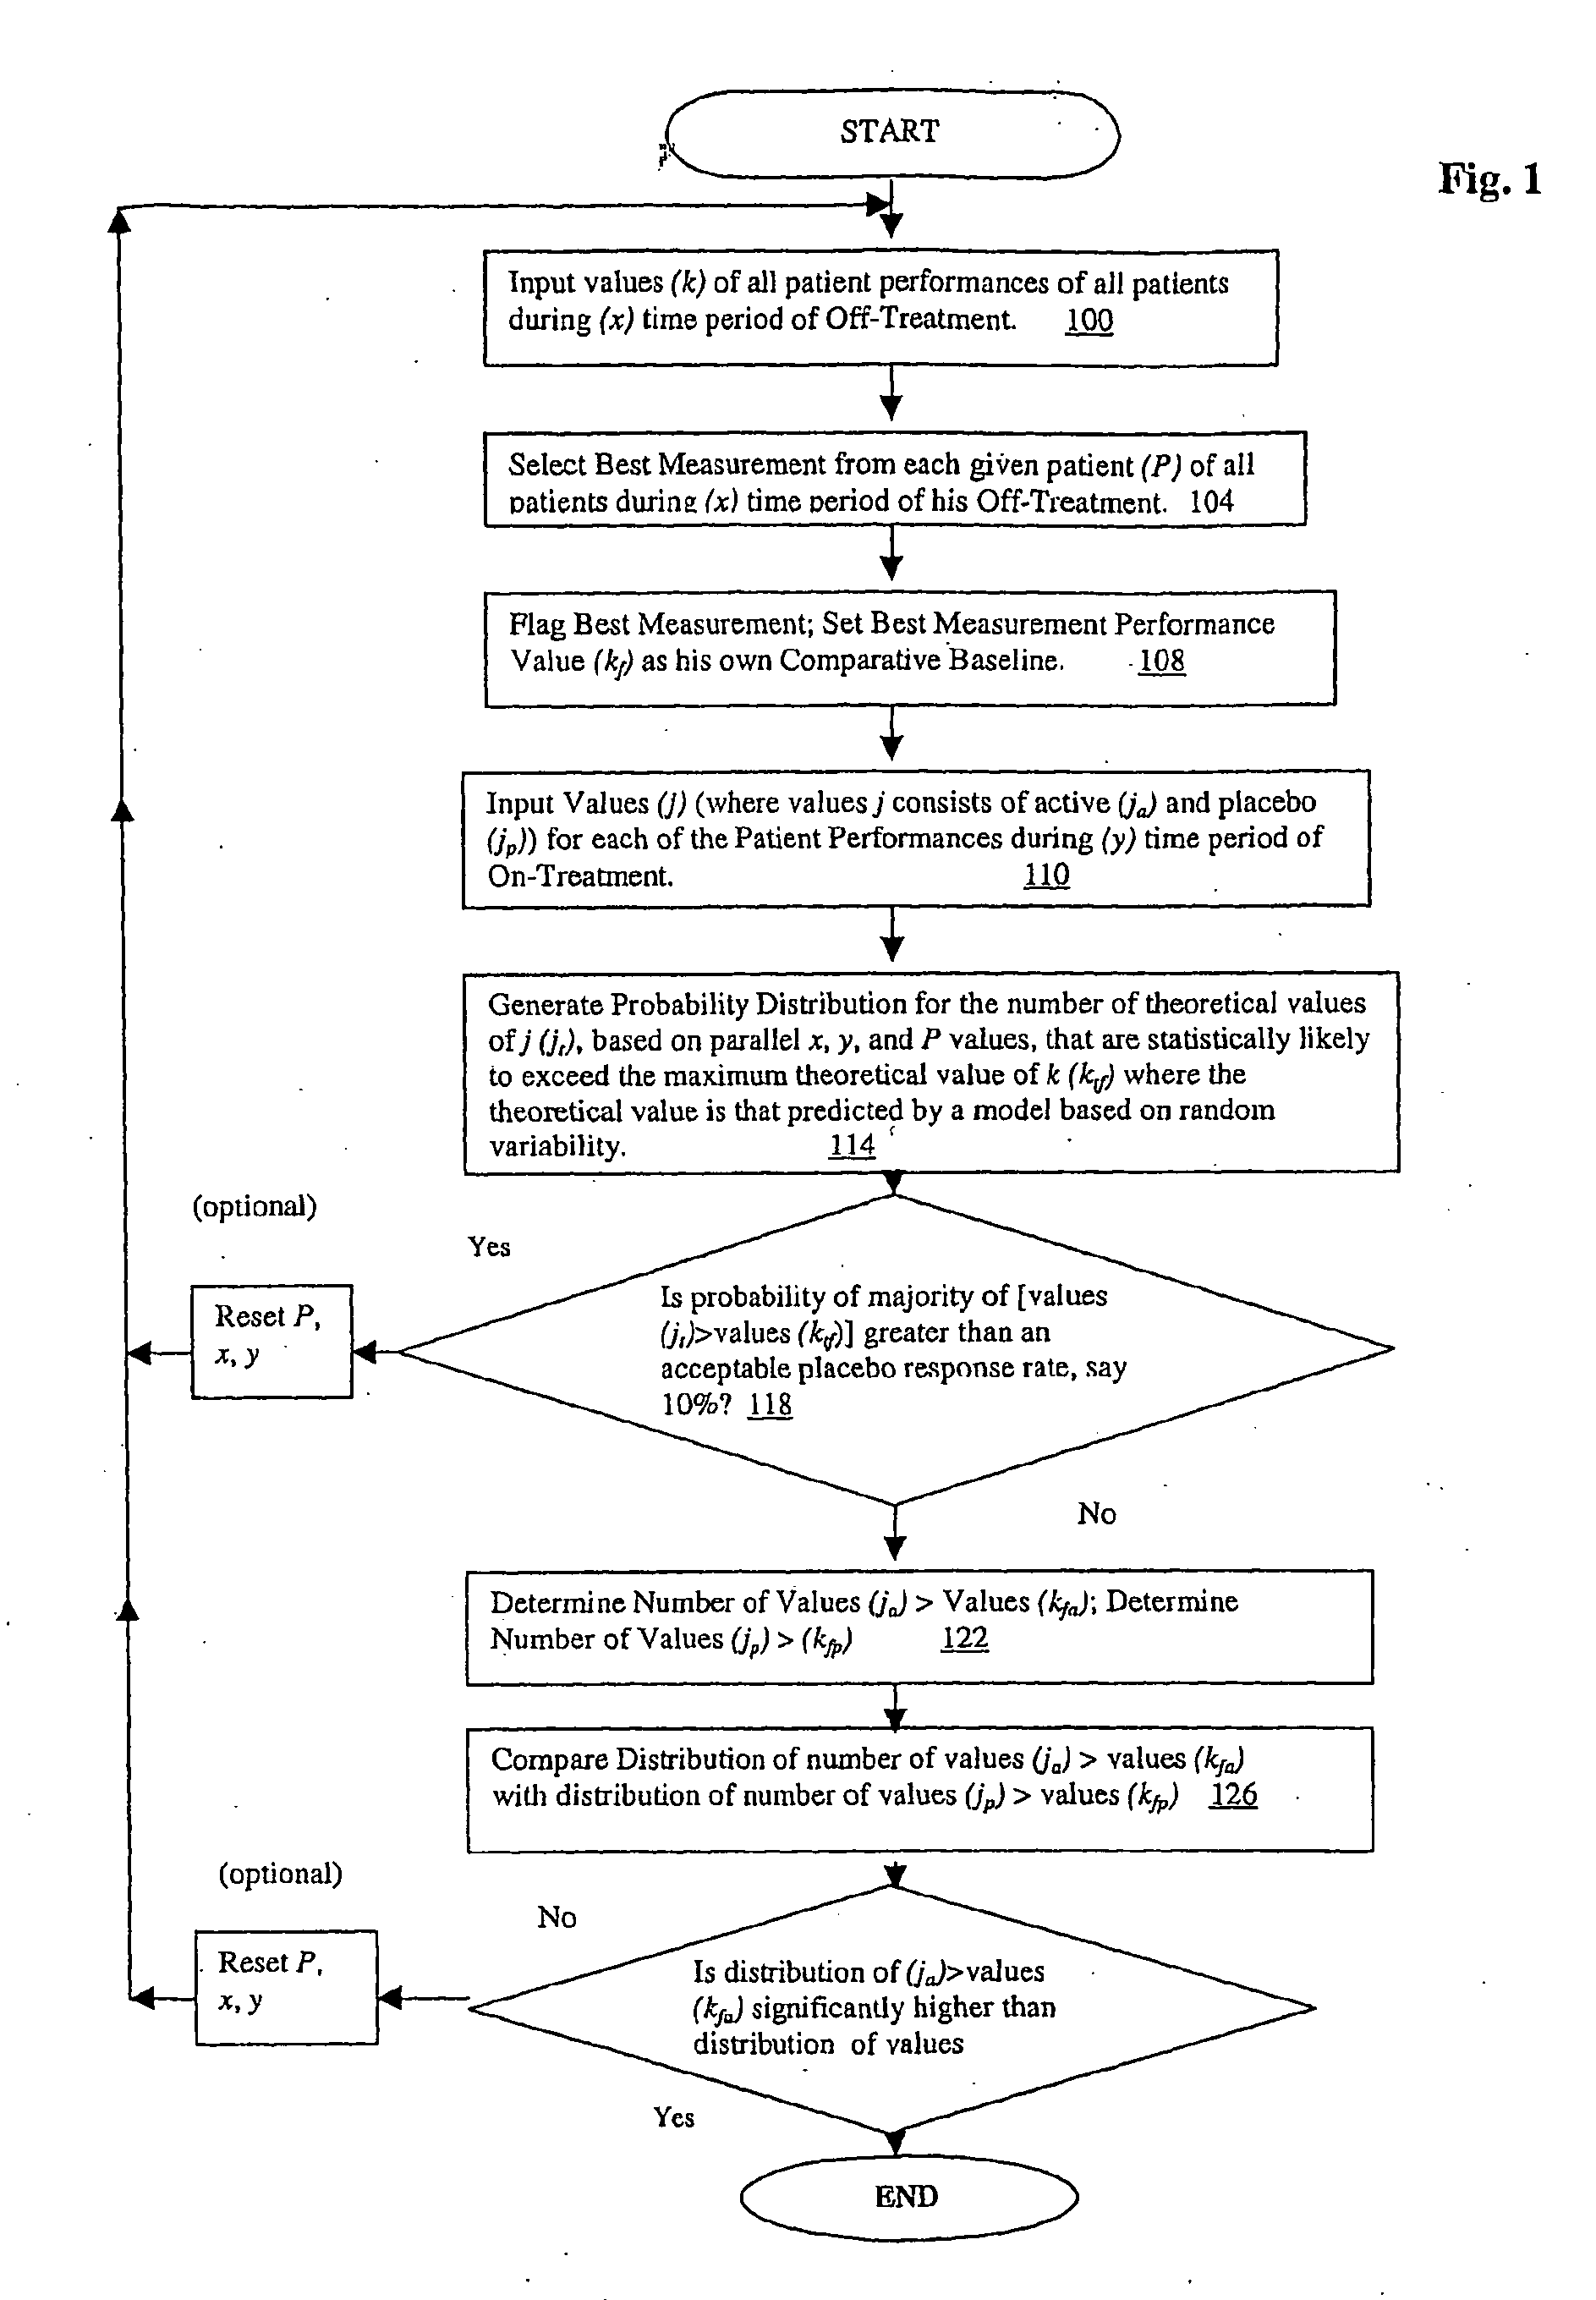
[0010]A further embodiment relates to a method of selecting individuals based on responsiveness to a treatment, the method comprising identifying a plurality of individuals; administering a test to each individual prior to a treatment period; administering a treatment to one or more of the individuals during the treatment period; administering the test a plurality of times to each individual during the treatment period; administering the test to each individual after the treatment period; and selecting one or more individuals, wherein the selected individuals exhibit an improved performance during a majority of the tests administered during the treatment period as compared to the better performance of the test administered prior to the treatment period and the test administered after the treatment period.

Problems solved by technology

Clinical researchers have the ongoing problem of not being able to accurately predict or plan future trials, and are not able to salvage or otherwise learn from failed clinical trials.
This is problematic, because if these measurements are to be used as treatment outcome measures, the spontaneous variability can obscure the treatment-related effects.
This interference between spontaneous and induced changes may be particularly problematic under conditions where only a subset of trial subjects respond to treatment.
Under these conditions, the treatment effect in the responsive subjects may be diluted by the non-responders in addition to the contamination of spontaneous variability.
These few sample measurements will not adequately represent the full range of variation of the outcome variable, either during the baseline comparison period or during the treatment period.
Where the magnitude of the spontaneous variability of the population is large compared to the expected treatment effect in the individual, it can be difficult to determine the presence of response to treatment based on the average difference between baseline and treatment periods.

Method used


Image

  • Method, apparatus and solftware for identifying responders in clinical environment
  • Method, apparatus and solftware for identifying responders in clinical environment
  • Method, apparatus and solftware for identifying responders in clinical environment

Examples


example 1

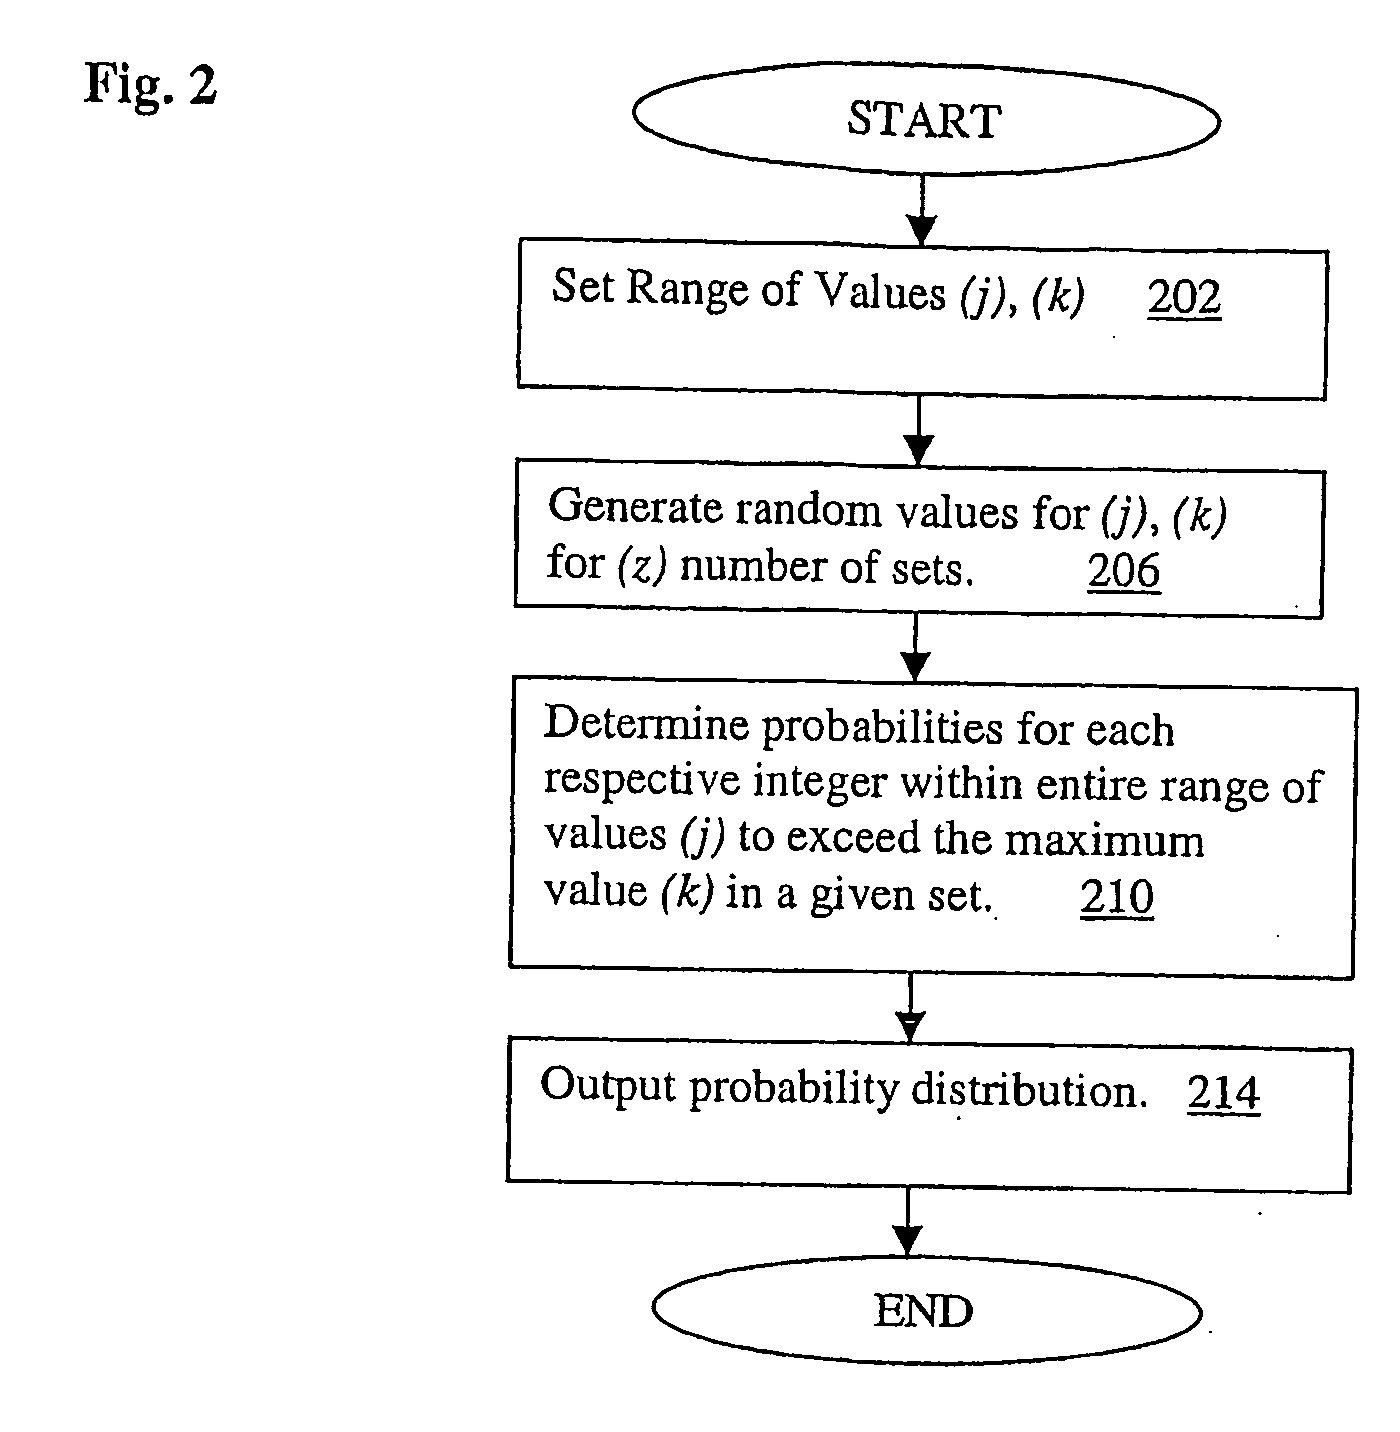
[0052]Theoretical basis: Assuming a clinical trial such that for each patient there are S off-drug measurements of a particular affected function and T on-drug measurements. Let Y represent the number of on-drug measurements that are better (e.g. more normal) than the best off-drug measurement. Assume Y follows the range disparity (RD) distribution. For example, if there are S=5 off-drug visits and T=5 on-drug visits then the probability distribution of Y, is:

y[P (Y = y)]× 100%050.00%127.78%213.89%35.95%41.98%50.40%

[0053]This distribution implies that, if the active treatment has no effect we would expect the proportion of patients who experience a consistent improvement, reflected by 4 or 5 on-drug measurement better than the best off-drug measurement, to be about 2.5%. The null hypothesis that the groups are equal with regard to the proportion of subjects with consistent improvement can be tested using a standard test such as Fisher's exact test, a chi-square test, or for stratifi...

example 2

[0061]Practical experience: The following is based on data from a clinical trial that examined the effects of a novel treatment in improving walking speed in patients diagnosed with a chronic disease and was designed with 5 off-drug and 4 on-drug assessments of walking speed. Subjects were randomized to receive active drug or placebo in a 3:1 ratio. For a given patient, if we let Y represent the number of on-drug measured walking speeds that are faster than the fastest off-drug walking speed and assume Y follows the RDD we have:

TABLE 1Table showing the theoretical distribution of on-drugvisits with faster walking speeds than the fastestoff-drug walking speed using the RDD.y[P (Y = y)]× 100%055.56%127.78%211.90%33.97%40.79%

[0062]Applying the general approach to determine an appropriate response criterion, response to treatment was defined as a faster walking speed in at least 3 of the 4 on-drug visits compared to the fastest speed measured during the 5 off-drug visits. There were 205...

example 3

[0070]The application of this distribution is particularly powerful in the context of a repeated measures response analysis of the kind provided by Example 2. However, it may be useful in various simpler situations, for example, in a case of industrial product sampling. There might be a suspicion that plant A is producing items with a breaking strength that is lower than those from plant B. For destructive testing of items from the two plants we would likely want to minimize the sample size. If we sampled 5 out of 100 items from the next production run at each plant and determine that the breaking strength of more than 2 of these items from plant A falls below the range of the 5 tested from plant B we would have support for the suspicion regarding a difference between the plants. More specifically, we would know that there is less than a 2.5% chance, on the basis of random variability (Example 1), that 4 or 5 of the samples from A would fall below the failure range for those from pl...


PUM


Abstract

A process for determining responders in clinical testing environments that involves, inter alia, detecting treatment response through the use of small numbers of measurements of randomly varying outcome variables in individual clinical trial subjects, and by analyzing the measurements in such a way as to eliminate troublesome variables, such as a spontaneous population variability.

Description

BACKGROUND[0001]Clinical researchers have the ongoing problem of not being able to accurately predict or plan future trials, and are not able to salvage or otherwise learn from failed clinical trials. There are many reasons for this. First, functional measurements from clinical trial subjects with certain kinds of conditions like MS and other ailments can vary extensively and randomly over time. This is problematic, because if these measurements are to be used as treatment outcome measures, the spontaneous variability can obscure the treatment-related effects. This interference between spontaneous and induced changes may be particularly problematic under conditions where only a subset of trial subjects respond to treatment. Under these conditions, the treatment effect in the responsive subjects may be diluted by the non-responders in addition to the contamination of spontaneous variability.[0002]Moreover, clinical trials also frequently rely on just a few, intermittent measurements ...

Claims


Application Information

Patent Timeline
IPC IPC(8): G06Q50/00
CPCG06F19/3481G06Q50/24G06F19/363G16H10/20G16H10/60G16H20/00G16H50/70
Inventor COHEN, RONBLIGHT, ANDREW R.MARINUCCI, LAWRENCE
Owner ACORDA THERAPEUTICS INC
Learn More