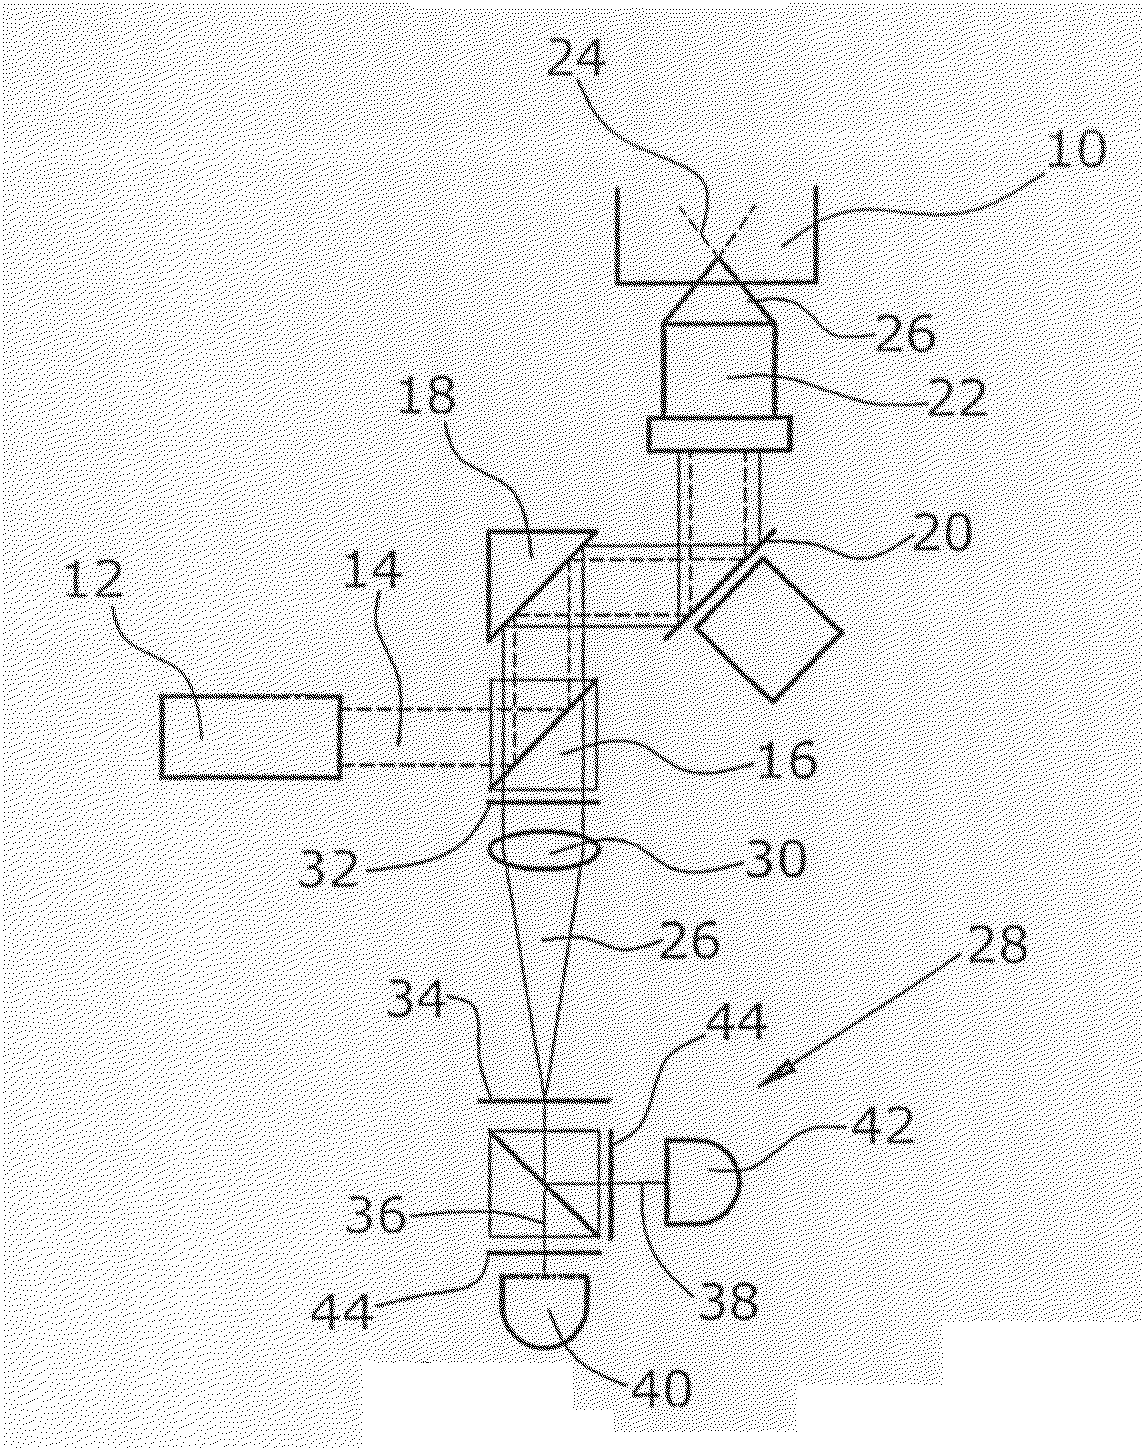
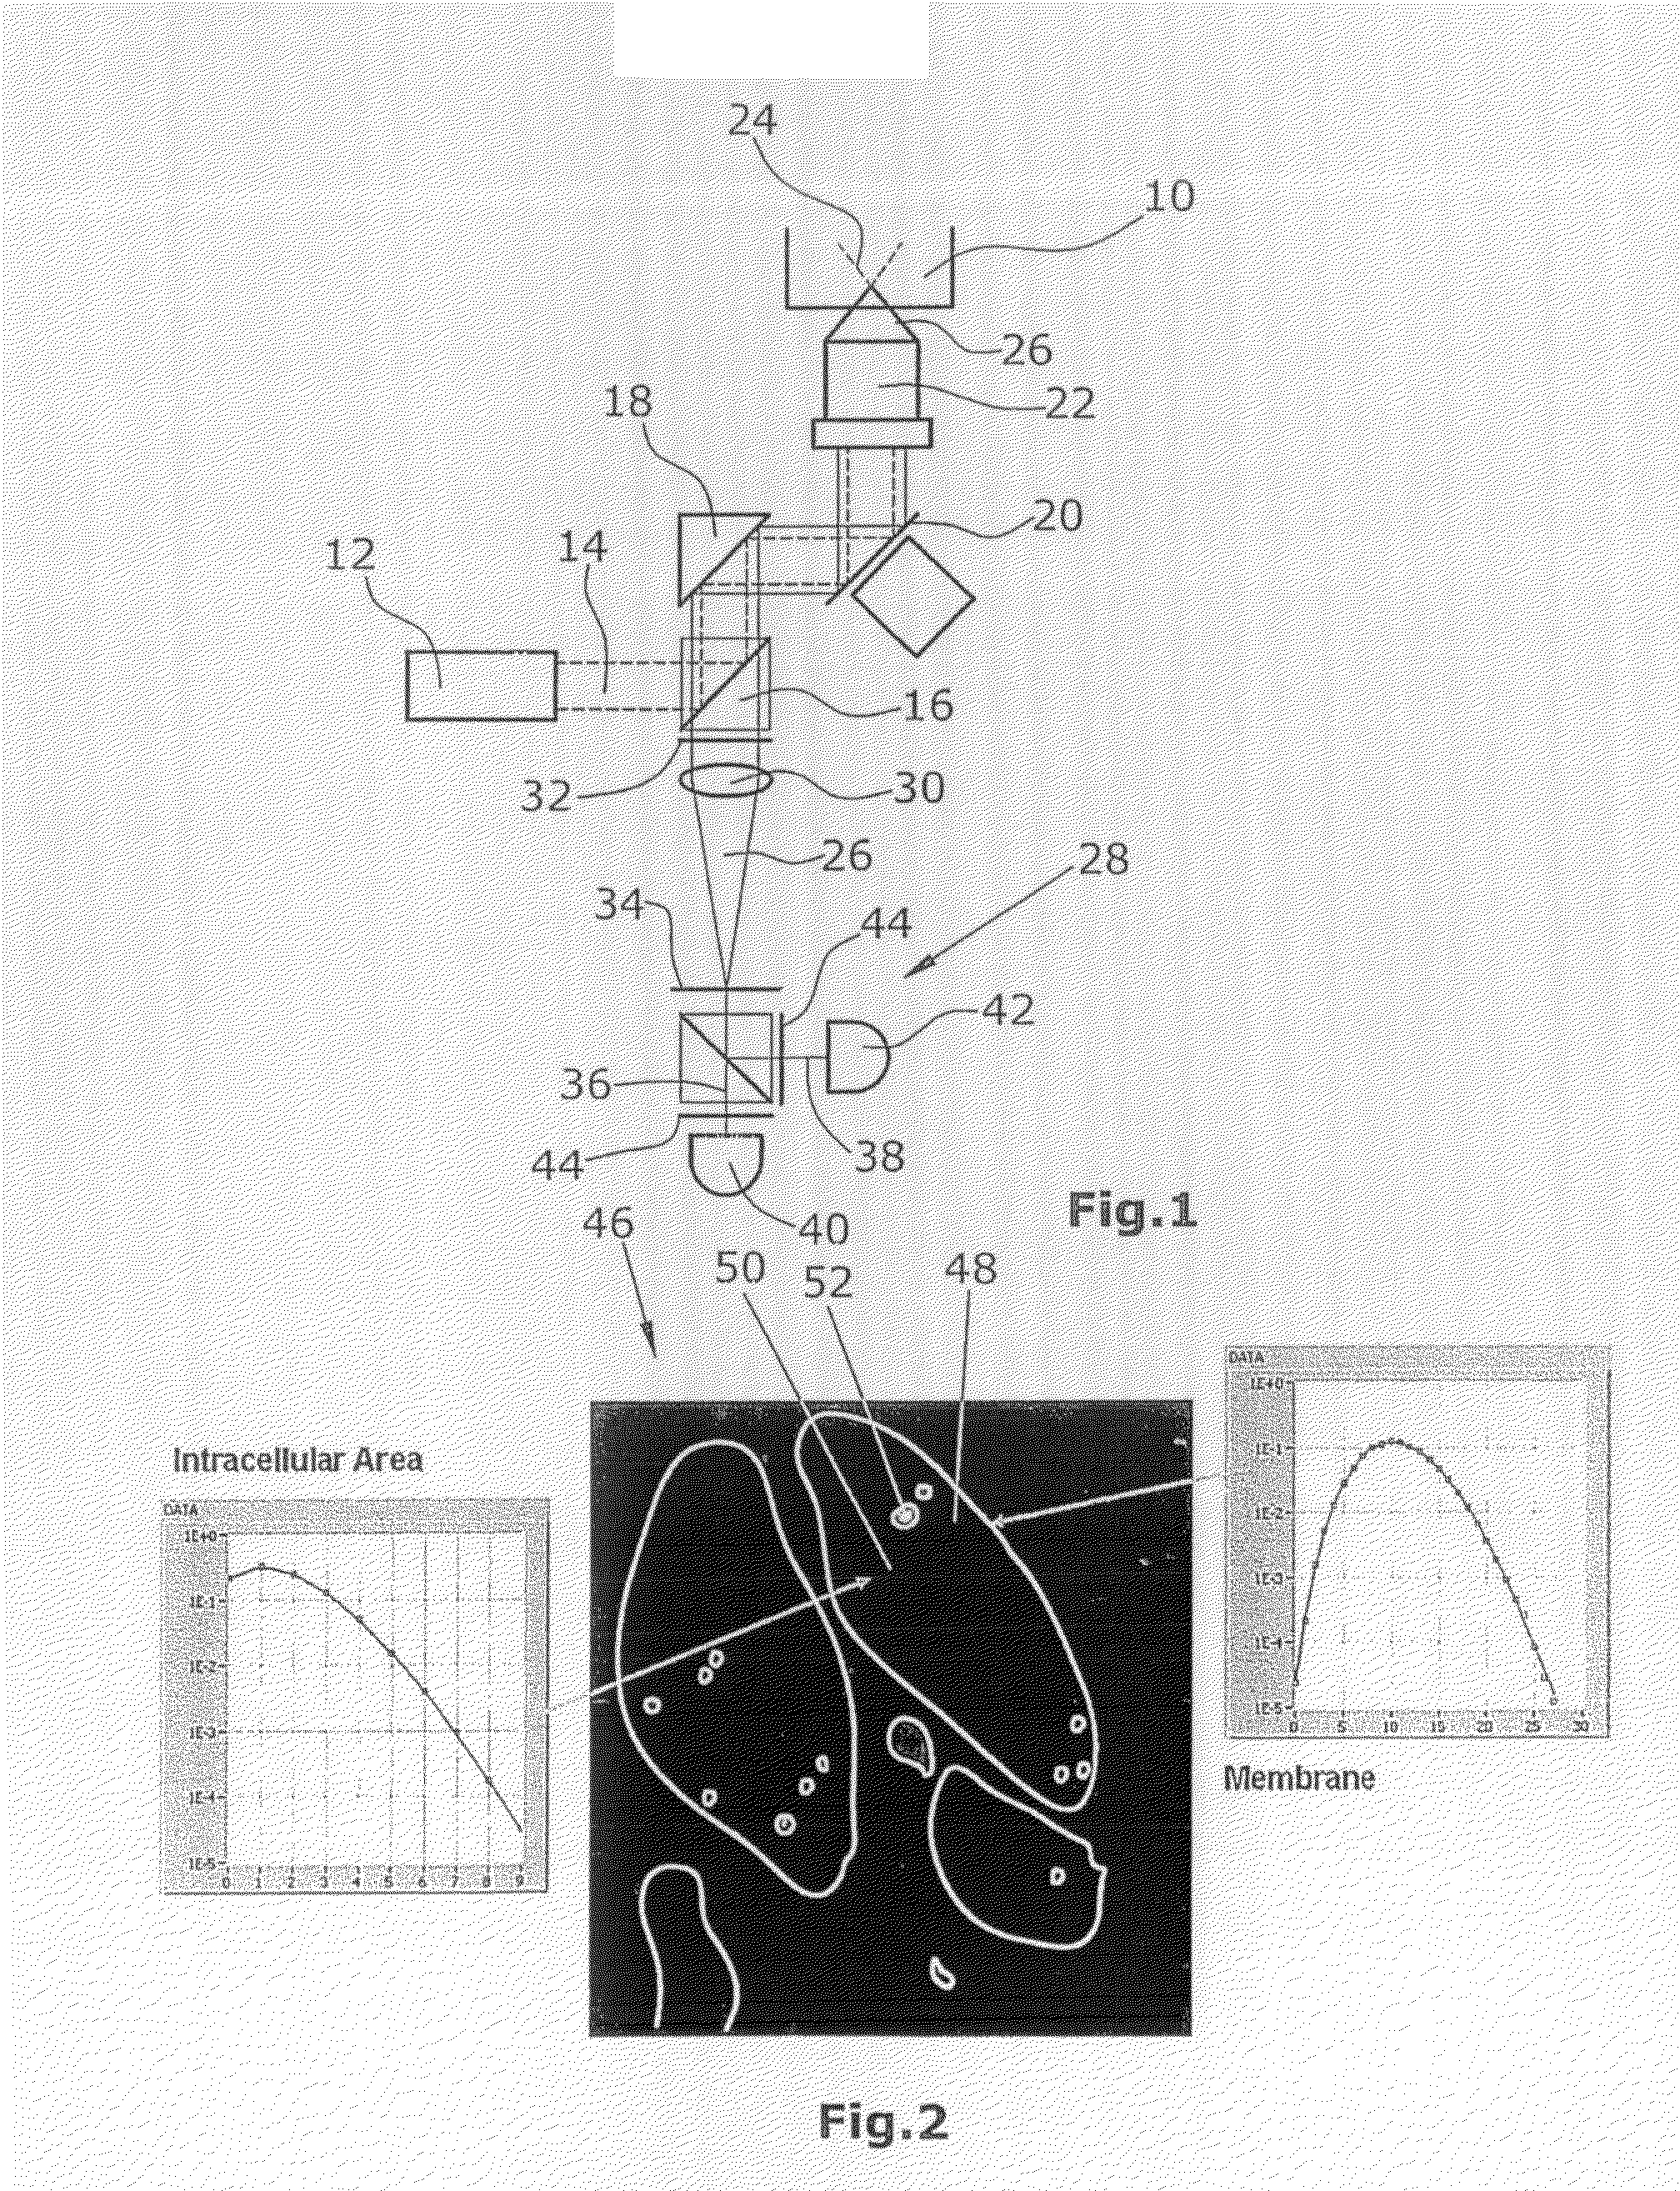
[0010]In a first step of the
analysis method of the disclosure, a sample image is taken. The taking of the sample image is carried out particularly by use of
digital imaging techniques. To this end, the sample is preferably scanned in a line-by-line manner. The sample image, which comprises a plurality of individual pixels, is taken preferably by means of CCD cameras, photodiodes or photomultipliers. During the scanning of the sample, the sample is illuminated or excited by
radiation in a line-by-line manner. The
radiation thus emitted by the sample is detected particularly by pixels. In the process, the region of the sample which corresponds to a pixel is illuminated for a specific period of time, and the
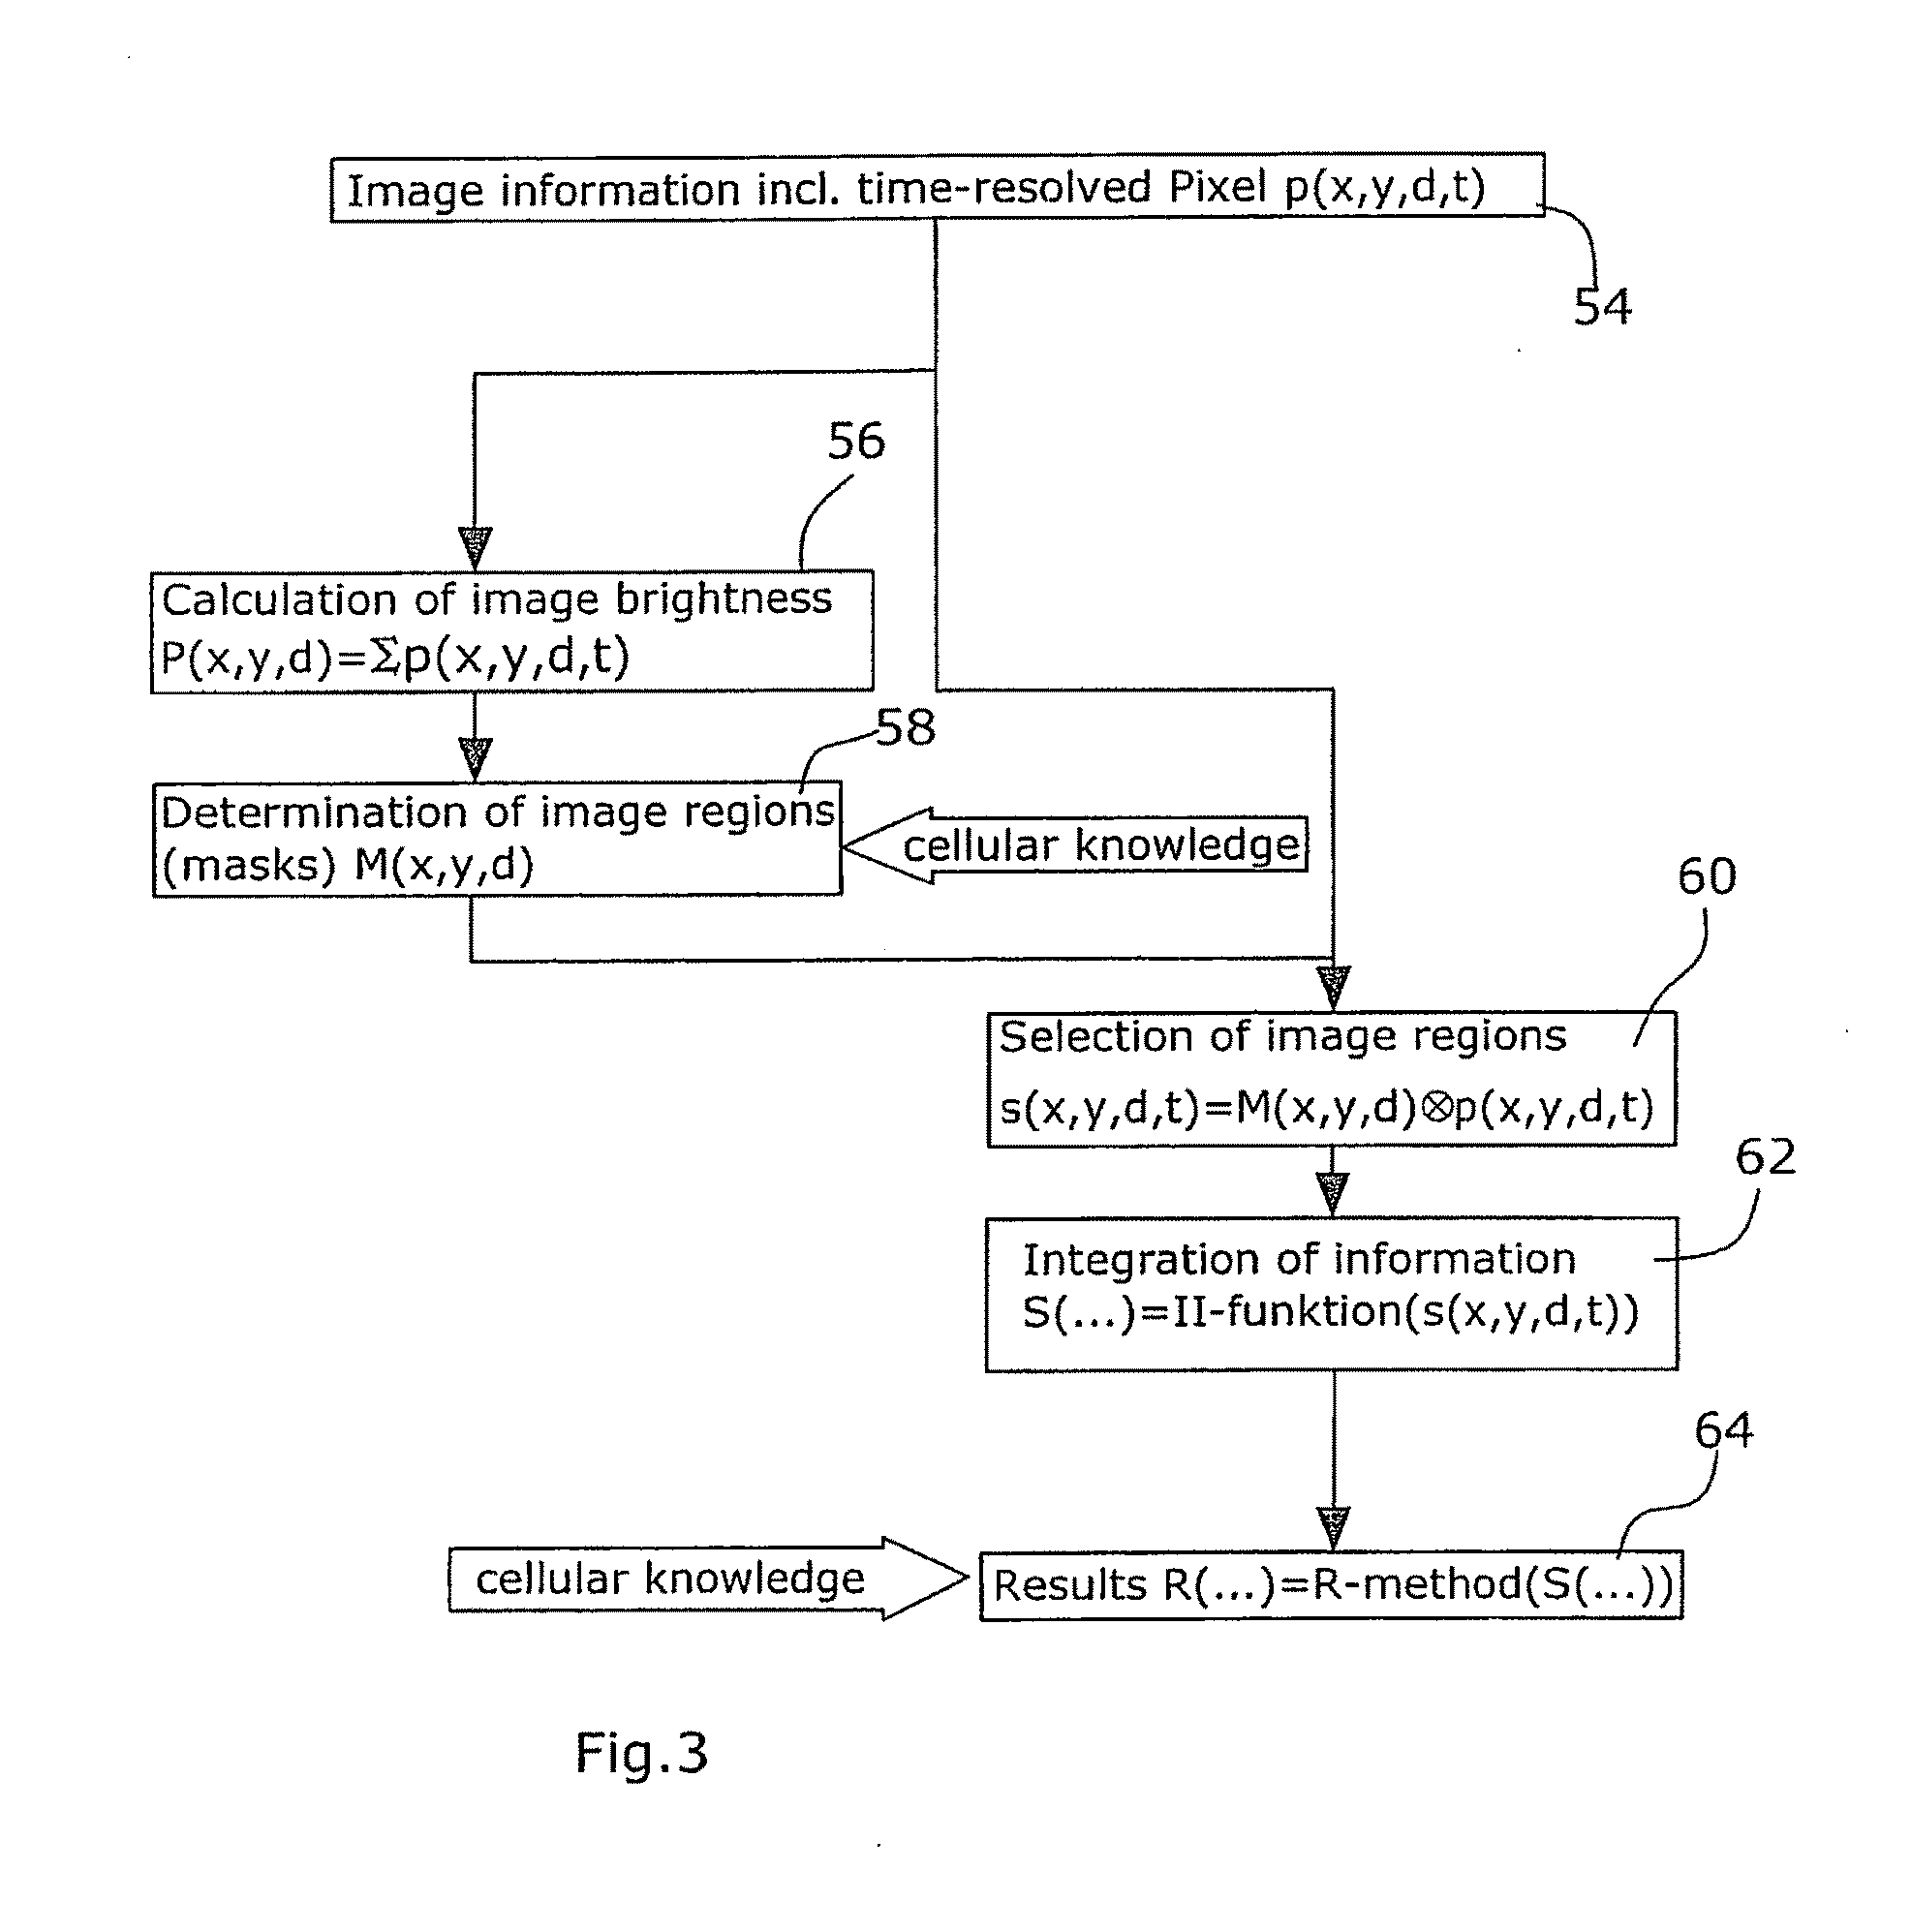
radiation emitted by the sample is captured by the corresponding pixel. According to the disclosure, it is already during the acquisition of the image, i.e. while generating the sample image, that analysis data are generated for each individual pixel. Thus, according to the disclosure, the generating of the sample image as well as the generating and respectively storing of the analysis data, are performed at the same time. According to the disclosure, the analysis data comprise pixel information resolved into
time series, which information will be later evaluated preferably with the aid of fluctuation analysis methods. The pixel information resolved into
time series particularly may comprise information regarding the arrival of photons or the temporal order of photons at a
detector. Then, the pixels of interest for the analysis will be determined. This process is carried out by use of known methods, such as e.g. threshold methods, in the sample image. Thereafter, there is performed the evaluation of the pixels of interest for which the analysis data comprising pixel information resolved into time series are already available. Thus, with the aid of the method of the disclosure, the time required for the taking of the data can be considerably reduced. Particularly, this has the
advantage that no time interval exists between the generating of the sample image and the detailed observation of individual pixels of interest, like—as described above—it was the case in the state of the art. The risk that, a wrong region is observed due to displacements within the sample occurring in the course of a
time difference, will thus be avoided. Also corruption of analysis data caused by other changes over time, as will inevitably occur in living cells, can be prevented. Thereby, the quality of the analysis data can be considerably improved.
[0014]The time segments per pixel within which the
individual analysis data are generated and registered, respectively, are preferably in the range of 100 ns to 10 ms, preferably 1 to 1000 μs, and more preferably in the range of 20 to 200 μs. The overall
acquisition time for capturing a time series per pixel is preferably in the range of 0.1 to 100 s. Preferably, the individual time segments for generating analysis data follow each other immediately. If desired, a slight interval may be provided between the time segments. In this interval, the measured data are transferred. According to a further preferred embodiment, the possibility is provided to discard individual time segments and not subject them to further analysis. Such discarded time segments can be time segments in which no photons or merely a very small number of photons arrive at the
detector. This preferred embodiment is useful particularly in the framework of the so-called burst integrated lifetime analysis. The embodiment further offers the
advantage of allowing a general reduction of data.
[0015]According to a particularly preferred embodiment, the determination of the pixels of interest for the analysis is carried out after the acquisition of data. This possibility exists because, according to the disclosure, analysis data are captured during the acquisition of a sample image. Said analysis data already comprise pixel information resolved into time series. Hence, all of the data required for the subsequent determination of the pixels of interest as well as for the subsequent evaluation of data are already available. Thus, advantageously, the determination of the pixels of interest, as well as the evaluation of data, can be decoupled in time from the
image acquisition. In this preferred embodiment, ample time will remain for determining the pixels of interest and this determination need not be performed in the shortest possible time for keeping a change of the sample as small as possible. Instead, the pixels of interest, such as e.g. the pixels of the
cell membrane, can be selected by use of methods which—although time-consuming—are highly precise. Also the subsequent evaluation of the generated analysis data per pixel of interest can be performed over a longer period of time. For the particularly preferred embodiment of the disclosure, it is thus essential that the determination of the pixels of interest is carried out temporally after the generation of the analysis data.
[0017]According to a further particularly preferred embodiment of the inventive method, there is carried out a determination of pixel types corresponding e.g. to specific subcellular structures. Such subcellular structures are e.g. the
cell membrane, the
cytoplasm or the
nucleus of a cell. The corresponding pixels in the sample image can be combined into pixel types or pixel groups or be assigned to such types or groups. This has the particular
advantage that the analysis data belonging to these pixel types or groups can be evaluated together. For instance, a fluctuation analysis can be performed under inclusion of all analysis data of the
cell membrane. This has the effect that the result of the analysis is considerably improved because local variations or measurement inaccuracies will cause merely slight changes of the analysis result.


