

Treatment, prevention, and reversal of alcohol-induced brain disease
- Summary
- Abstract
- Description
- Claims
- Application Information
AI Technical Summary
Benefits of technology
Problems solved by technology
Method used
Image

Examples
example 1
General Methods for Chronic Ethanol Exposure Adult Rat Model
[0090]Male (˜200 g) Long Evans rats (Charles River Laboratories, Cambridge, Mass.) were fed isocaloric liquid diets (BioServ, Frenchtown, N.J.) in which ethanol comprised 0% or 37% of the caloric content (9.25% v / v) for 6 weeks (Yeon et al., Hepatology 38:703 (2003)). A chow fed control group was also studied. Rats were monitored daily to ensure equivalent food consumption and maintenance of body weight. Upon sacrifice, the brains were harvested and either immersion fixed in Histochoice fixative (Amresco Corp., Solon, Ohio) for paraffin embedding, or sliced fresh to micro-dissect temporal cortex, hypothalamus, and cerebellum. The fresh tissue blocks were snap frozen in a dry ice-methanol bath and stored at −80° C. for mRNA and protein studies.
Histological Studies
[0091]Fixed brains were sectioned in the coronal plane along standardized landmarks and embedded in paraffin. Paraffin-embedded sections (8 μm thick) were stained w...
example 2
Chronic Ethanol Consumption Causes Neurodegeneration in Adult Rat Brains
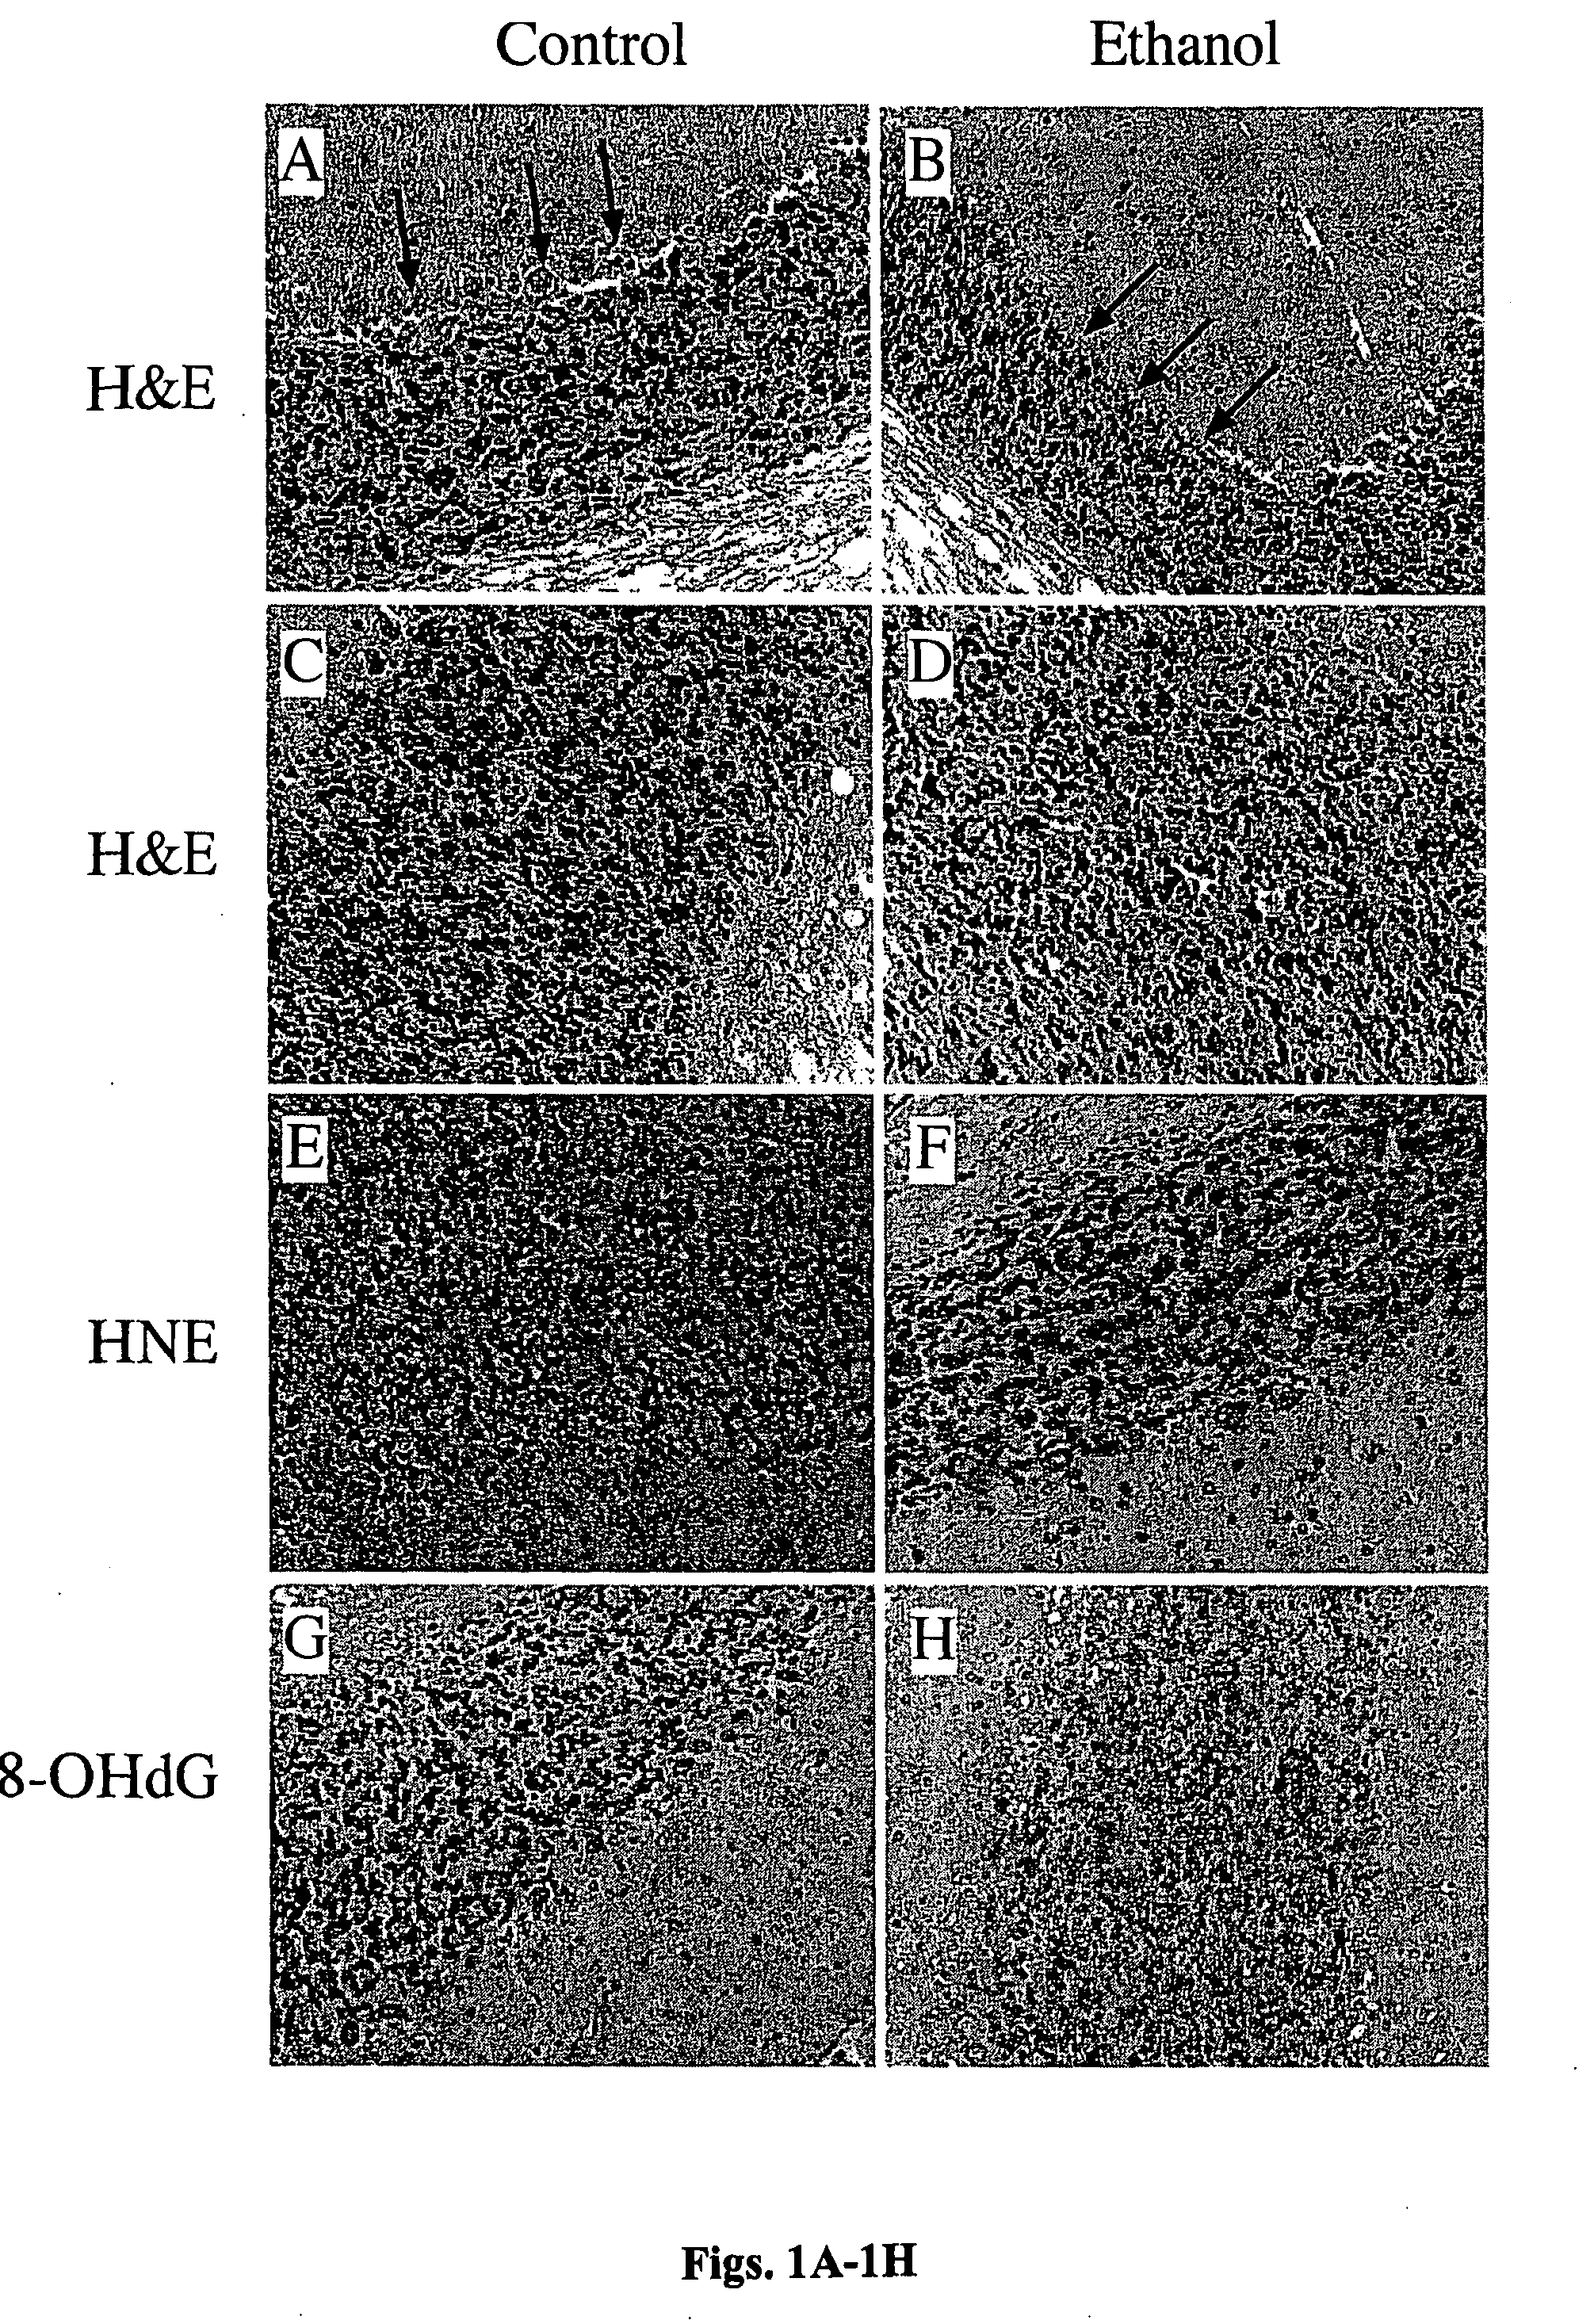
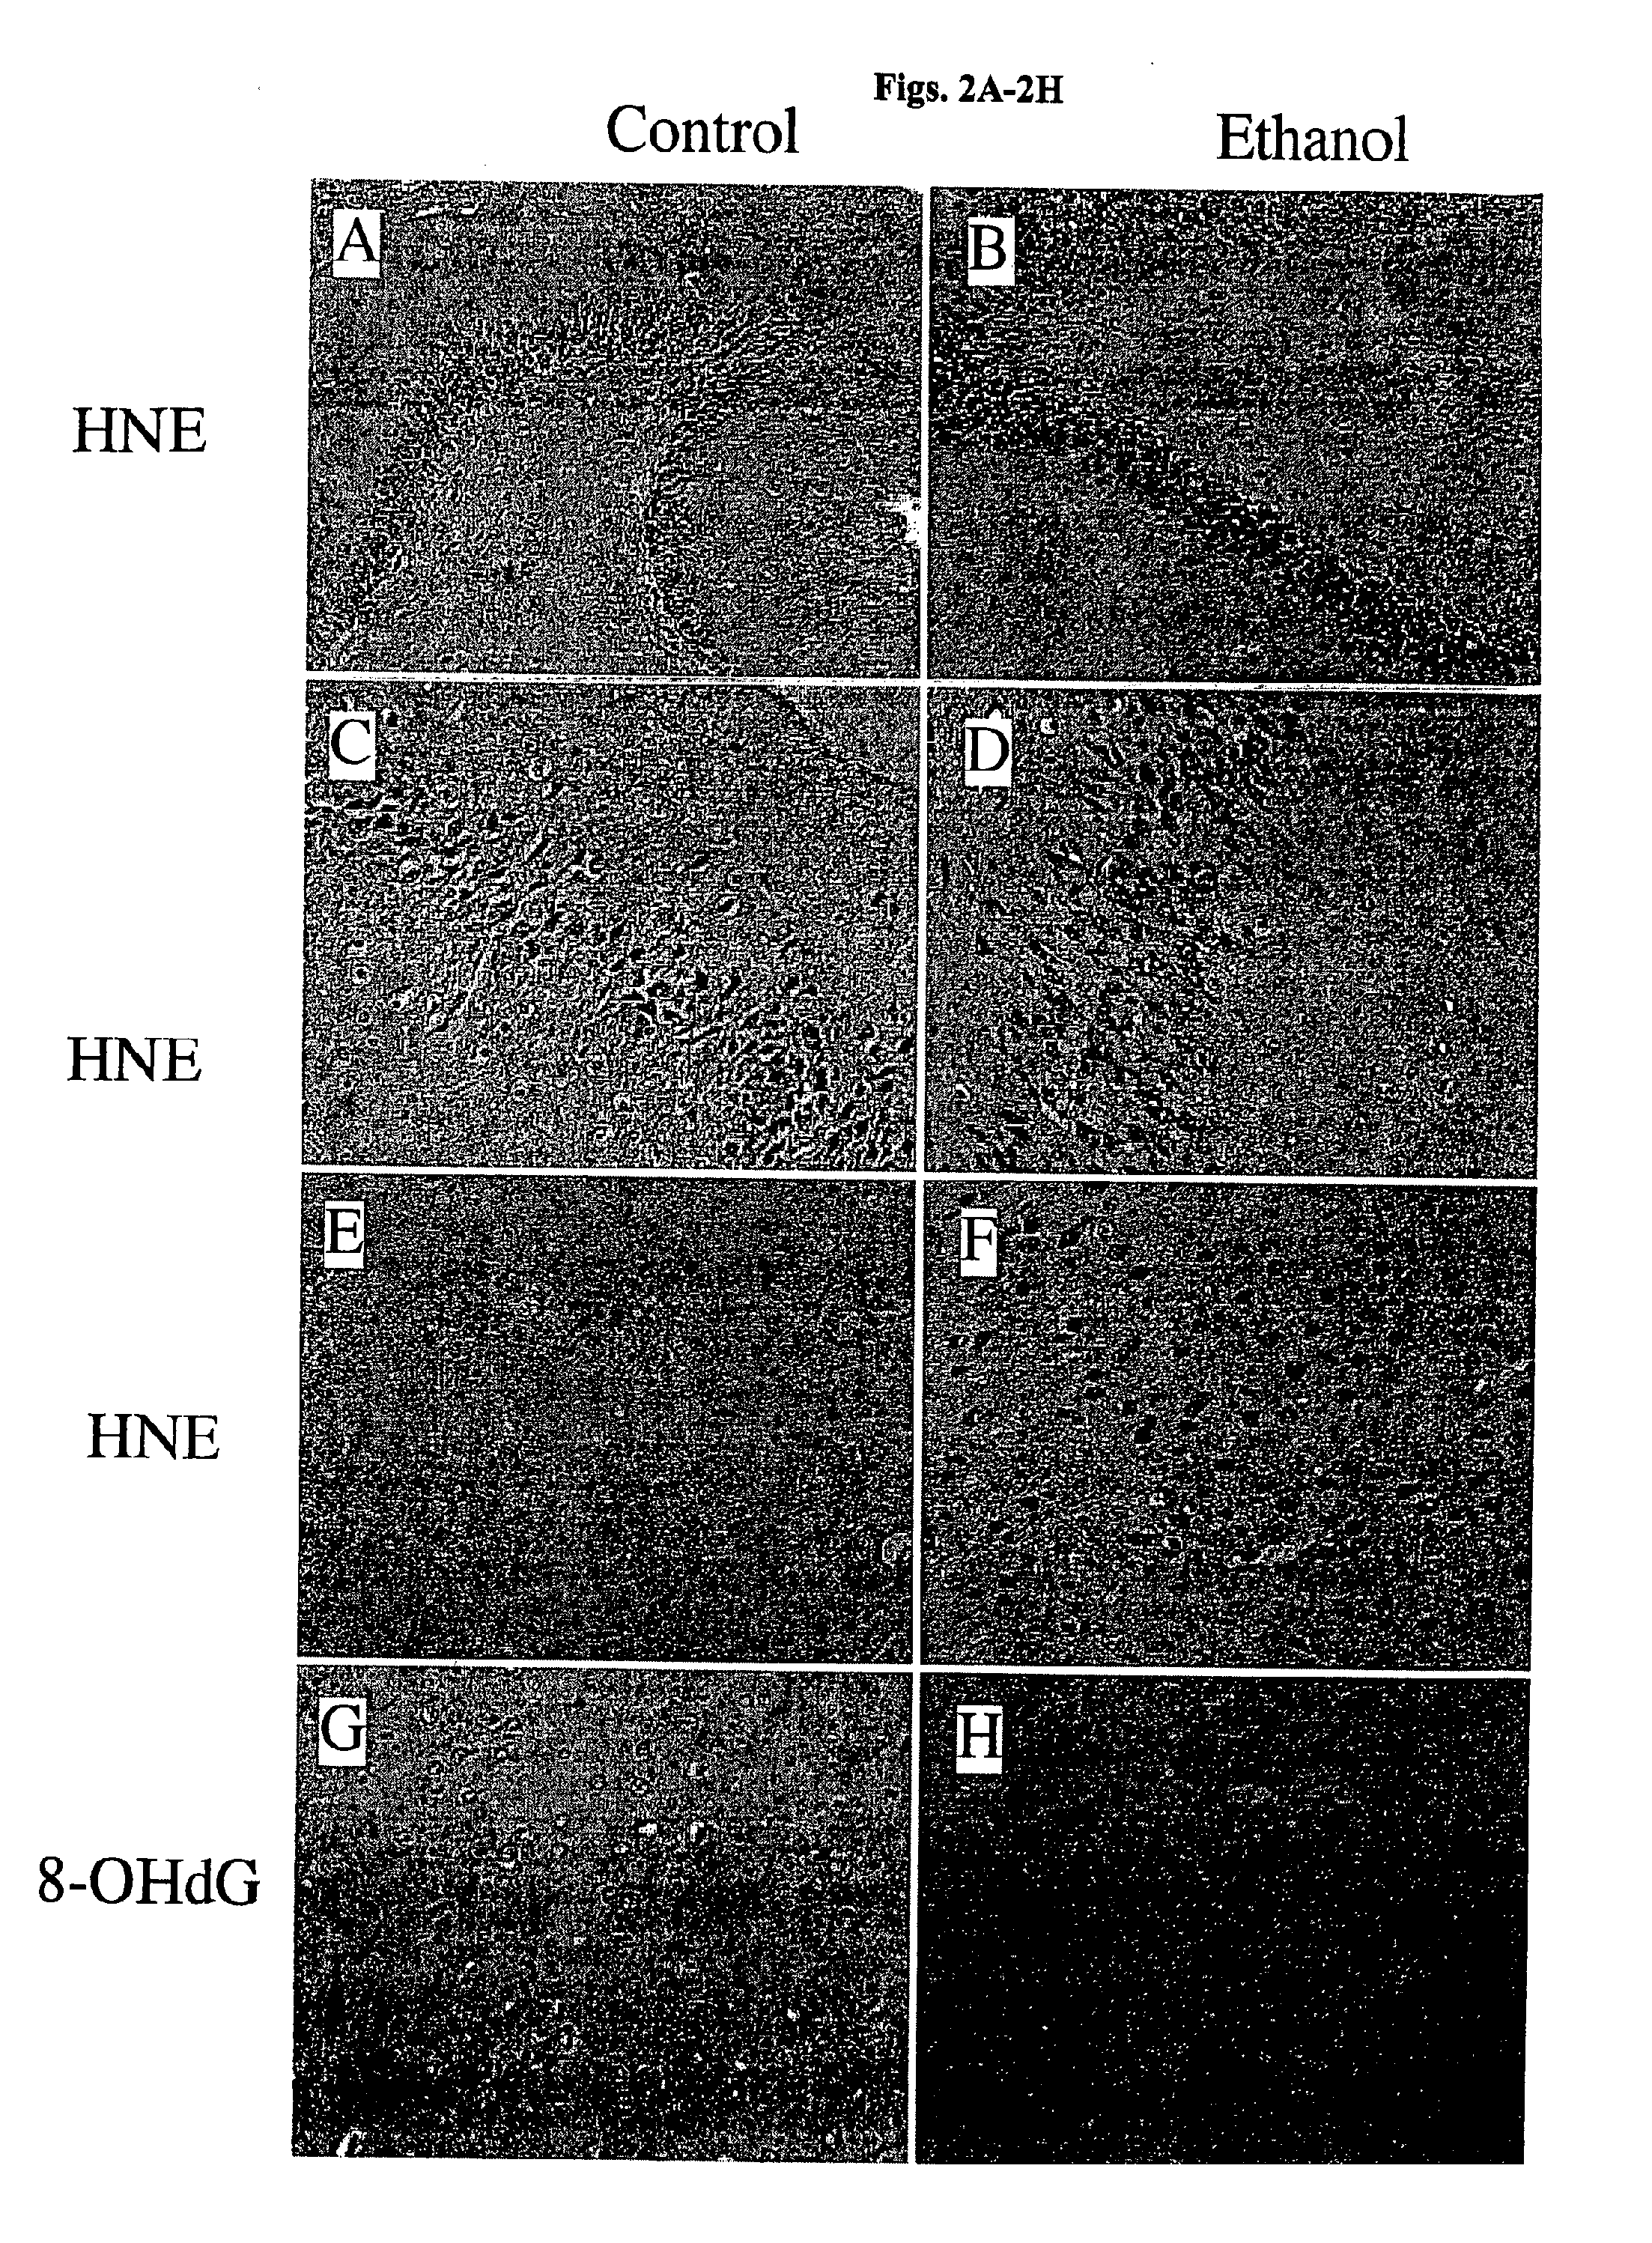
[0098]The histopathological studies were focused on the cerebellum and temporal lobe, including hippocampus because these structures represent known targets of ethanol-mediated neurotoxicity and they were evaluated using molecular and biochemical approaches. Hematoxylin and eosin stained sections of brain demonstrated structural abnormalities in the cerebellar cortex of ethanol-fed rats, including loss of Purkinje cells and reduced densities of cells within the internal granule layer (FIGS. 1A-1D). In contrast, the temporal lobes and hippocampi lacked distinct histopathological abnormalities including overt evidence of cell loss.
[0099]Immunohistochemical staining of adjacent sections revealed conspicuously increased cellular labeling for HNE, and to a lesser extent, 8-OHdG in brains of ethanol-fed rats. In cerebella of ethanol-exposed rats, increased HNE immunoreactivity, which reflects lipid peroxidation, was m...
example 3
Ethanol-Induced Pathological Shifts in Cell Type
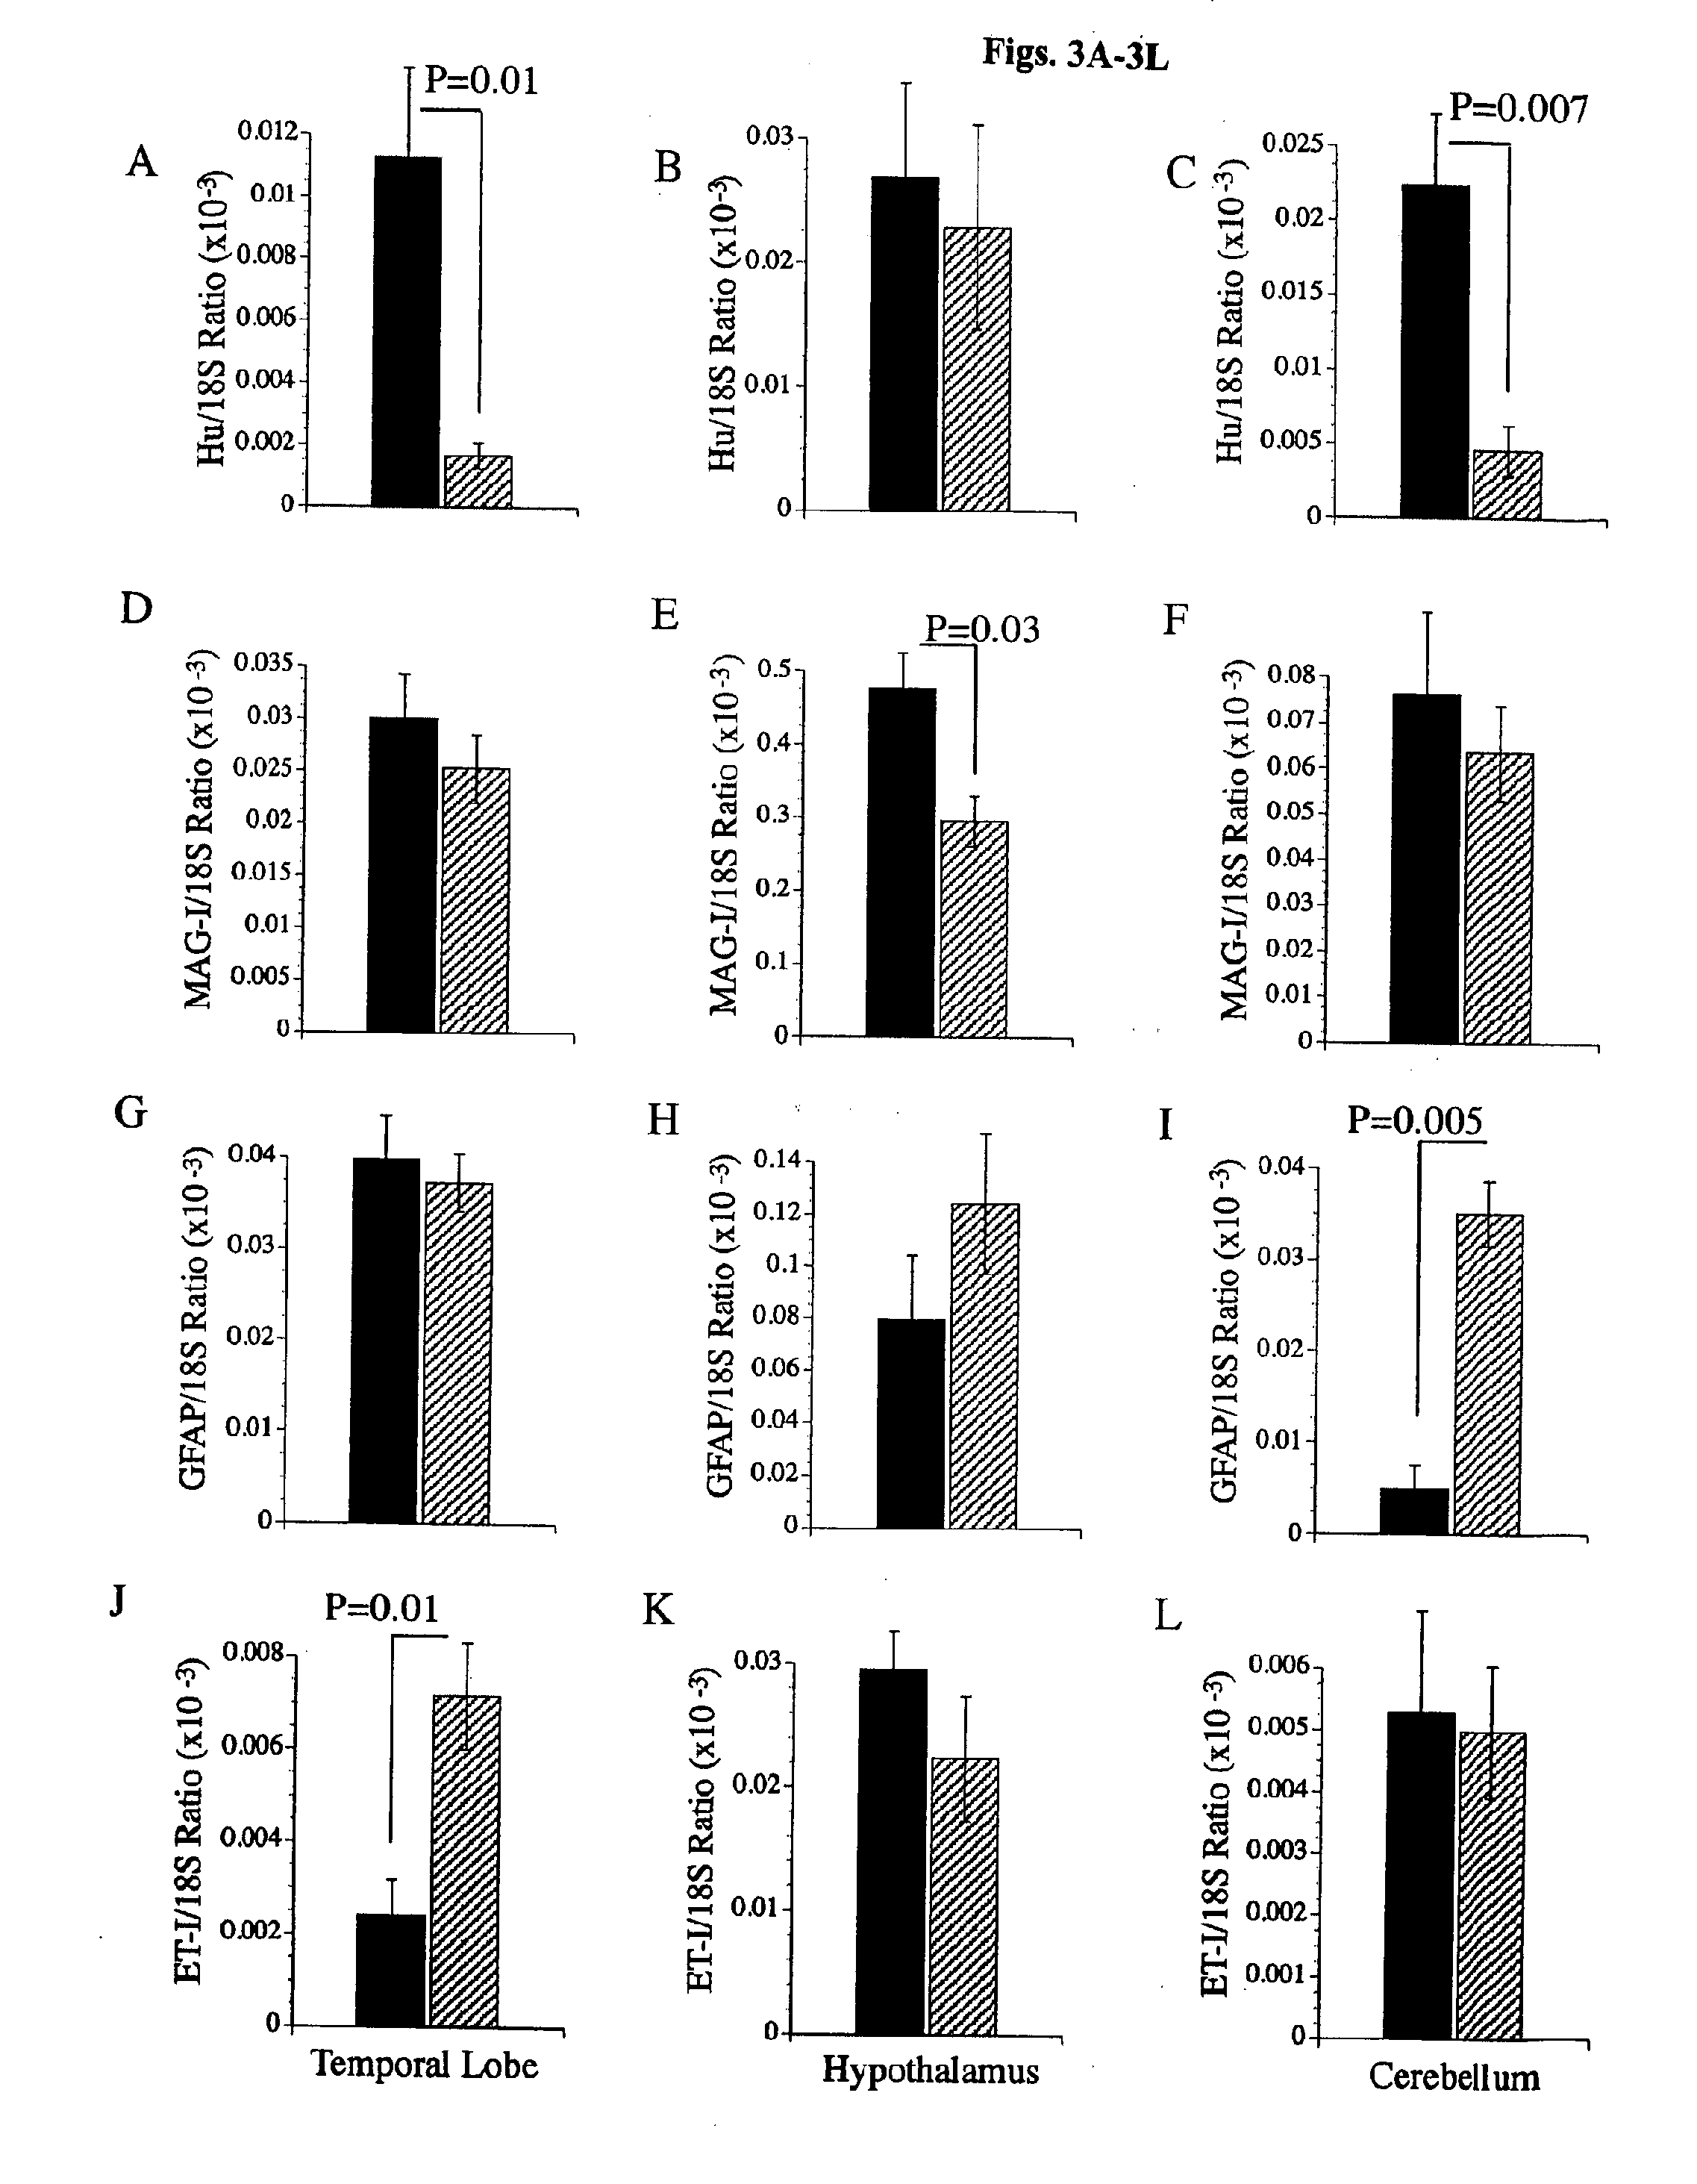
[0101]To determine if the chronic ethanol feeding caused pathological shifts in the cell populations within the temporal cortex, hypothalamus, and cerebellum, real time quantitative RT-PCR studies were used to measure mRNA transcripts encoding Hu neuronal ribosomal RNA binding protein (Datta et al., Cell 91:231 (1997); Hetman et al., J. Neurosci. 20:2567 (2000); Dudek et al., Science 275:661 (1997)), myelin-associated glycoprotein-1 (MAG-1) for oligodendroglia, glial fibrillary acidic protein (GFAP) for astrocytes, and endothelin-1 (ET-1) for endothelial cells. The ng quantities of each specific mRNA transcript detected were normalized to the 18S RNA levels measured in the same samples, and results from 9 animals per group were analyzed statistically. The studies demonstrated ethanol-associated reductions in Hu gene expression in the temporal lobe (FIG. 3A) and cerebellum (FIG. 3C), but not in the hypothalamus (FIG. 3B). MAG-1 expressi...
PUM
| Property | Measurement | Unit |
|---|---|---|
| Mass | aaaaa | aaaaa |
| Mass | aaaaa | aaaaa |
| Mass | aaaaa | aaaaa |
Abstract
Description
Claims
Application Information