
Network optimisation systems

Inactive Publication Date: 2010-05-06
INTERGENCE SYST
View PDF12 Cites 153 Cited by
  • Summary
  • Abstract
  • Description
  • Claims
  • Application Information

AI Technical Summary

Benefits of technology

[0016]The 3D representation of said network preferably uses 3D techniques to visualise networks, network device status / information and application flows in one, easy to understand visualisation. This benefits the user by allowing ease of interpretation and information gathering via a simple navigational interface. Information is intelligently displayed in a granular fashion employing information hiding techniques which ensure the user is not overwhelmed and can instead drill down to identify specific problem areas. This may allow a user to optimise the network or alternatively, there may be an optimisation module which automatically optimises the network based on the representation created.
[0018]The tool may further comprise a translation layer connecting said data integration server and said data visualisation client; said translation layer being operable to process data received from said data integration server to define said 3D representation of said network. The translation layer may also be connected to said user interface whereby a user is able to specify the data to be displayed. A message queue may also be used in the connection between said data integration server and said data visualisation client to manage the large flow of data between the two systems.
[0020]Said 3D representation of each said network device may be assigned a colour to represent its temperature and / or its usage. In this way, high / low temperature or under or over utilisation may be flagged easily to a user to enable optimisation. Said data visualisation client may be configured to replay an optimisation of captured data from said network in faster than real time. Such replay may include the various colour depictions. Said data visualisation client may also be configured to depict a communication path of an application operating over said network whereby the 3D computer network optimisation tool is usable for optimisation of network routing
[0021]Said user interface may comprise a multi-touch user interface for manipulating said 3D representation of said network, said multi-touch user interface enabling a user of a touch screen displaying said 3D representation, by simultaneously touching said touch screen in two or more different places, to perform one or more of translation, scaling and rotation of said 3D representation of said network to optimise the performance of the network.
[0022]The term network encompasses many forms of networks, including computer networks comprising routers, servers, etc. The network may also be a data centre network. The optimisation of the data centre network may to related to any or all of the following lowering energy costs, resolving energy-related issues (which may create outages), deploying industry standards and best industry practice and providing options for power savings associated with future expansion. The network may be also be an information network and optimisation may be of information security. The optimisation may balance security against productivity and / or may optimise virtual environments.
[0042]Multi Touch screen for troubleshooting and capacity management: Using multi-touch screen technology the 3D map is able to be manipulated in a way that enhances troubleshooting, capacity management and network design.

Problems solved by technology

Businesses that can not guarantee effective IT service delivery are quickly exposed to their shareholders and competitors.
As businesses rely increasingly on their network infrastructure to carry all types of critical applications, voice video and data, their planning and operation has become increasingly complex
This approach is acceptable for small and simple networks, but larger organisations with multiple users, locations and critical applications require very complex planning, change management and operational procedures.
Attempting to visualise this is extremely difficult.
Moreover, when problems appear the complexity can very often lead to the wrong behaviour being applied, which in turn inadvertently exacerbates the problem.
User intervention on a gamble then makes the situation worse or can lead to catastrophic chain of events.
Many network operators also experience this feeling of panic and helplessness as network alarms sound during a problem and there are huge pressures to restore business connectivity
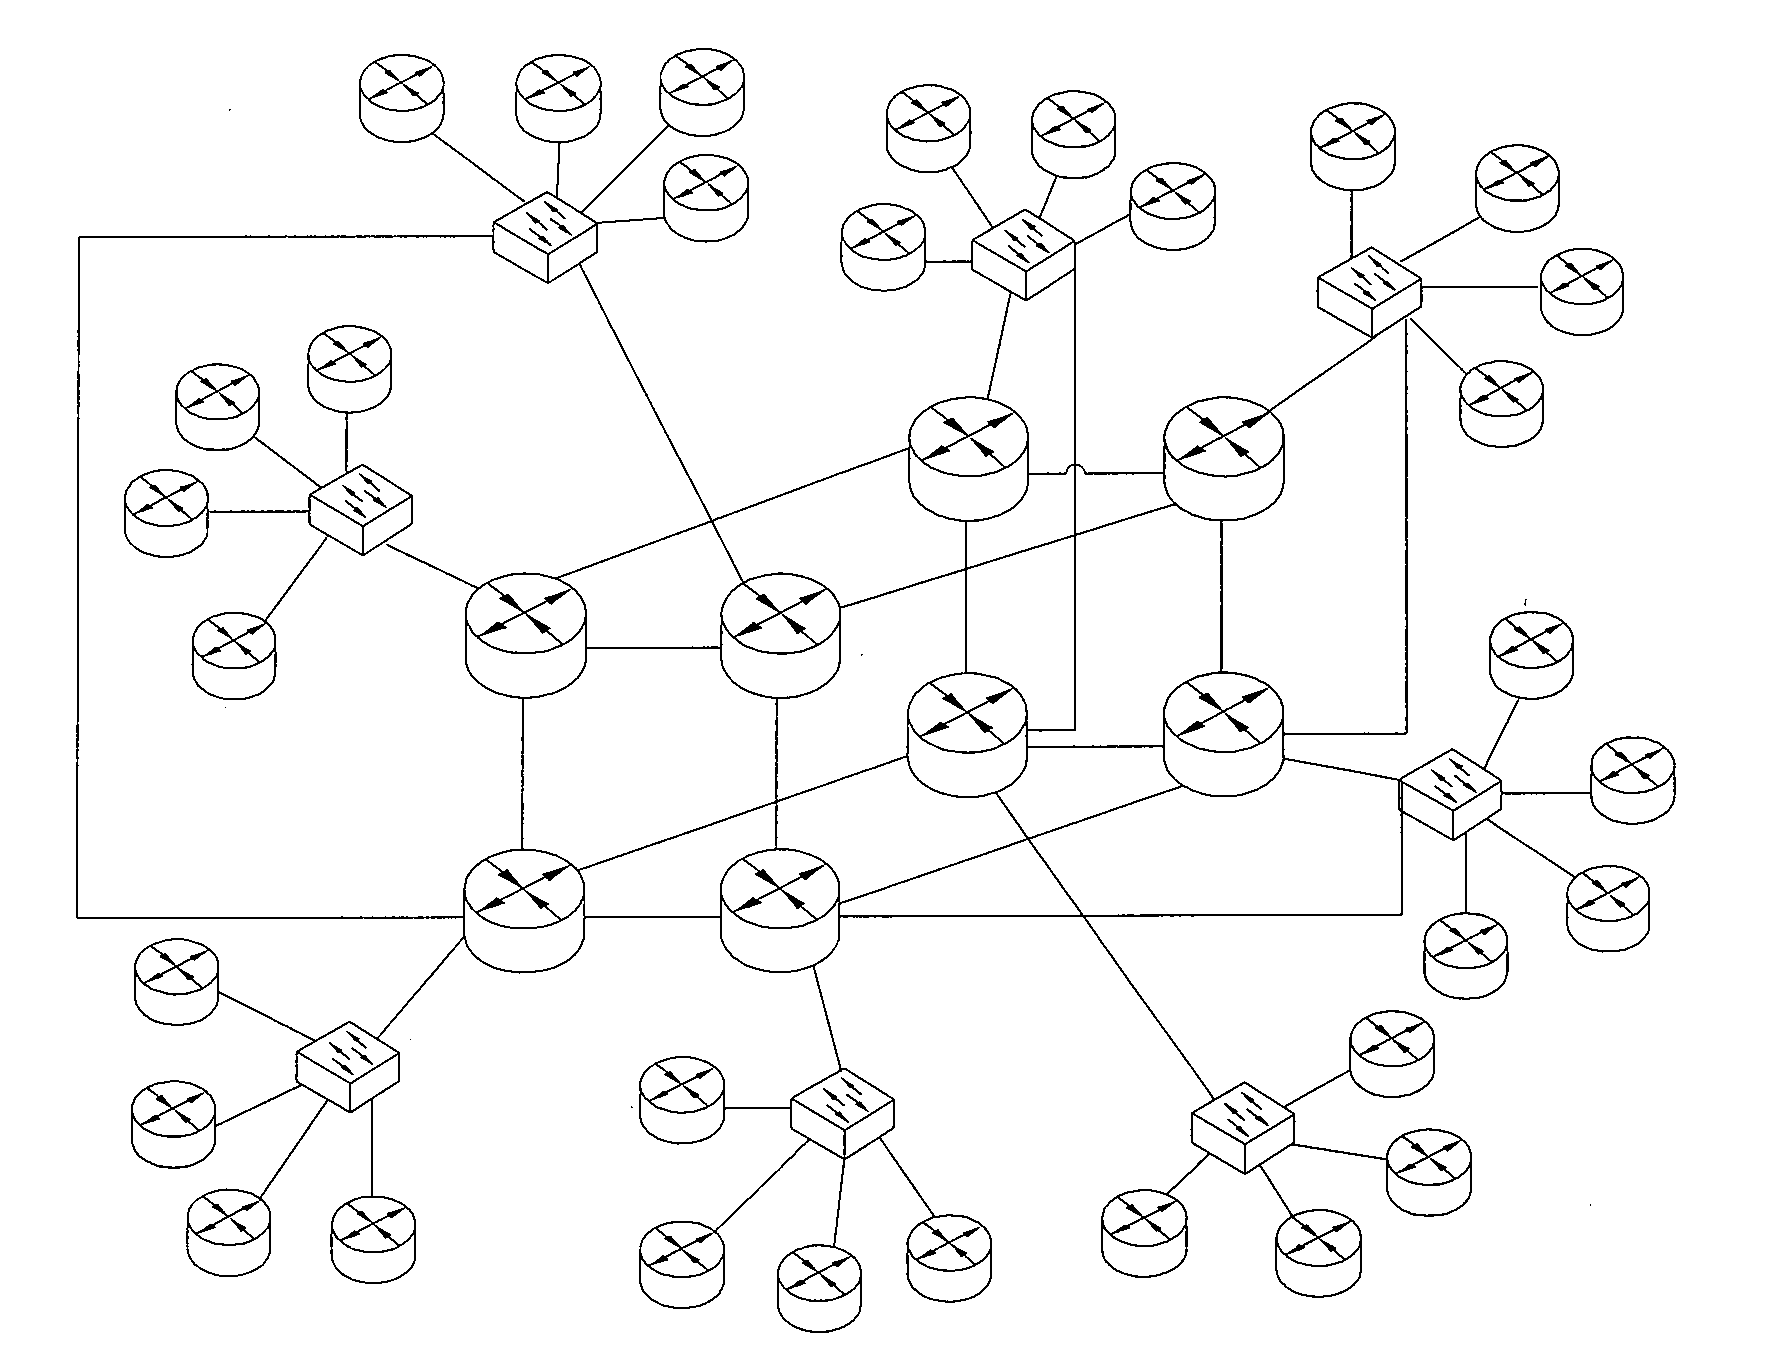
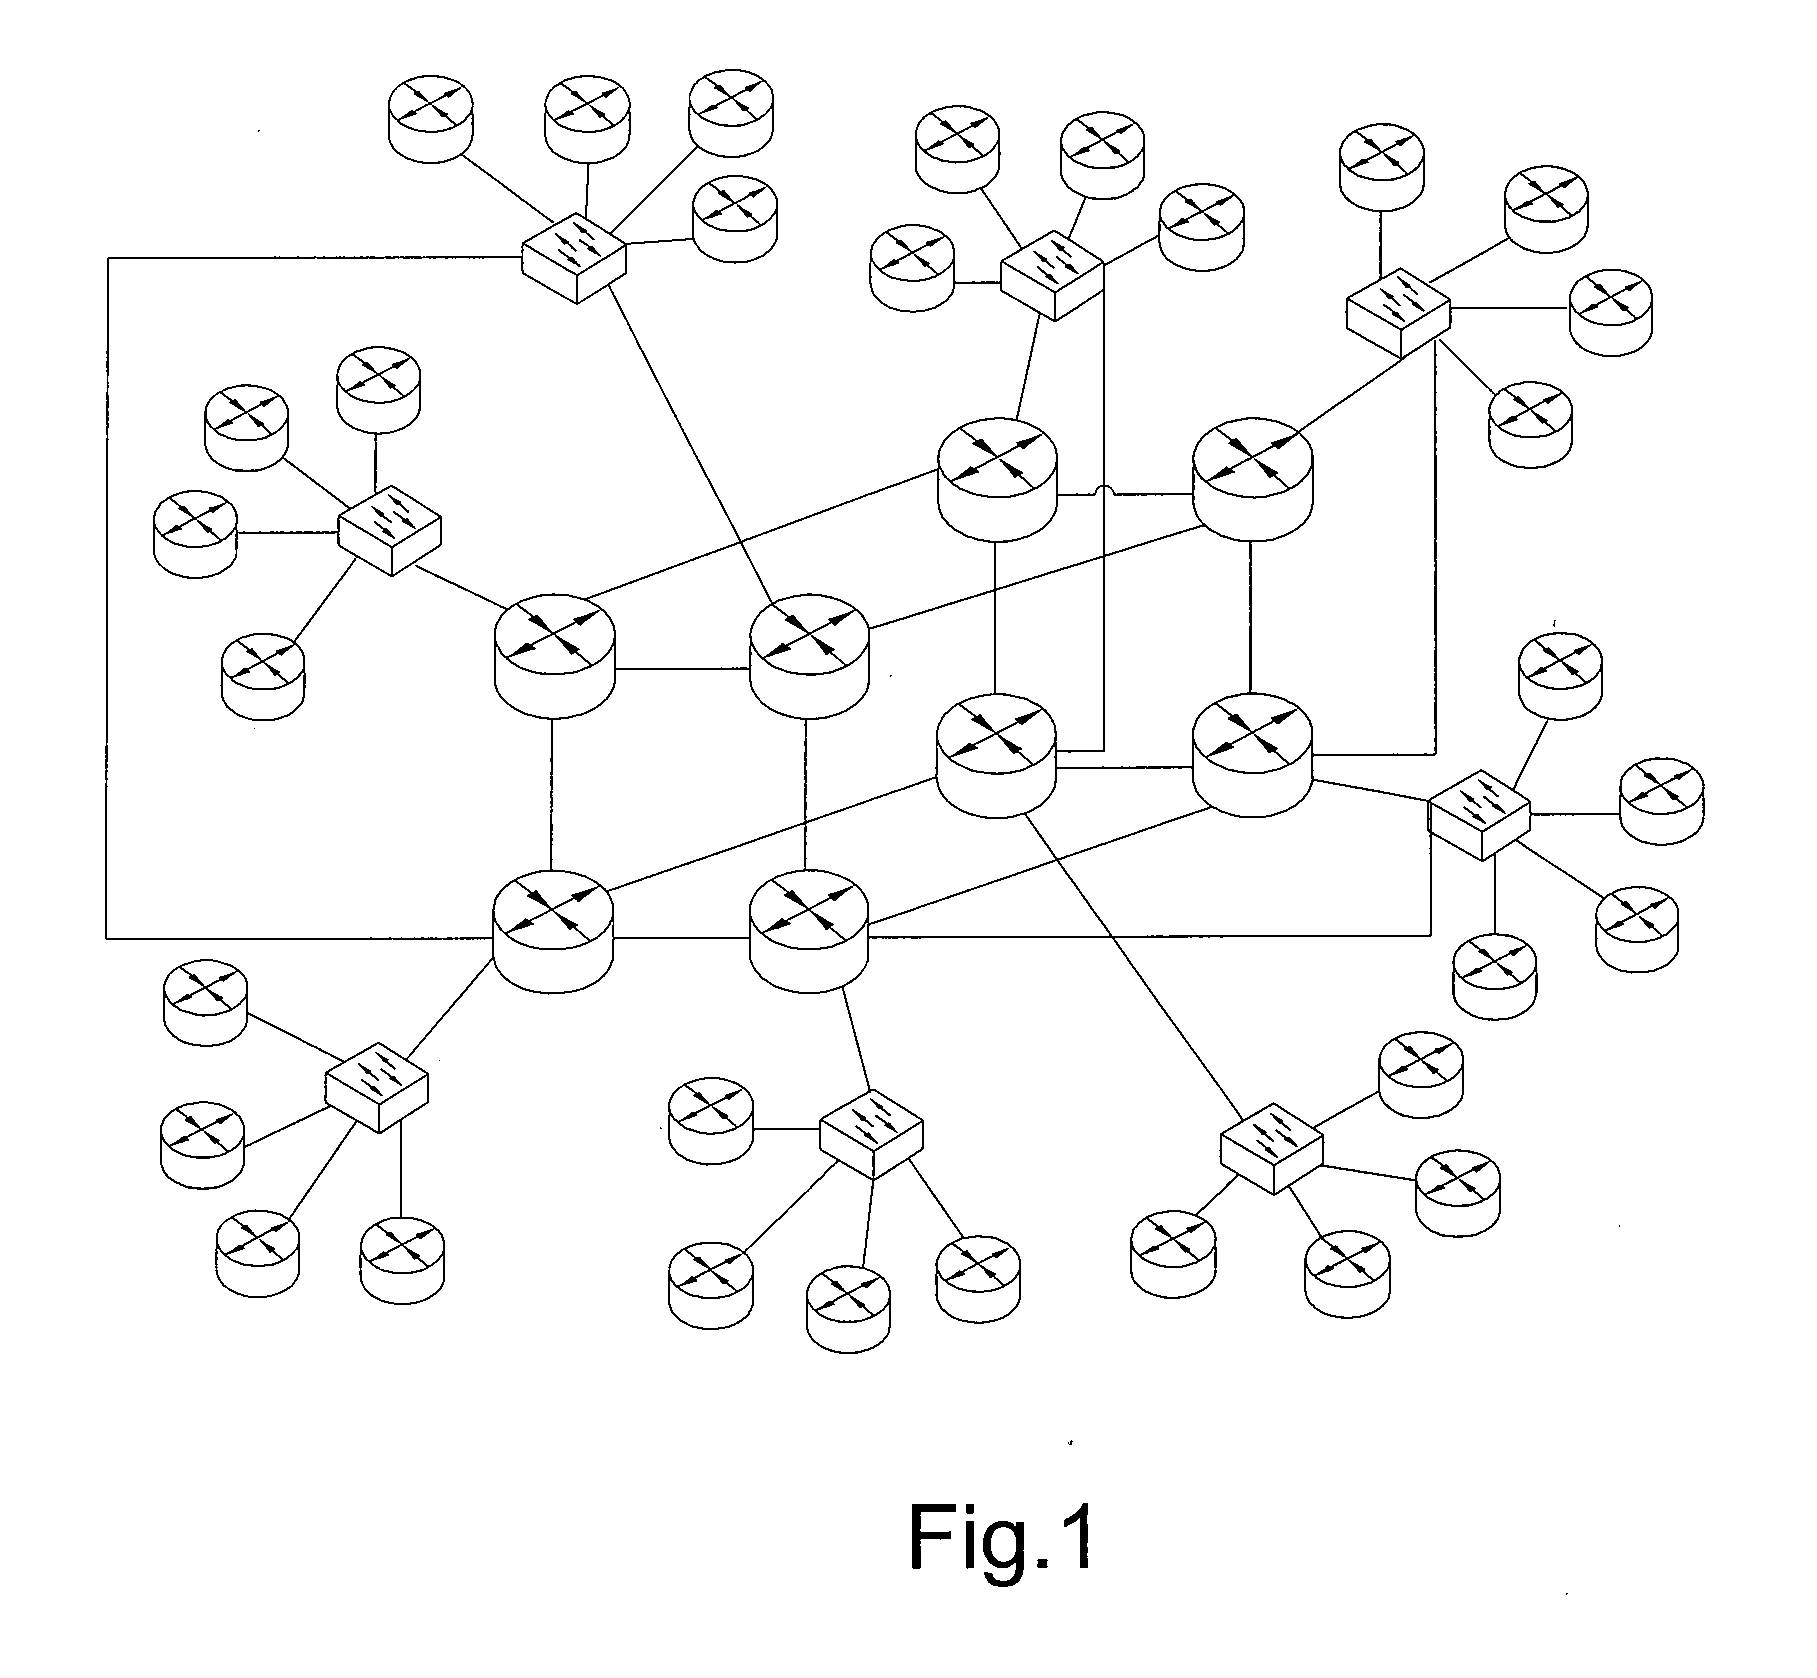
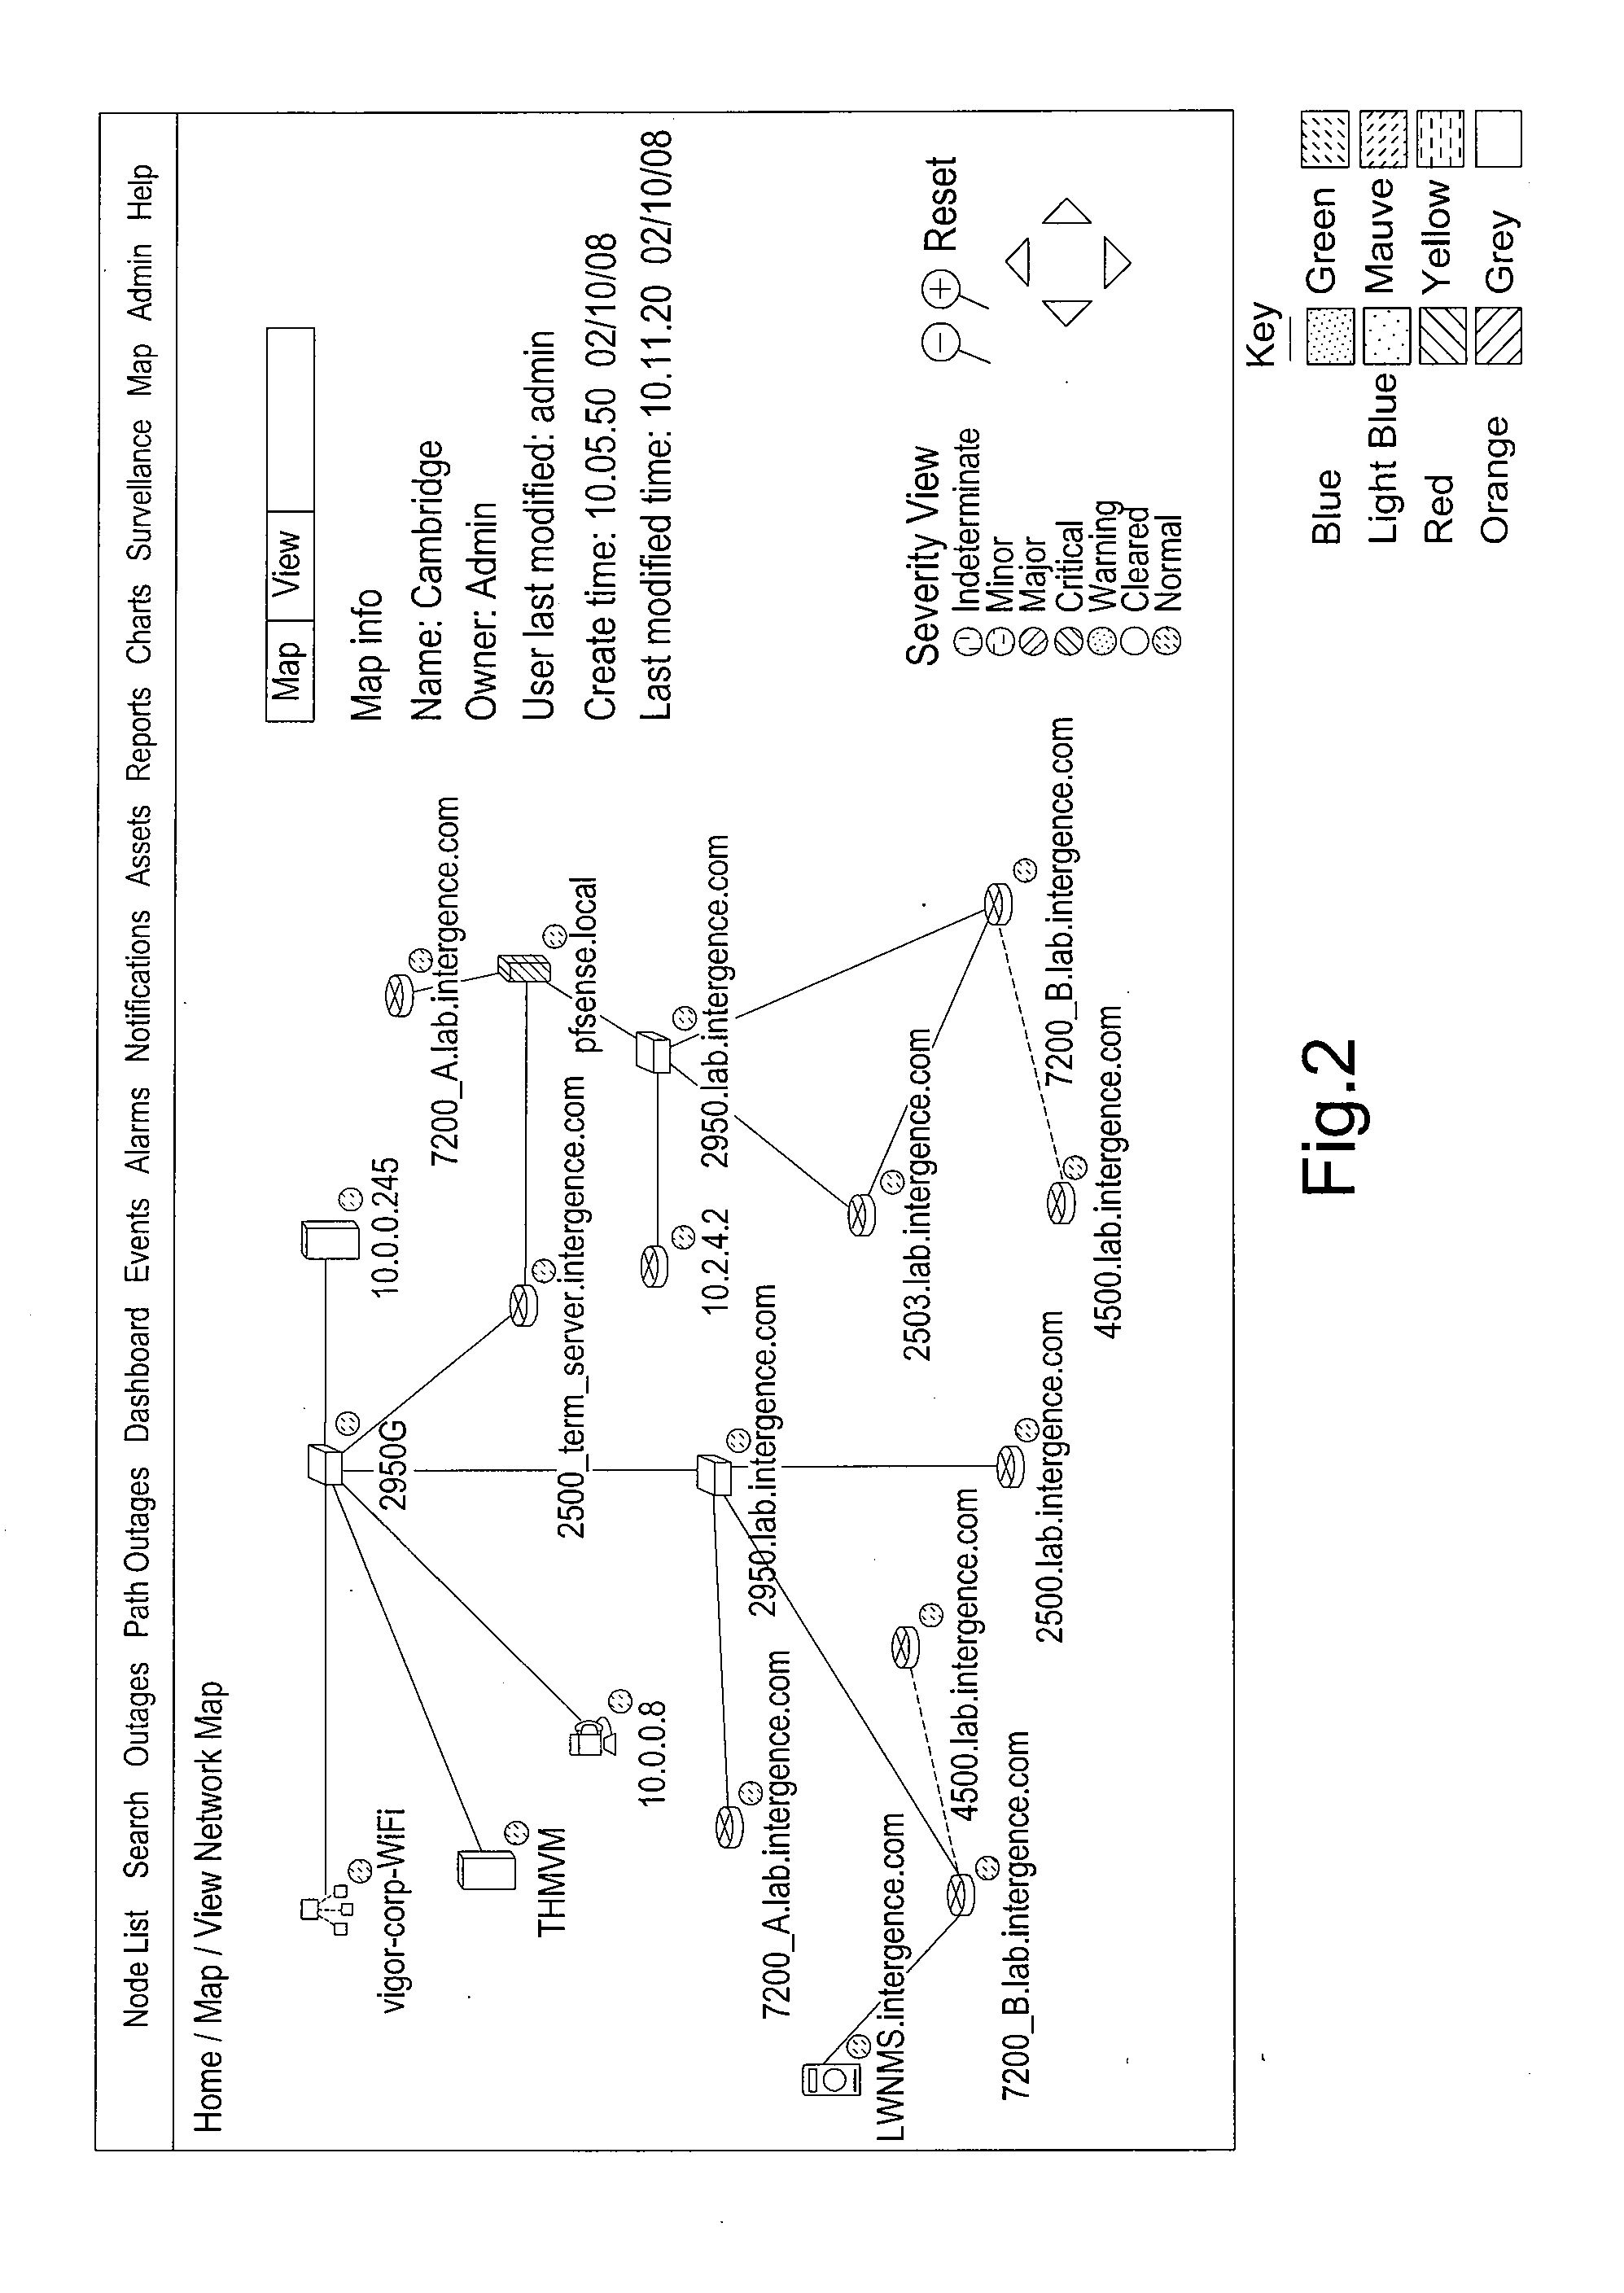
Currently all network diagrams are represented in 2D so problem solving and planning is difficult to perceive.
Users and administrators can feel overwhelmed by the sheer amount of data that requires interpretation and analysis sometimes under very tight deadlines.
It can be difficult to pinpoint specific problems in the network because the user may have to wade through screens of data before getting to the relevant information.
Navigating around large networks (eg 100+ or 100+ devices) can be very difficult using conventional approaches.

Method used


Image

  • Network optimisation systems
  • Network optimisation systems
  • Network optimisation systems

Examples


Embodiment Construction

[0073]Referring to FIG. 4, broadly speaking we should preferably describe technologies and methods to gain detailed network knowledge and visualise the network in real time to give the network manager and support personnel an excellent understanding of current and future conditions. The system (Intergence Software Suite, ISS) does this by interrogating the network, storing the data in a central repository and then mining this data to enable reports, 2D visualisation and 3D visualisation. ISS has 5 potentially separate modules: Central database 30, Appliances 32, Reporting engine 34, Automatic Microsoft Visio diagram creator 36 and 3D visualisation 38.

[0074]FIG. 5 provides an insight as to how the 3D representation of a network would work with different 3D objects representing different devices present in the network such as firewalls, routers and switches. Animation and coloured textures are applied to the objects to show the current status of that particular device. For example, a ...


PUM


Abstract

We describe a 3D computer network optimisation tool using network management data including one or more of: network device data including hardware identification data, interface data characterising one or more interfaces of a said network device, firmware identification data for a said network device, operating system identification data for a said network device; information flow data relating to information flow within the network including network device information flow load data and link bandwidth data / statistical information flow data; as well as environmental data for a network device such as temperature or power consumption data and / or physical network device location data. The tool also uses captured network data and sniffer data from communication links; and connectivity of the network devices. A three-dimensional (3D) visualisation module constructs a 3D representation of said network including 3D representations of said network devices in conjunction with a representation of said connectivity in three dimensions.

Description

CROSS-REFERENCE TO RELATED APPLICATIONS[0001]This application claims priority to U.S. Provisional Application No. 61 / 110,128 entitled “NETWORK OPTIMISATION SYSTEMS” which was filed on Oct. 31, 2008, and also claims priority to Great Britain Application No. GB0819985.3 entitled “NETWORK OPTIMISATION SYSTEMS” also filed on Oct. 31, 2008, both of which are incorporated herein by reference.FIELD OF THE INVENTION[0002]This invention relates to apparatus, methods and computer program code for optimising, mapping, monitoring, visualising, and / or managing computer networks, in embodiments including automatically recording changes to a network.BACKGROUND TO THE INVENTION[0003]Businesses increasingly rely upon effective IT infrastructure and applications. Profitability and competitiveness demand IT services are secure, fast and continually available. Businesses that can not guarantee effective IT service delivery are quickly exposed to their shareholders and competitors.[0004]The investments ...

Claims


Application Information

Patent Timeline
IPC IPC(8): H04L12/28
CPCH04L41/12H04L41/22
Inventor DORAN, CHRISTOPHER JOHN LESLIEHIPPERSON, STACE
Owner INTERGENCE SYST
Learn More