Histogram-based analysis method for the detection and diagnosis of neurodegenerative diseases

a neurodegenerative disease and analysis method technology, applied in the field of humanistogram-based analysis method for the detection and diagnosis of neurodegenerative diseases, can solve the problems of mixed dementia traditionally very difficult to diagnose, affecting behavior, and unknown time of onset in living subjects

Inactive Publication Date: 2010-06-10
AVID RADIOPHARMACEUTICALS
View PDF21 Cites 23 Cited by
  • Summary
  • Abstract
  • Description
  • Claims
  • Application Information

AI Technical Summary

Benefits of technology

[0018]In yet another aspect of the invention, a method is provided for predicting the relative risk for future development of a dementia such as, for example, Alzheimer's disease (AD), Dementia with Lewy Bodies (DLB), or Vascular dementia (VaD) in a subject, where the method comprises administering to the subject one or more radiopharmaceuticals that bind to aggregates of β-amyloid, α-synuclein, tau protein or micro-thrombi in the subject's brain, obtaining image data of the subject's brain, generating an intensity versus frequency histogram from volume elements of the image data, and evaluating at least one of shape, area, peak value and other graphi...

Problems solved by technology

AD has been reported in patients as young as 40-50 years of age, but because the presence of the disease is difficult to detect without histopathological examination of brain tissue, the time of onset in living subjects is unknown.
Because ...

Method used


Image

  • Histogram-based analysis method for the detection and diagnosis of neurodegenerative diseases
  • Histogram-based analysis method for the detection and diagnosis of neurodegenerative diseases
  • Histogram-based analysis method for the detection and diagnosis of neurodegenerative diseases

Examples


example 1

Evaluation of PET Image Histograms for the Differentiation or Diagnosis of Subjects with Alzheimer's Disease Pathology versus Normal Control Subjects

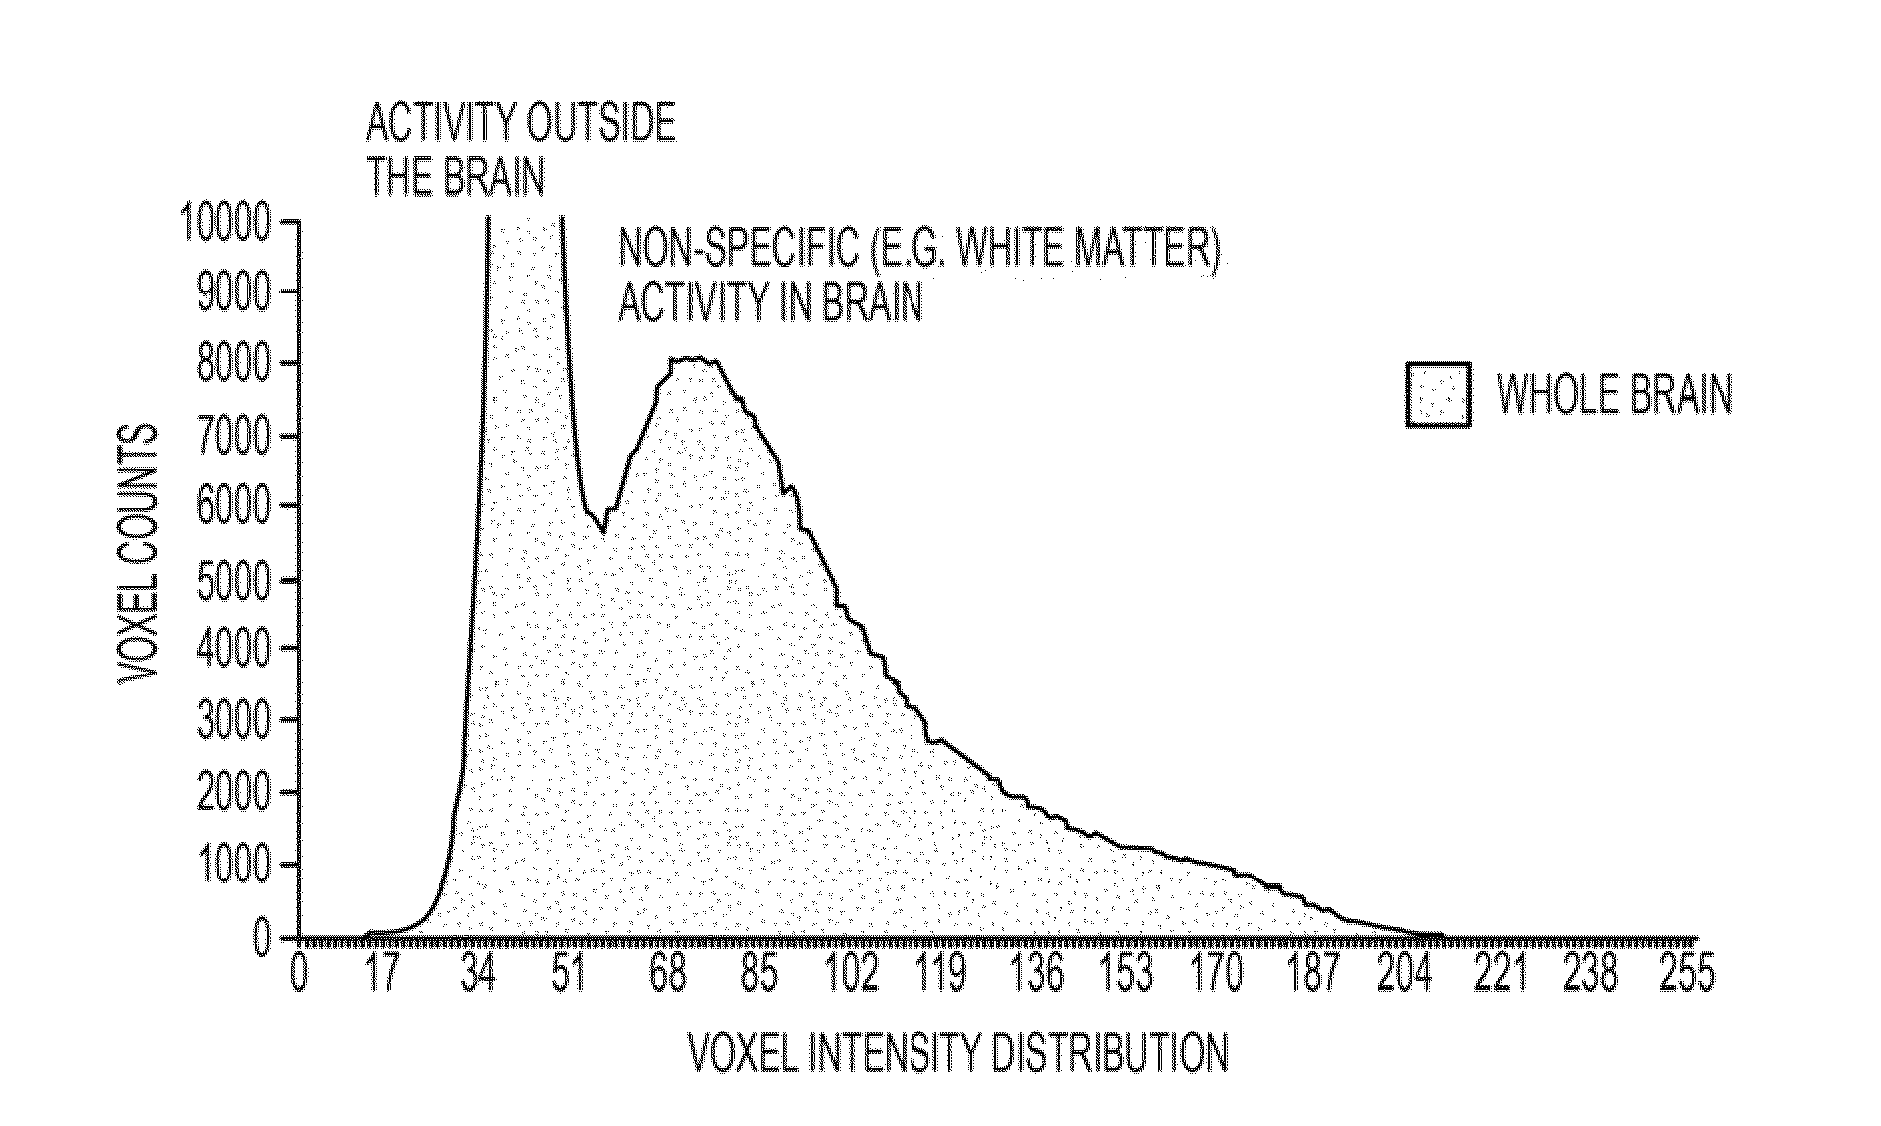
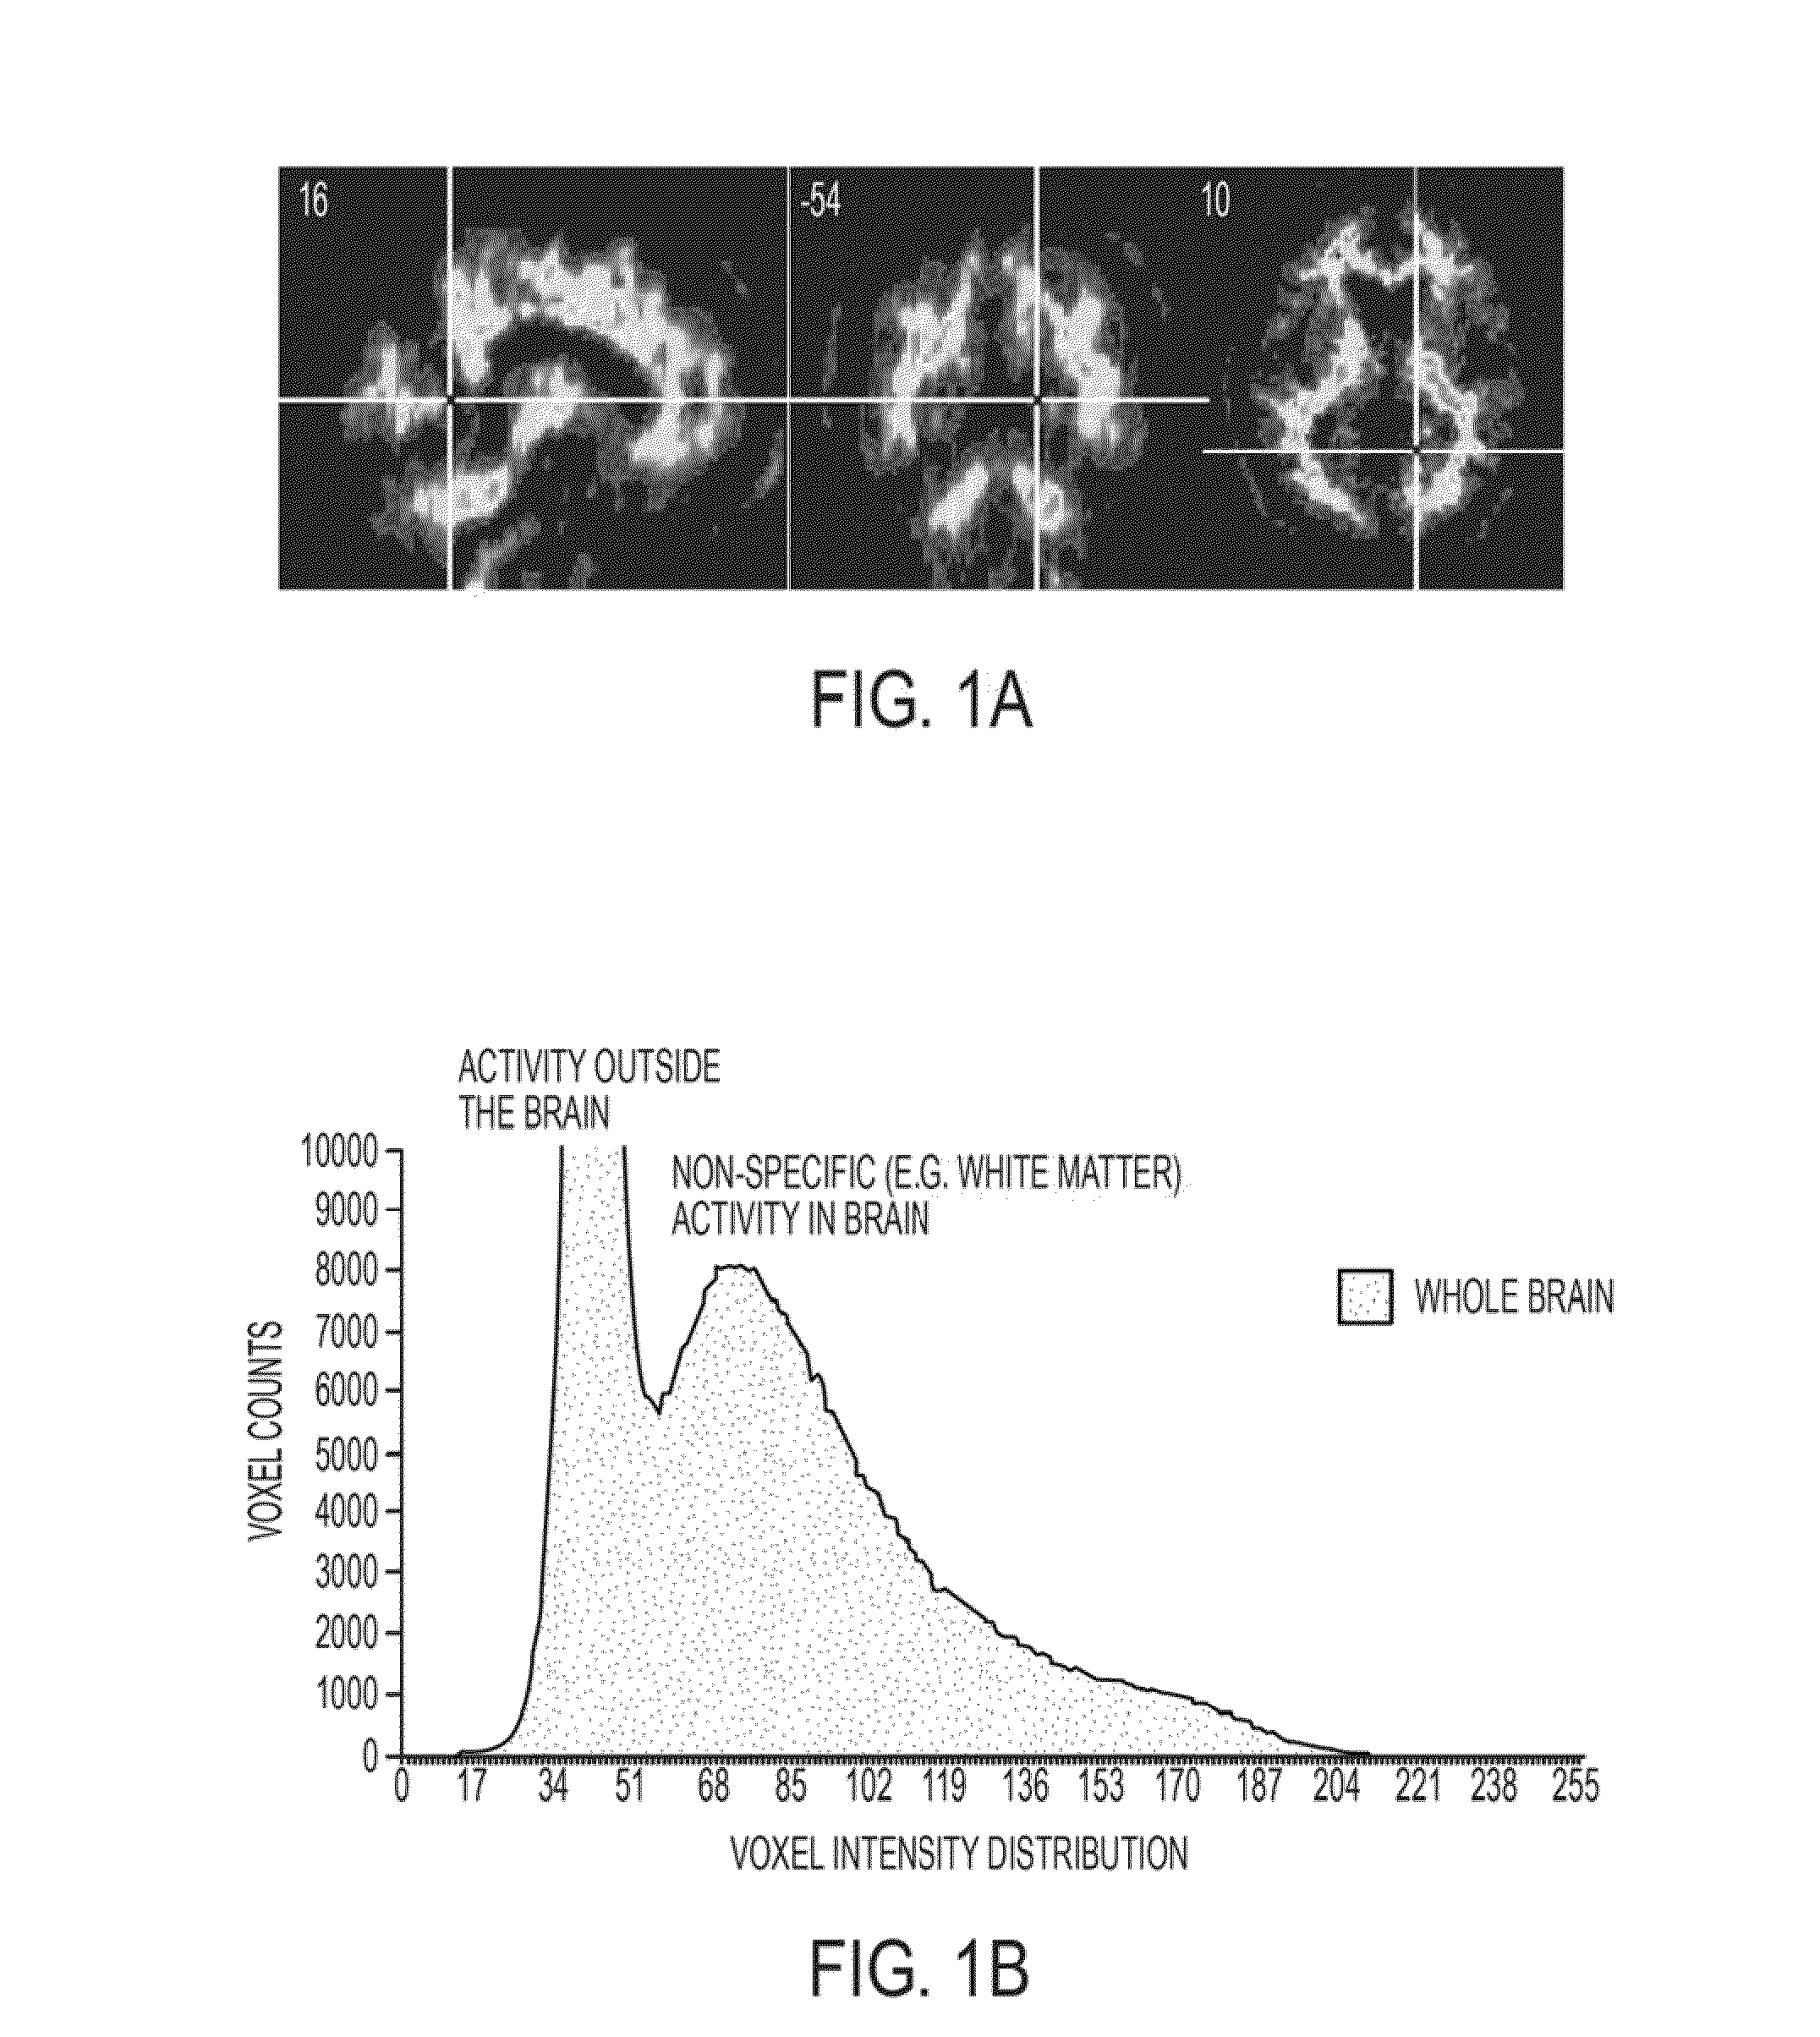
[0080]The histogram and histogram data were generated using the MRIcroN histogram application. The MRIcroN program was applied to selected PET scan images to determine the number of voxels (bin count on the y-axis) at a given voxel (or pixel) intensity value (x-axis) for each scan. A histogram was generated for each PET scan wherein the intensity level (on the x-axis) corresponds to the concentration of amyloid plaque (represented by radioactivity present in a given voxel). Pixel / voxel intensities ranged from 0-256 (28) for gray scaled images. For example, if a histogram displayed a value of 3000 on the y-axis for a value of 130 on the x-axis it was concluded that 3000 voxels had an intensity of 130.

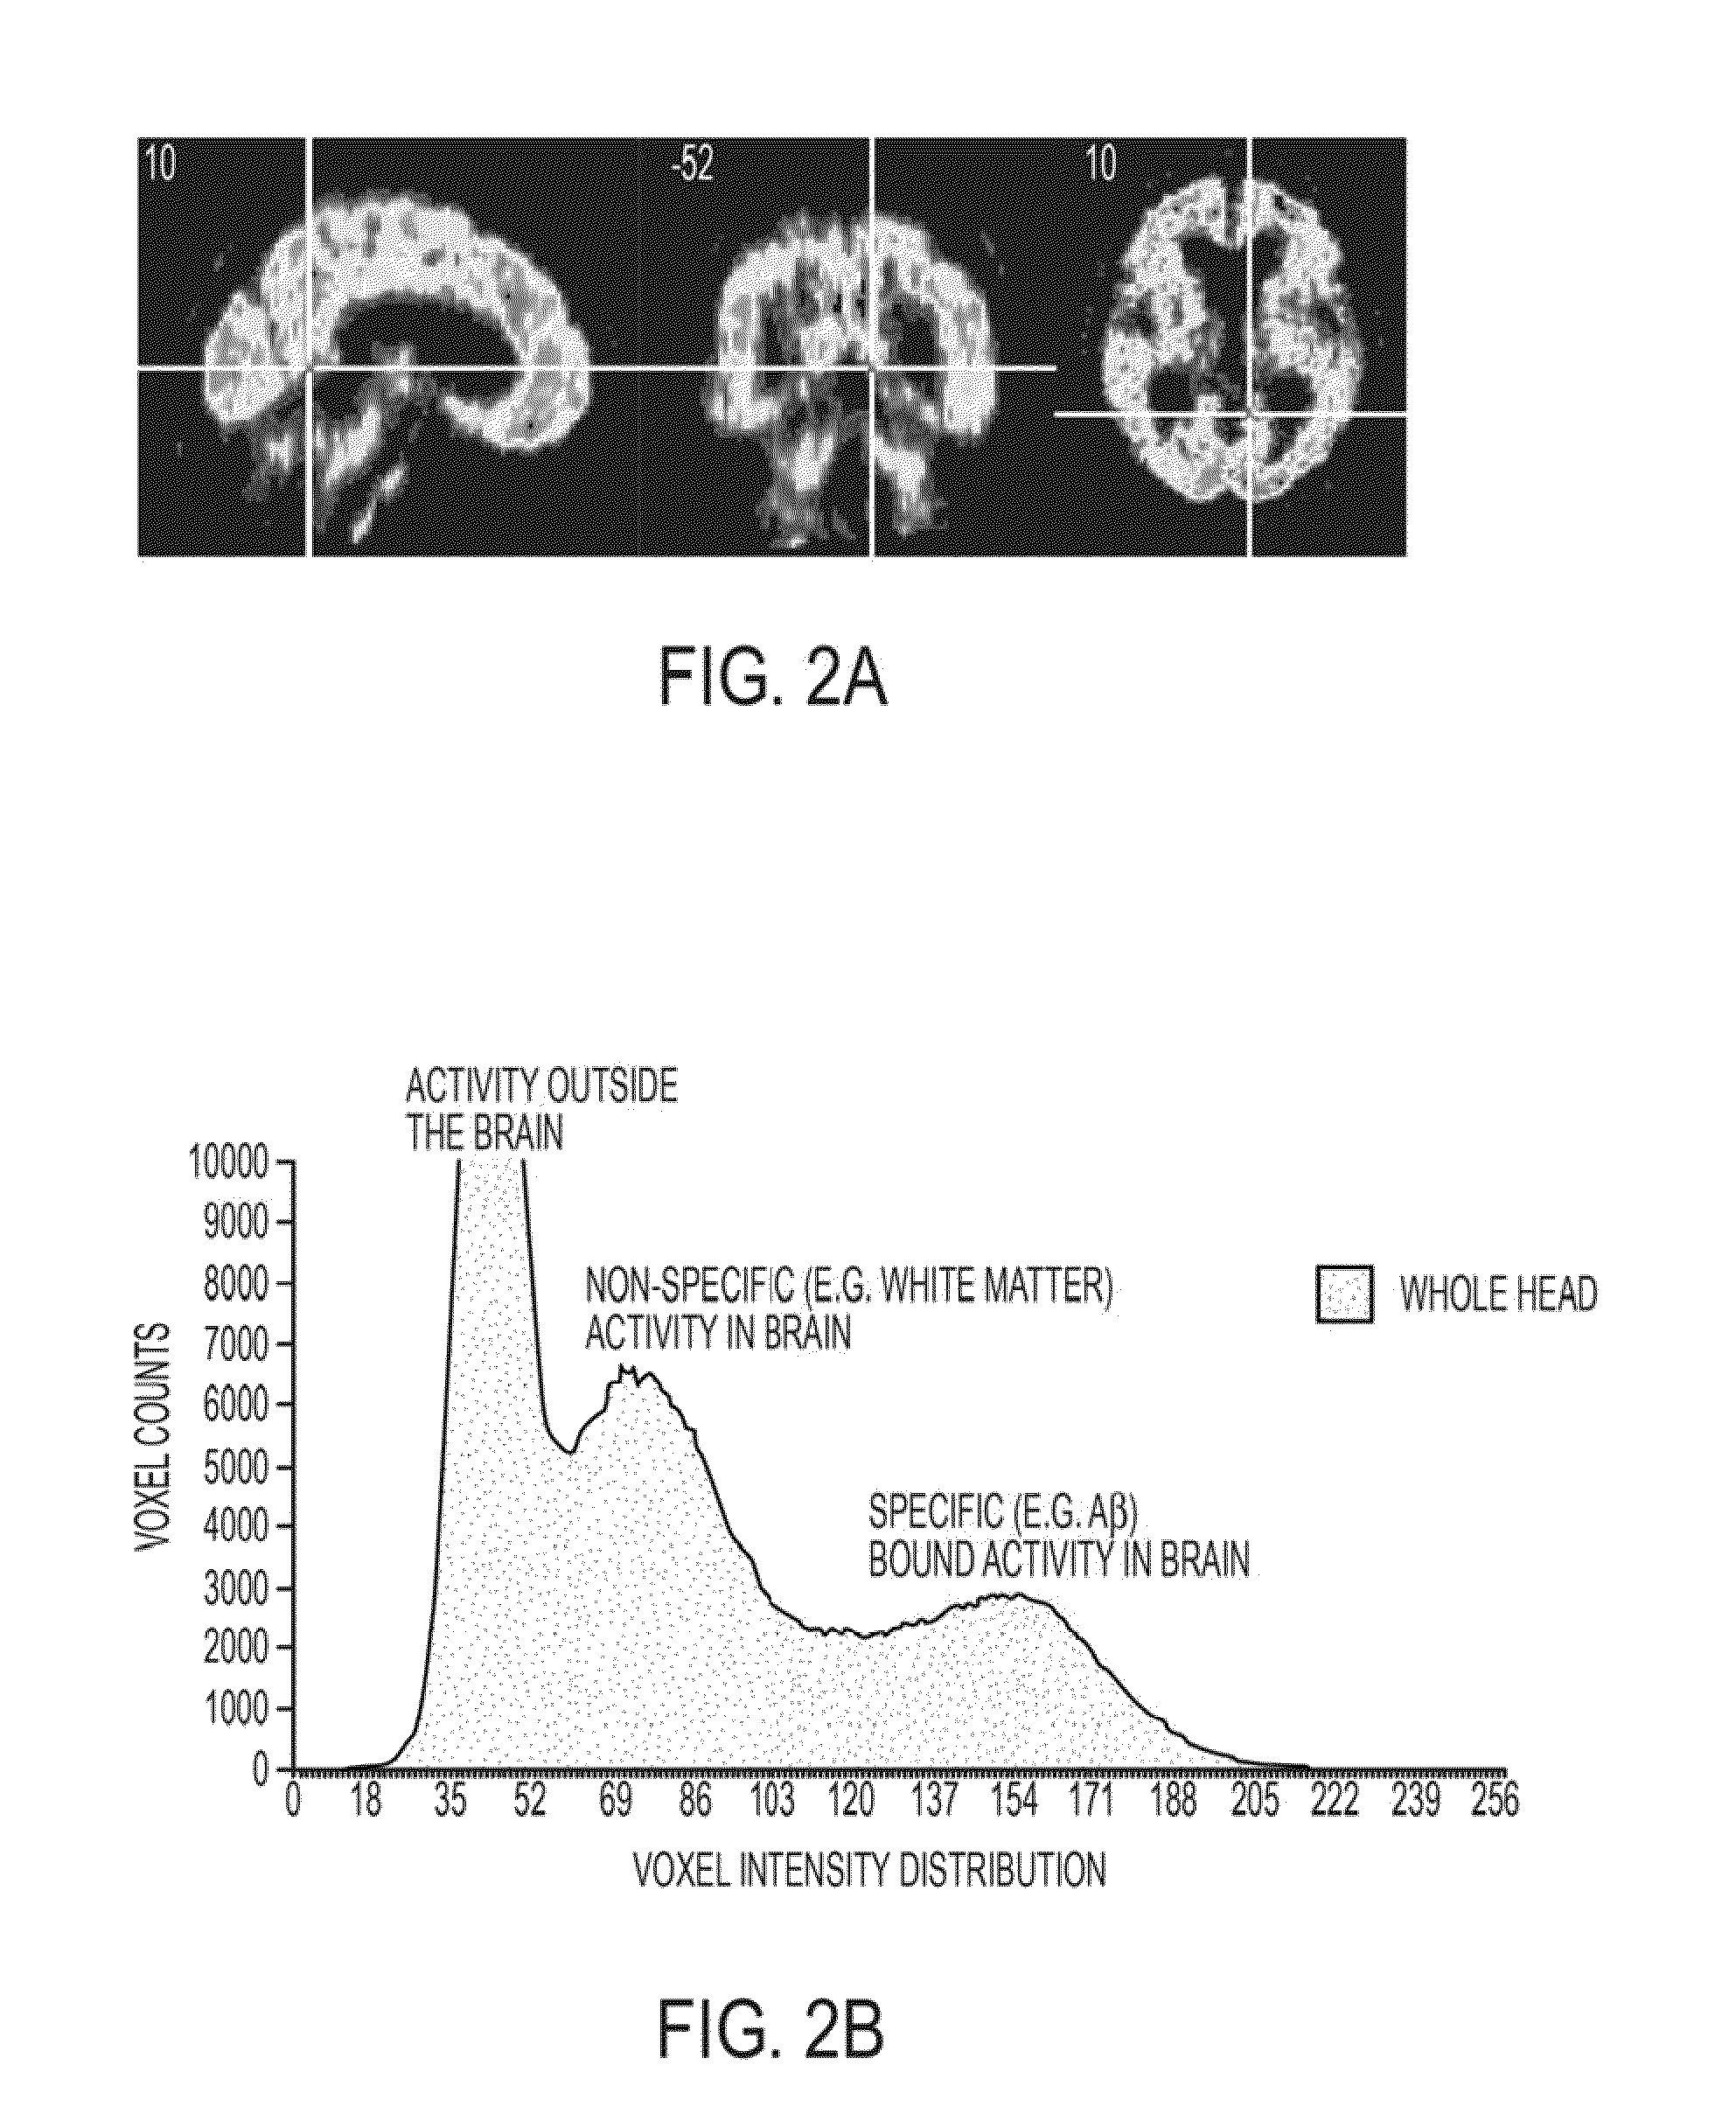
[0081]Evaluation of the PET image histograms of 18F-AV-45 (an amyloid-plaque binding radiopharmaceutical) revealed two distinct histogram f...

example 2

Measurements of the Relative Amount of Amyloid Plaque in Normal Subjects and Subjects with Amyloid Pathology Utilizing a Derivative Curve Separation Method Applied to the Image Histogram

[0083]18F-AV-45 brain PET scans were analyzed using histograms of amyloid-pathology-negative and amyloid-pathology-positive patients. The separation of the lower intensity, non-specific radiopharmaceutical voxel bins from the higher intensity voxel bins was accomplished by identifying the inflection point on a descending slope of a histogram curve (based on a first derivative analysis), which enabled the histogram to be divided into two parts, as shown in FIG. 6. FIG. 7 is a graph of the ratios of the areas under the histogram curve for post-inflection point (i.e. higher intensity specific radiopharmaceutical binding) relative to pre-inflection point (i.e. lower intensity non-specific radiopharmaceutical binding) voxel populations from the amyloid PET scans of cognitively normal and Alzheimer's disea...


PUM


Abstract

An analysis method using histograms derived from positron emission tomography (PET) or single photon emission tomography (SPECT) images of the brain, which utilizes radiopharmaceuticals for the detection and diagnosis of pathological targets associated with neurodegenerative disease in a patient is provided.

Description

[0001]This application claims priority under 35 U.S.C. §119(e) to U.S. Provisional Patent Application Ser. No. 61 / 114,277, filed Nov. 13, 2008, the disclosure of which is incorporated by reference in its entirety.BACKGROUND OF THE INVENTION[0002]1. Field of the Invention[0003]The present invention relates generally to methods for monitoring physiological activity in the brain and more specifically to the use of histograms representing brain scan image data for the detection of neurodegenerative diseases.[0004]2. Description of Related Art[0005]Alzheimer's disease (AD) is a progressive neurodegenerative disorder characterized by cognitive decline, irreversible memory loss, disorientation, and language impairment. AD affects 10% of the population aged greater than 65 and at least 50% of the population aged greater than 85 years. AD has been reported in patients as young as 40-50 years of age, but because the presence of the disease is difficult to detect without histopathological exam...

Claims


Application Information

Patent Timeline
IPC IPC(8): A61B6/00G06K9/00
CPCA61B5/00A61B5/055A61B6/00A61B6/037A61B6/508G06K9/4647G06K2209/05A61B5/7239A61B6/501A61B5/4064A61B5/4082A61B5/4088G06V10/507G06V2201/03
Inventor JOSHI, ABHINAY D.WOLODZKO, JOHN G.SAHA, KRISHNENDU
Owner AVID RADIOPHARMACEUTICALS
Why Eureka
Try Eureka