
System and method for determining the concentration of an analyte in a sample fluid

a technology of fluid concentration and electrochemical method, which is applied in the direction of material electrochemical variables, instruments, and investigating phase/state change, etc., can solve the problem that the true utility of a short test time is not fully reached with these teachings, and the electrochemical method for measuring the concentration of a chemical in blood is not fully applied. to achieve the effect of reducing the time for completing applications

Inactive Publication Date: 2010-07-08
ROCHE DIABETES CARE INC
View PDF104 Cites 59 Cited by
  • Summary
  • Abstract
  • Description
  • Claims
  • Application Information

AI Technical Summary

Benefits of technology

The patent describes a method for quickly and accurately measuring the concentration of a specific component in a biological fluid. This is done by applying two different signals to the fluid, measuring the current response to each, and then combining the two responses. The method can be completed in just a few seconds and has a low error rate. The first signal is a multi-frequency excitation waveform that is applied simultaneously to minimize the time needed for the two signals. The technical effect of this patent is a faster and more accurate way to measure important components in biological fluids.

Problems solved by technology

Failure to do so can produce extreme complications, including blindness or impaired circulation in the extremities, which can ultimately deprive the diabetic of use of his or her fingers, hands, feet, etc.
But the true utility of a short test time is not completely reached with these teachings in terms of the results being substantially unaffected by confounding interferents.
An important limitation of electrochemical methods for measuring the concentration of a chemical in blood is the effect of confounding variables on the diffusion of analyte and the various active ingredients of the reagent.
Examples of limitations to the accuracy of blood glucose measurements include variations in blood composition or state (other than the aspect being measured).
The utility of a reported blood glucose response after a short test time is questionable in applications where the results are not compensated for other sample variables or interferents such as hematocrit and temperature.
Separation of red blood cells with a glass fiber filter increases the size of the blood sample required for the measurement, which is contrary to test meter customer expectations.
Such methods also suffer from greatly increased test times.
However, reducing the number of frequency blocks used may have a negative affect on the level of accuracy attainable in correcting for multiple interferents, e.g., hematocrit and temperature.

Method used


Image

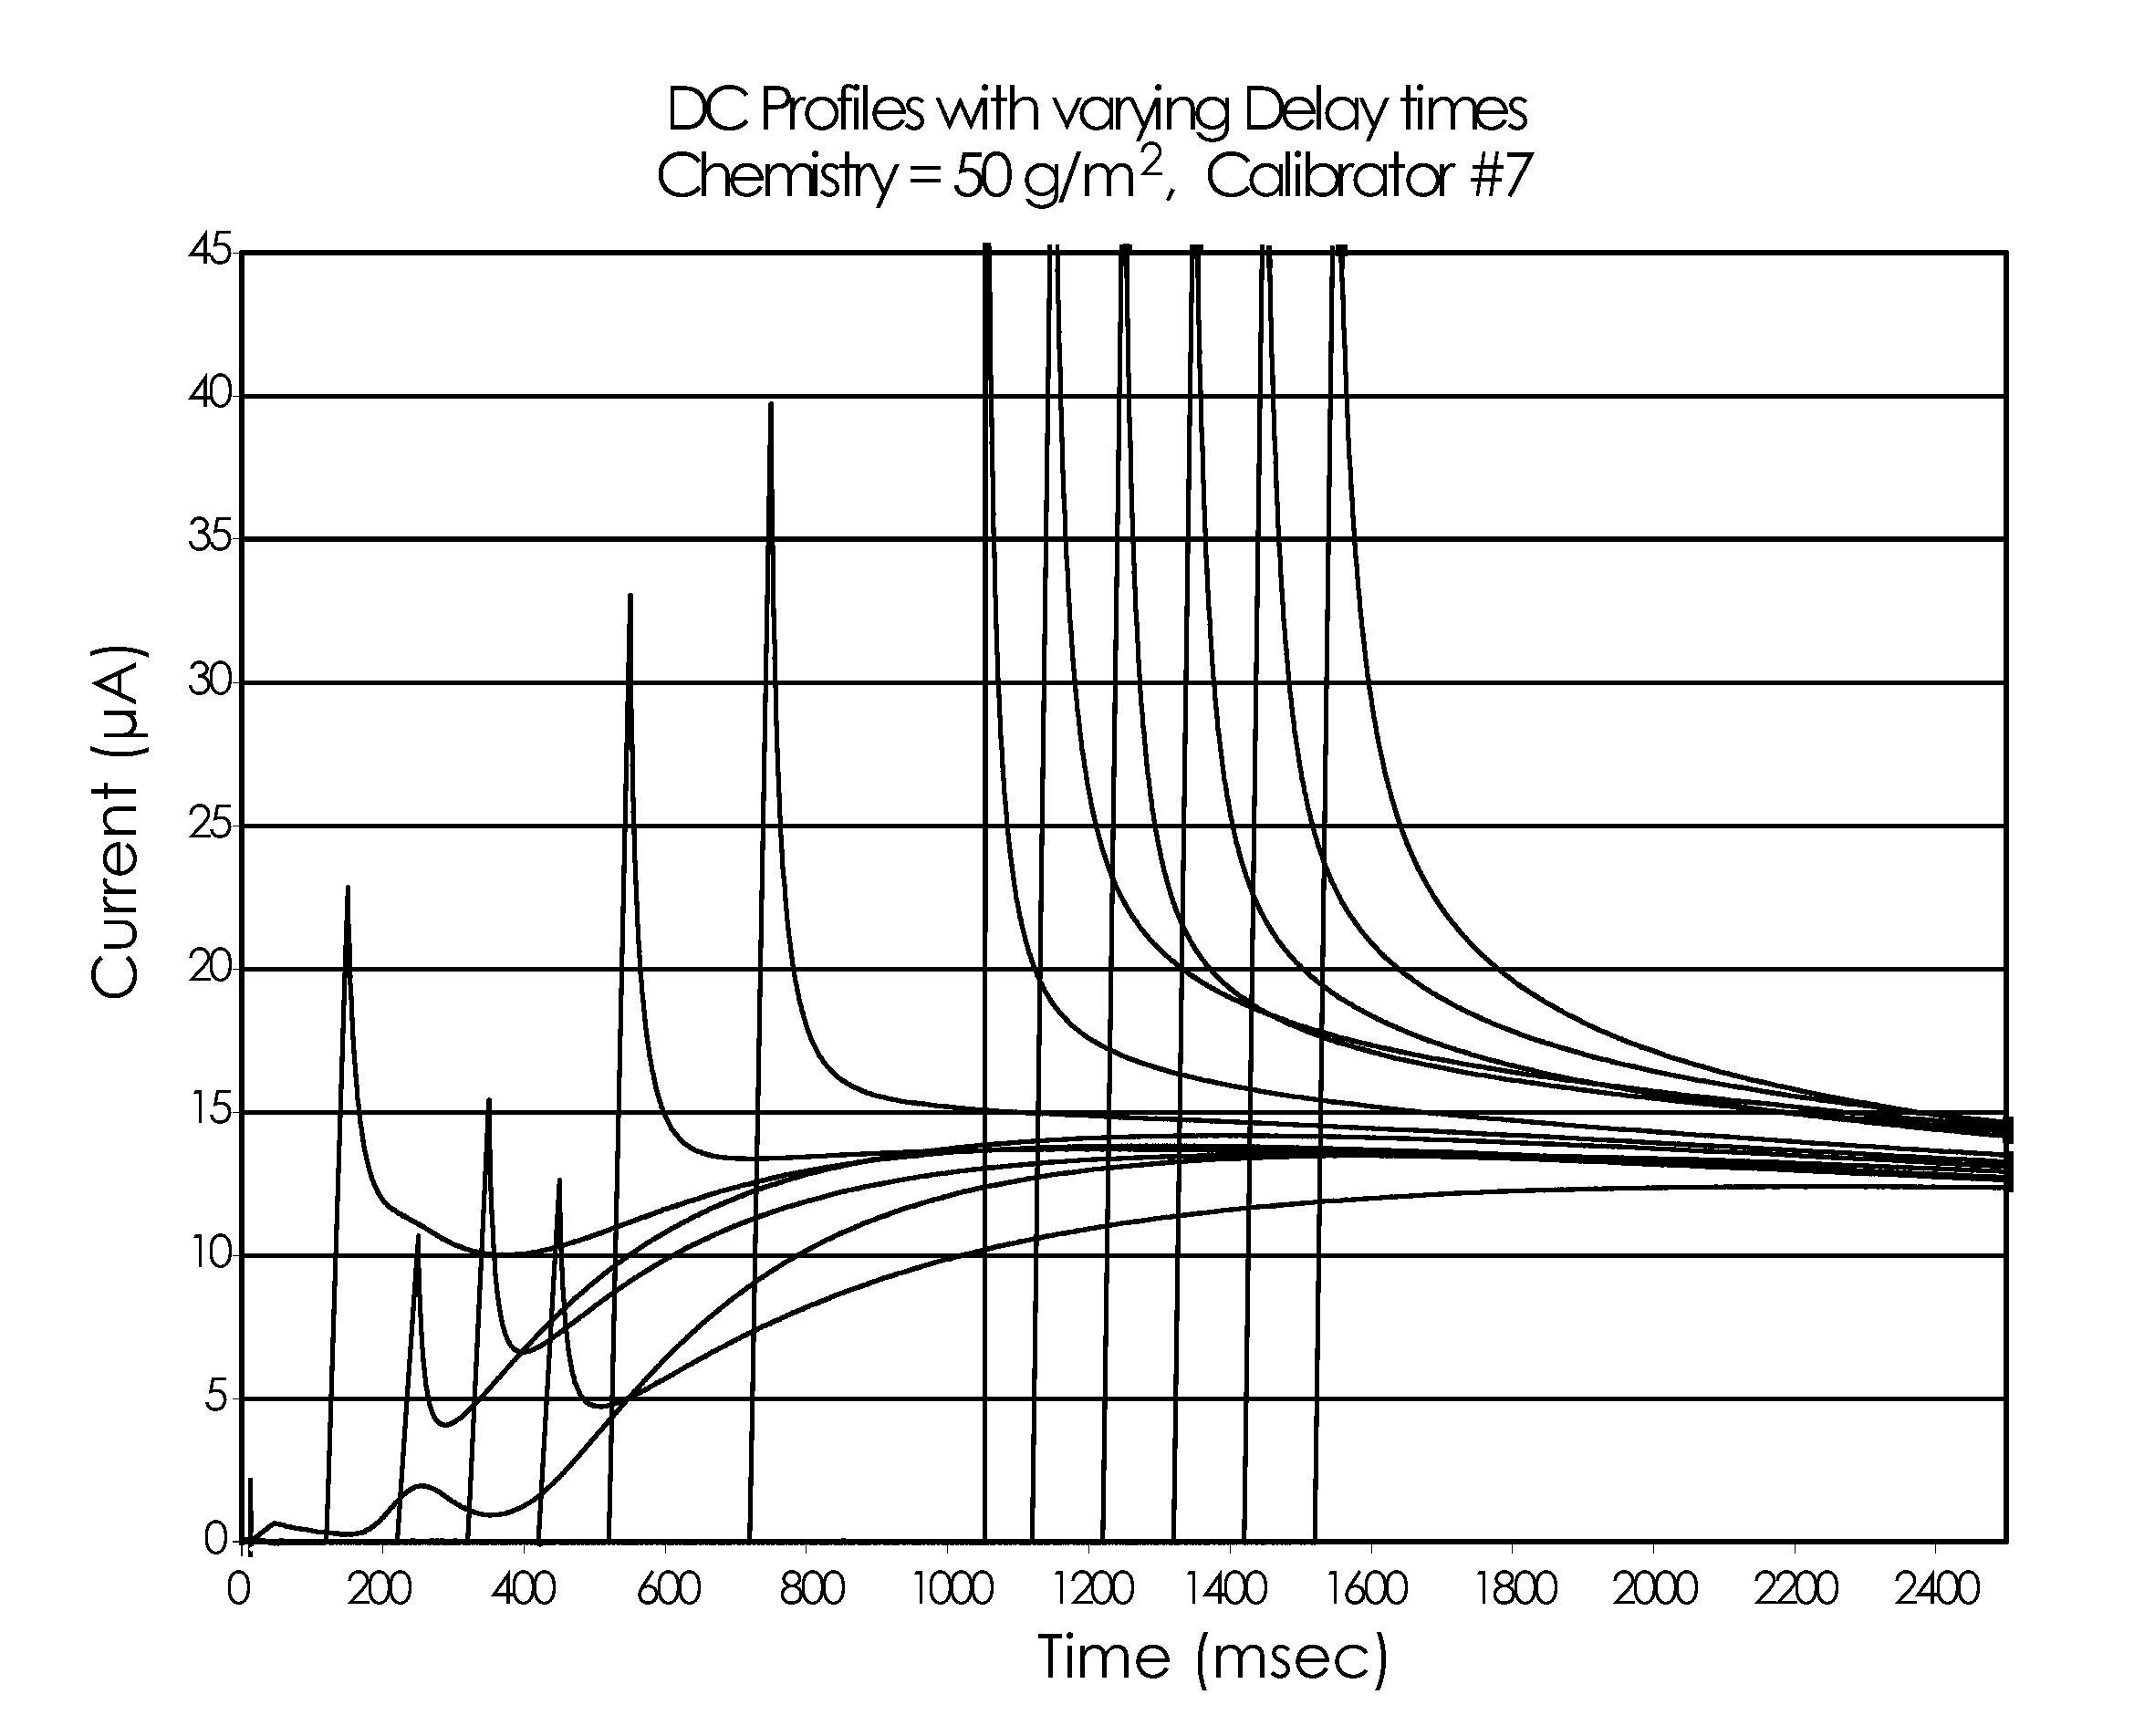
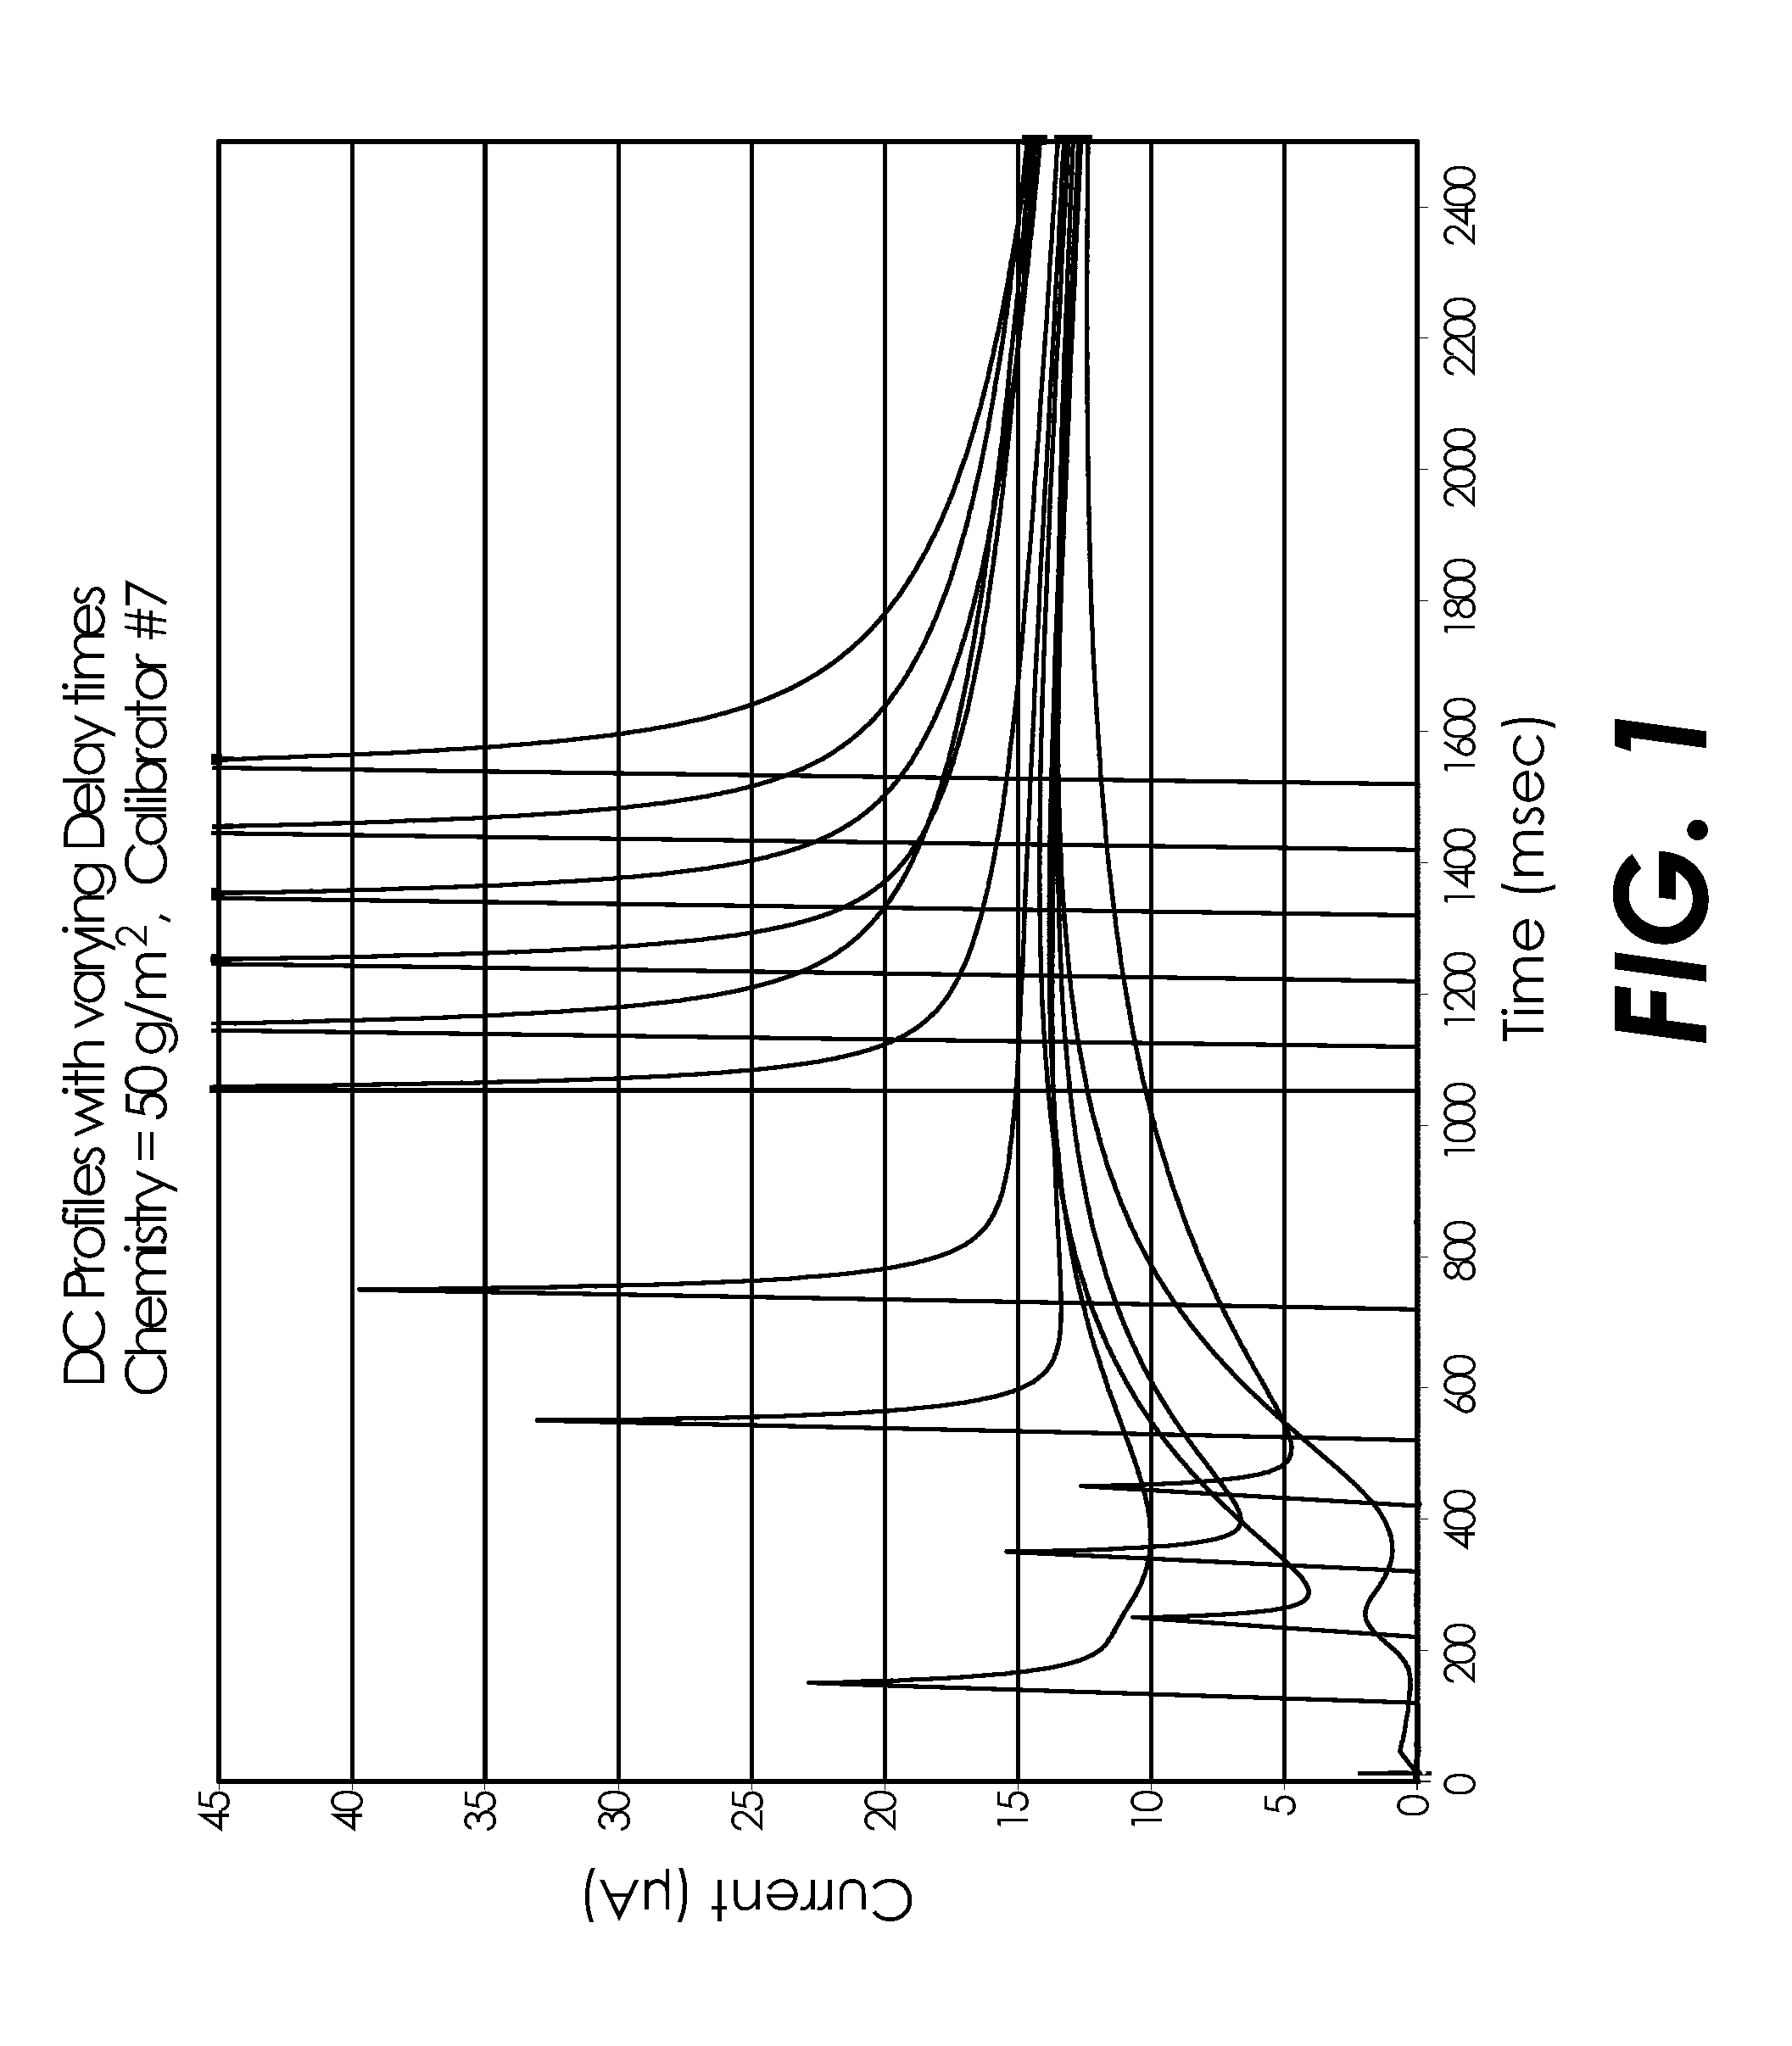
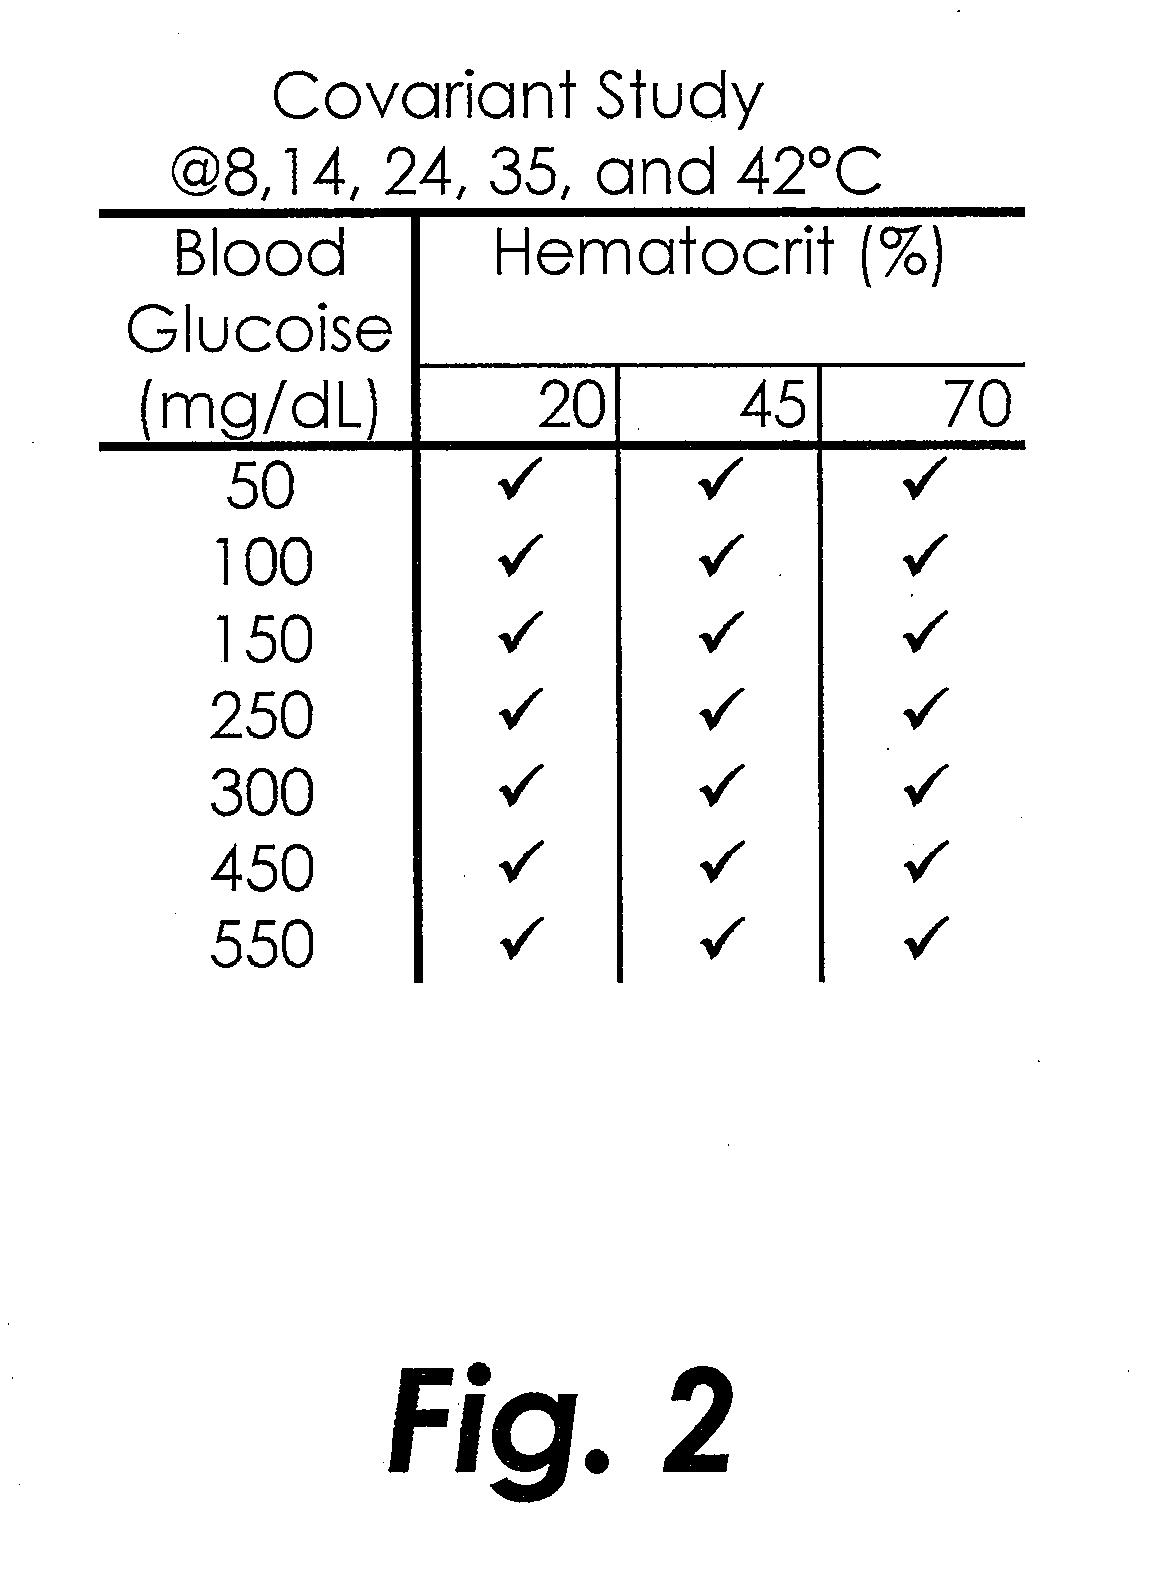
  • System and method for determining the concentration of an analyte in a sample fluid
  • System and method for determining the concentration of an analyte in a sample fluid
  • System and method for determining the concentration of an analyte in a sample fluid

Examples


example 1

Sequential Multiple AC Frequency Test with Fast Total Test Time

[0073]U.S. Pat. No. 7,407,811 teaches use of sequentially applied multiple frequency AC blocks followed by a DC block. For example, Example 5 described in U.S. Pat. No. 7,407,811 utilizes sequential applications of AC excitation followed by a DC excitation. The excitation signal comprised a 10 kHz AC signal applied for approximately 1.8 seconds, a 20 kHz AC signal applied for approximately 0.2 seconds, a 2 kHz AC signal applied for approximately 0.2 seconds, a 1 kHz AC signal applied for approximately 0.2 seconds, and a DC signal applied for approximately 0.5 seconds. The Total Test Time was 3.0 seconds.

[0074]In Example 6 of that same patent, it was desired to obtain Total Test Times as low as 1.1 seconds using the same test strip design that was used for Example 5 in that patent. In order to achieve this, the inventors did not believe that they could simply apply the sequential excitations of Example 5 for shorter perio...

example 2

Sequential Multiple AC Frequency Test with Fast Total Test Time and Varying Reagent Thickness

[0113]A covariate study testing multiple whole blood samples for glucose concentration was performed using the electrode and testing structures similar to the ACCU-CHEK® AVIVA™ biosensor available from Roche Diagnostics, Inc. of Indianapolis, Ind. USA. A pyrroloquinoline quinone dependent glucose dehydrogenase (PQQ-GDH) based reagent with the same or substantially similar formulation from Table 1 (above) was applied to the biosensors in one of three thicknesses: 2 μm, 2.5 μm and 4 μm. A covariate study was performed with whole blood samples similar to Example 1 but with six glucose concentrations, five hematocrit levels, and five temperatures, as detailed in FIG. 10.

[0114]The AC excitation potentials for this Example 2 were applied sequentially as detailed in FIG. 11. A 10 kHz dose detection and sample sufficiency method (not shown) was followed by a 300 ms 20 kHz signal followed by 100 ms a...

example 3

Multi-Frequency AC Test with Fast Total Test Time

[0149]The measurements conducted for Example 3 were made with electrode structures similar to that of ACCU-CHEK® AVIVA™ biosensors and reagents the same or similar to the formulation set forth in Table 1 (above). These sensors were fabricated using generally the same technology as ACCU-CHEK® AVIVA™ biosensors using a combination of processes including sputtering, laser ablation, reagent slot die coating, and lamination.

[0150]The measurement sequence consisted of three basic blocks. The first measurement block (not shown) utilized a 10240 Hz sine wave excitation applied to the test strips in order to detect sample dose sufficiency (filling of the capillary test chamber sufficient to conduct a measurement). The use of AC measurements for drop detect and dose sufficiency is described in U.S. Pat. No. 7,597,793, referred to hereinabove.

[0151]After sufficient sample was detected, the second measurement block was begun using a multi-sine (a...


PUM

PropertyMeasurementUnit
total timeaaaaaaaaaa
frequenciesaaaaaaaaaa

Abstract

The present disclosure relates to various methods for measuring the amount of an analyte present in a biological fluid using an electrochemical testing process. Various embodiments are disclosed, including the use of AC test signals and the performance of tests having a Total Test Time within about 2.0 seconds or less, and / or having a clinically low Total System Error.

Description

REFERENCE TO RELATED APPLICATIONS[0001]This application is a continuation-in-part of U.S. Utility patent application Ser. No. 10 / 871,966, filed Jun. 18, 2004, which claims the benefit of U.S. Provisional Application No. 60 / 480,397, filed Jun. 20, 2003. This application is also a continuation-in-part of U.S. Utility patent application Ser. No. 10 / 871,673, filed Jun. 18, 2004, which claims the benefit of U.S. Provisional Application No. 60 / 332,397, filed Jun. 20, 2003. This application is also a continuation-in-part of U.S. Utility patent application Ser. No. 12 / 505,124, filed Jul. 17, 2009, which is a divisional of U.S. Utility patent application Ser. No. 12 / 330,757, filed Dec. 9, 2008 which is a continuation of U.S. Utility patent application Ser. No. 10 / 688,561, filed Oct. 17, 2003, now issued as U.S. Pat. No. 7,488,601, issued Feb. 10, 2009, which claims the benefit of U.S. Provisional Application No. 60 / 480,298, filed Jun. 20, 2003. This application is also a continuation-in-part...

Claims


Application Information

Patent Timeline
Patent Type & Authority Applications(United States)
IPC IPC(8): G01N27/26
CPCG01N33/49G01N27/3274G01N27/30
Inventor DIEBOLD, ERIC R.BEATY, TERRY A.BUCK, JR., HARVEY B.
Owner ROCHE DIABETES CARE INC
Learn More