Method for Detecting Drag Reducer Additives in Gasoline

a drag reducer additive and additive detection technology, applied in the field of methods, can solve the problems of long-chained drag reducer additives being subjected to gradual breakage, affecting the detection accuracy of drag reducer additives,

Active Publication Date: 2012-02-23
SAUDI ARABIAN OIL CO
View PDF8 Cites 16 Cited by
  • Summary
  • Abstract
  • Description
  • Claims
  • Application Information

AI Technical Summary

Benefits of technology

[0009]One embodiment of the invention is a method for detecting the concentration of polymer-based drag reducer additives in gasoline, the method including the following: (a) placing a gasoline sample in a receptacle having at least two adjacent clear sides and irradiating one of the two clear sides of the receptacle with a pulsed laser beam, the pulsed laser beam having a wavelength in the ultra violet region shorter than 300 nm; (b) detecting laser-induced fluorescence wavelength resolved spectrum at 90° angle relative to the incident laser beam and through a slit defined in a diffraction screen, the diffraction screen being placed at a pre-defined first distance from the receptacle; (c) adjusting the position of the receptacle and slightly de-focusing the collimating lenses so that the low resolution fluorescence wavelength-resolved spectrum of the gasoline sample appears with a first peak at about 380 nm and a second peak at about 430 nm; (d) recording the laser-induced fluorescence wavelength-resolved spectra of the gasoline sample within a defined time-gate starting at the end of the temporal span of the laser pulse; and (e) comparing the percentage intensity of the first peak relative to the second peak for the laser-induced fluorescence spectrum near 380 nm of the gasoline sample to that of a gasoline sample free of any polymer-based drag reducer additives. In another embodiment of the method, the location of the diffraction-screen is at the pre-defined distance of between 0.5 mm to 2 mm from the side of the receptacle. In another embodiment of the method, the time-gate in step (d) is of 3 ns width and starting immediately after the end of the laser pulse. In another embodiment of the method, the following steps are added: (a) repeating steps (a) through (e) with a control sample that is free of drag reducer additives; and (b) comparing the percentage intensities of the gasoline sample with the control sample.
[0010]Another embodiment of the present invention is a method of estimating the concentration of polymer-based drag reducer additives in an unknown sample of gasoline, the method including the following: (a) detecting the laser-induced fluorescence spectra within a first time-gate and a second time-gate for the gasoline sample to produce a first recorded intensity of spectra measured at the first time-gate and a second recorded intensity of spectra measured at the second time-gate; (b) normalizing the first recorded intensity of spectra to unity at the highest peak while those of the second time-gate are plotted relative to them without being normalization; (c) determining the areas-under-the-curves of the first and second recorded spectra in a particular wavelength range; (d) calculating the area-under-the-curve ratio of the first recorded spectrum relative to the second recorded spectrum using the normalized numbers; (e) repeating steps (a) through (d) above for a first control sample and a second control sample, each control sample being prepared with a pre-known drag reducer additives concentrations in gasoline, and (f) applying curve fitting relative to the first and second recorded spectra to produce a calibration curve for those pre-known samples, and then using the calibration curve to estimate the drag reducer additives concentration of the unknown gasoline sample. In another embodiment of the method, the first of the two narrow time-gates starts immediately after the end of the laser pulse and the second narrow time-gate starts 6 ns after the end of the laser pulse for a calibration curve in the 0-1 PPM range. In another embodiment of the method, the first of the two narrow time-gates starts immediately after the end of the laser pulse and the second narrow time-gate starts 9 ns after the end of the laser pulse for a calibration curve in the 1-10 PPM range. In another embodiment of the method, the intensities of the laser-induced fluorescence spectra are normalized to unity at the second peak near 430 nm. In another embodiment of the method, the intensities of the laser-induced fluorescence spectra are normalized to unity at the second peak near 430 nm. In another embodiment of the method, the areas-under-the-curves in steps (c) and (d) are in a spectral range near the first peak near 380 nm.

Problems solved by technology

As drag reducer additives injected gasoline fuels travel through pipelines, the long-chained drag reducer additives become subjected to gradual breakage mainly due to the mechanical shearing action within the pumps and pipelines.
A method for detecting the presence and / or concentration of drag reducer additives in gasoline fuel is based on size exclusion techniques such as gel-permeation chromatography which is relatively complicated, lengthy and expensive.
Detection of drag reducer additives is complicated when the drag reducer additives are used with gasoline fuels.
Due to the use of dilute polymeric hydrocarbons as drag reducer additives, they are indistinguishable from gasoline fuel using many of standard detection methods.
In addition, drag reducer additives has no UV chromophores and, as such, it does not fluoresce when irradiated by UV light leading to challenges in using photo-optical methods for detection.

Method used


Image

  • Method for Detecting Drag Reducer Additives in Gasoline
  • Method for Detecting Drag Reducer Additives in Gasoline
  • Method for Detecting Drag Reducer Additives in Gasoline

Examples


examples

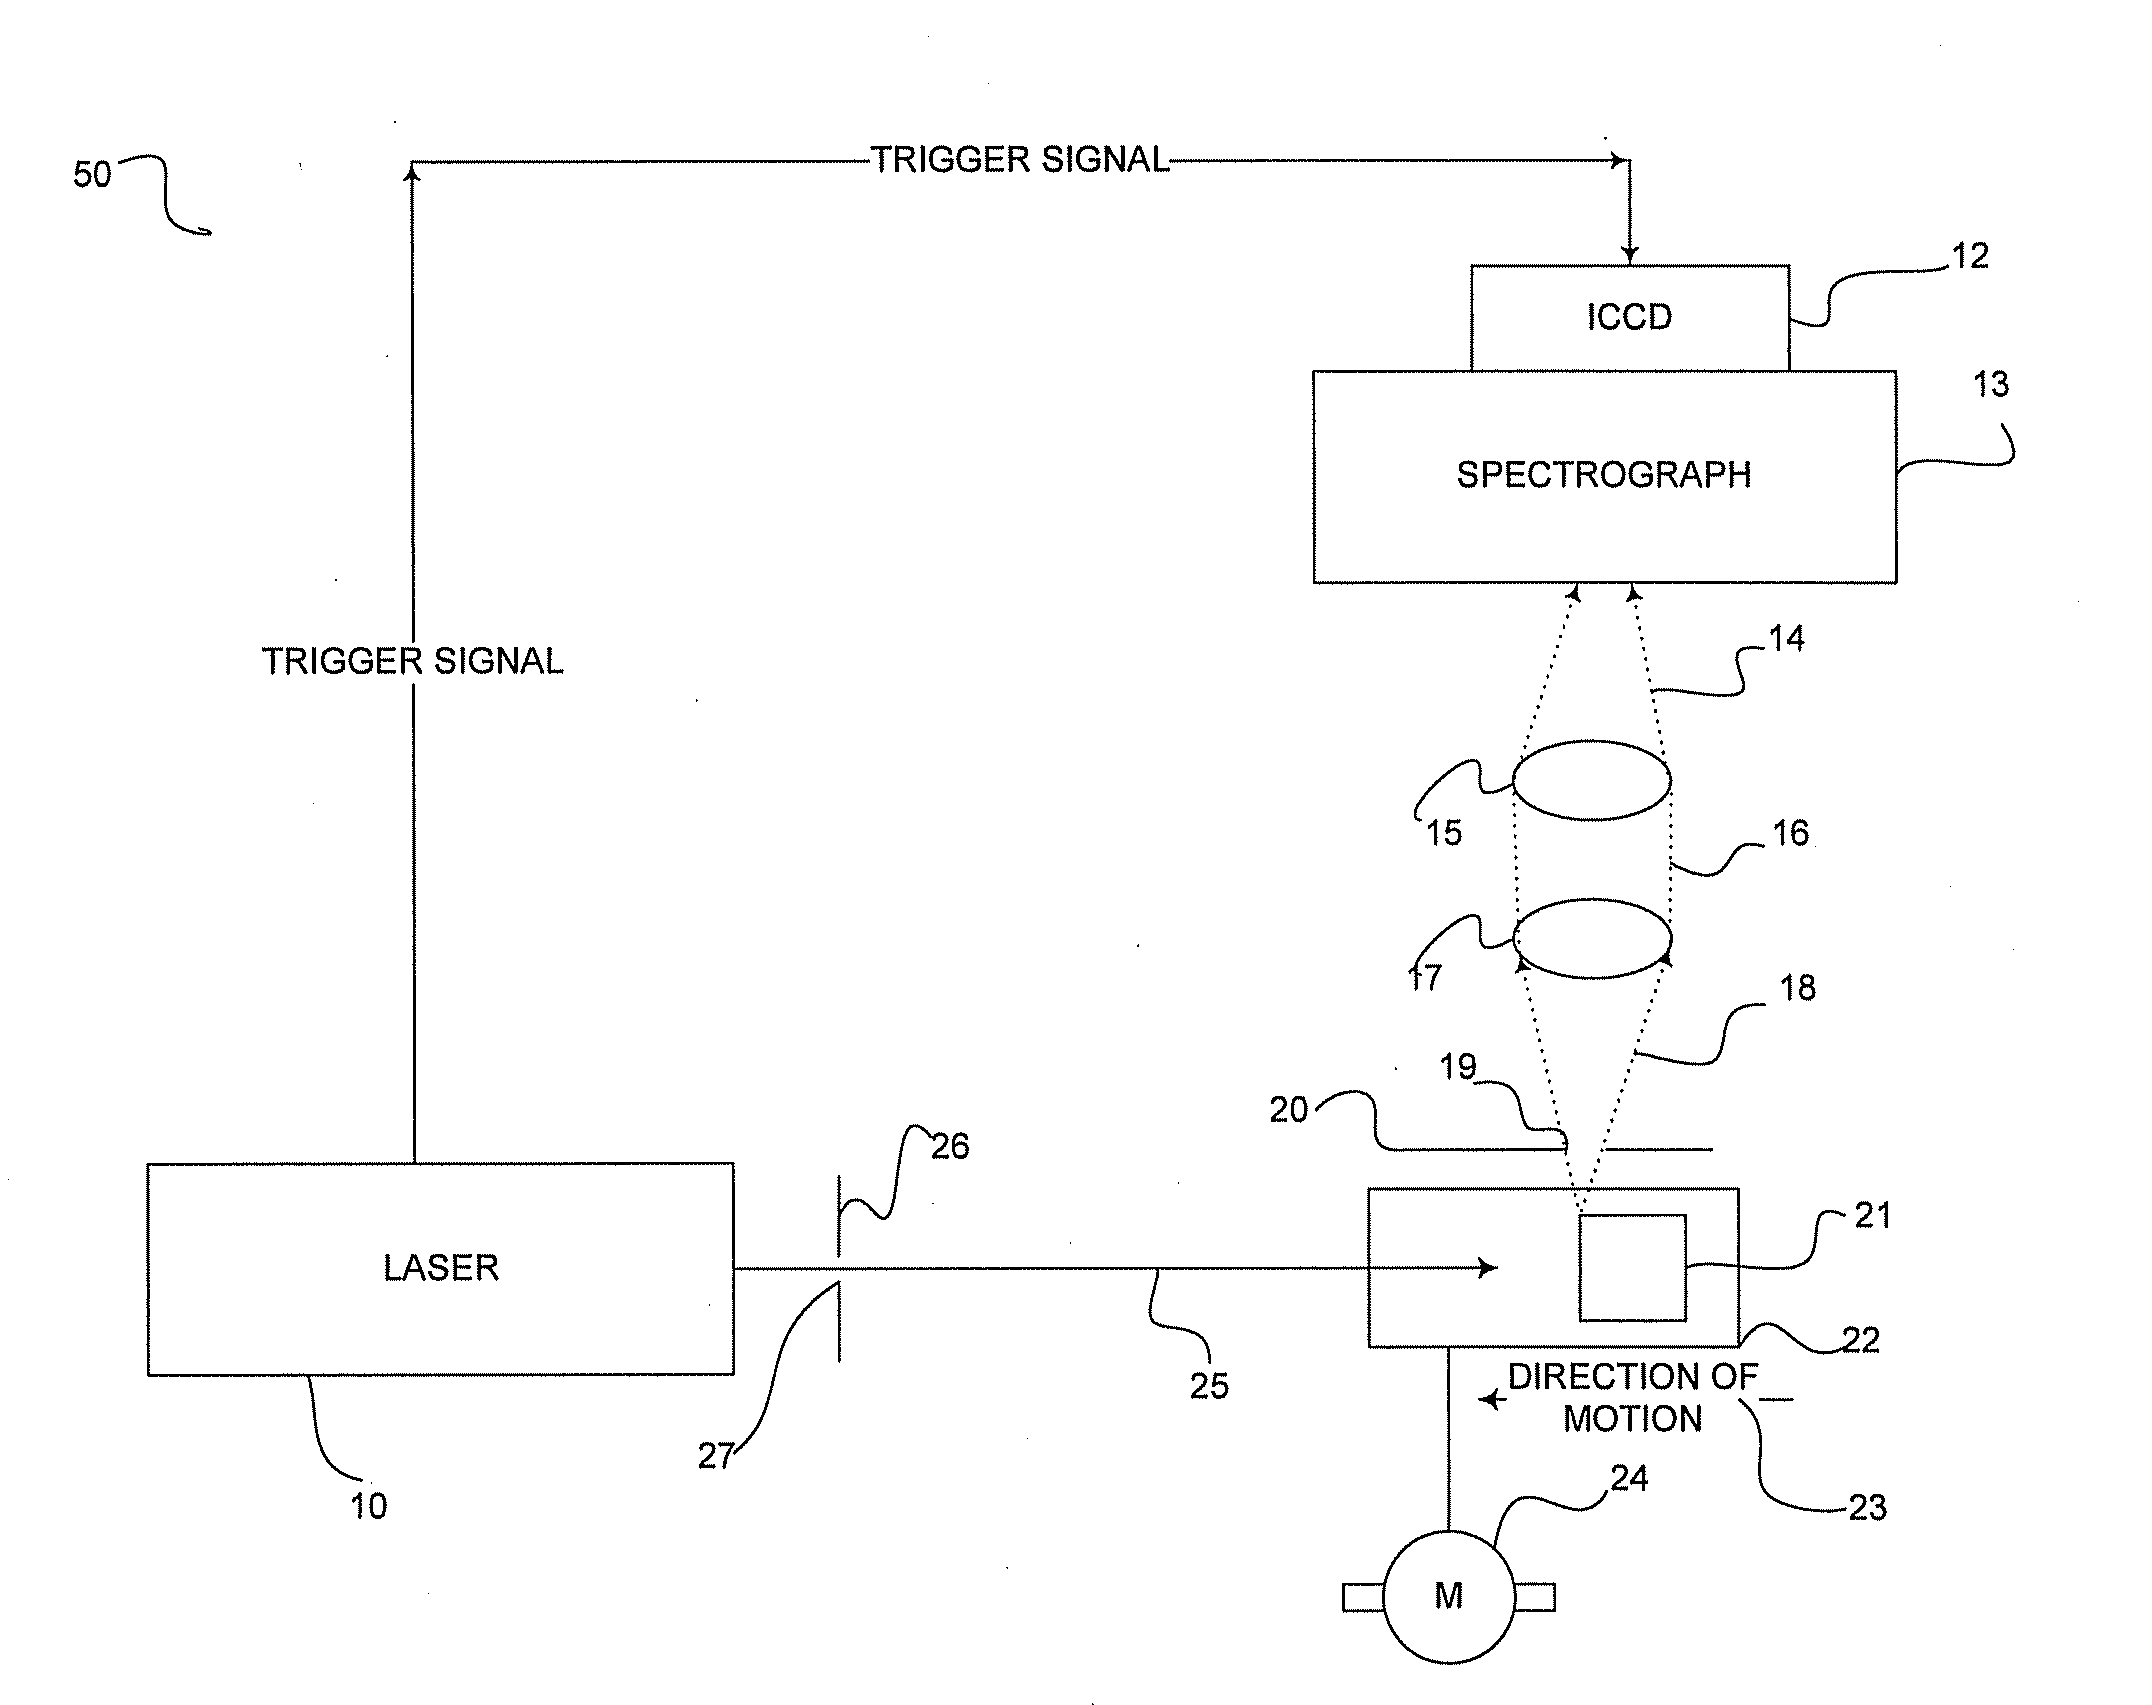
[0042]Examples of the laser-induced fluorescence spectra are shown in FIG. 3, which are for commercial drag reducer additives-free gasoline having octane grade 91 with dark green coloring additive dye and other standard additives. Both spectra in FIG. 3 were measured within time-gates of 3 ns each. The top spectrum is 0S3 and the bottom spectrum is 6S3. The two distinct peaks on each spectrum are at approximately 383 nm and 430 nm. The first part of the method maintains that, on the 0S3 spectrum, a gasoline sample is contaminated with drag reducer additives of any amount >0.1 PPM if the peak at 383 nm drops in intensity relative to the peak at 430 nm when compared to a non contaminated gasoline sample.

[0043]Preparation of Known Drag Reducer Additives Concentrations in Gasoline Samples

[0044]In the following examples the gasoline samples were supplied by the Dhahran refinery of Saudi Aramco Oil Company and had included the standard dark green dye and all other standard additives such ...


PUM


Abstract

A method for detecting polymer-based drag reducer additives in gasoline. One embodiment of the invention is a method for detecting the concentration of polymer-based drag reducer additives in gasoline, the method including the following: (a) placing a gasoline sample in a receptacle having at least two adjacent clear sides and irradiating one of the two clear sides of the receptacle with a pulsed laser beam, the pulsed laser beam having a wavelength in the ultra violet region shorter than 300 nm; (b) detecting laser-induced fluorescence wavelength resolved spectrum at 90° angle relative to the incident laser beam and through a slit defined in a diffraction screen, the diffraction screen being placed at a pre-defined first distance from the receptacle; (c) adjusting the position of the receptacle and slightly de-focusing the collimating lenses so that the low resolution fluorescence wavelength-resolved spectrum of the gasoline sample appears with a first peak at about 380 nm and a second peak at about 430 nm; (d) recording the laser-induced fluorescence wavelength-resolved spectra of the gasoline sample within a defined time-gate starting at the end of the temporal span of the laser pulse; and (e) comparing the percentage intensity of the first peak relative to the second peak for the laser-induced fluorescence spectrum near 380 nm of the gasoline sample to that of a gasoline sample free of any polymer-based drag reducer additives. In another embodiment of the method, the location of the diffraction-screen is at the pre-defined distance of between 0.5 mm to 2 mm from the side of the receptacle. In another embodiment of the method, the time-gate in step (d) is of 3 ns width and starting immediately after the end of the laser pulse.

Description

BACKGROUND OF THE INVENTION[0001]1. Field of the Invention[0002]This invention relates to detecting polymer-based drag reducer additives in a gasoline sample.[0003]2. Description of the Related Art[0004]Polymer-based drag reducer additives are made of long chained poly-alpha-olefin polymers with ultra-high molecular weight (larger than 1-million Daltons). When injected into a stream of gasoline fuels traveling through pipelines, drag reducer additives enhances the flow of the stream by reducing effect of drag of the liquid from the pipeline walls. This, in turn, creates better streamlining for the flow in the pipe and ultimately leads to significant reductions in the cost of pipeline shipping.[0005]As drag reducer additives injected gasoline fuels travel through pipelines, the long-chained drag reducer additives become subjected to gradual breakage mainly due to the mechanical shearing action within the pumps and pipelines. Usually, the amount of drag reducer additives to be injecte...

Claims


Application Information

Patent Timeline
Patent Type & Authority Applications(United States)
IPC IPC(8): G01J1/58
CPCG01N21/274G01N21/6402G01N21/6408G01N2021/6491G01N33/2835G01N2021/6421G01N2021/6482G01N21/645
Inventor HEGAZI, EZZAT M.AL-SAYEGH, MAHA A.
Owner SAUDI ARABIAN OIL CO
Why Eureka
Try Eureka