Multiple simultaneous biometric data acquisition and display system and method of use

a biometric data and display system technology, applied in the field of multiple simultaneous biometric data acquisition and display system and method of use, can solve the problems of one-dimensional analysis conclusions lacked accuracy, supportability and repeatability, one-dimensional analysis conclusions were not considered, and the one-dimensional analysis was not considered. , to achieve the effect of reducing the rigidity of method and system, and improving the extensibility of system

Inactive Publication Date: 2013-05-23
VIZKINECT
View PDF1 Cites 3 Cited by
  • Summary
  • Abstract
  • Description
  • Claims
  • Application Information

AI Technical Summary

Benefits of technology

[0023]In some embodiments, a normalized intermediate data structure is used to aggregate demographic data, metadata, similar biometric data and dissimilar biometric data. Such a normalized structure can enable independence both in terms of biometric collection devices and in terms of presentation technologies. The ability to rely on a normalized data structure can significantly improve the extensibility of the system as a whole, as well as, in some embodiments, that of any interfacing technologies. Such a normalized model can further enable the integration of single stream data that would otherwise exist without necessarily aggregating relationships into an aggregated analytical model.
[0024]In some embodiments, a dynamic extensible data model is used to accommodate additional inputs from an expanding set of biometric collection devices, as well as additional meta-data parameters. This dynamic data model can allow for the collection of a set of expected and unexpected parameters, enabling, in some embodiments, a more substantial parameterized filtering and grouping of data, resulting in greater accuracy and flexibility. Further, a dynamic data model can significantly reduce the rigidity of the method and system, enabling functional expansion without significant customization.
[0025]In some embodiments, server-based data storage and processing are used, which can dramatically reduces the time required to transform, transfer and / or aggregate data, as well as reduce the potential difficulties associated with synchronizing collected biometric data with the dynamic environmental stimulus of the test environment. In addition, data processing of the aggregated data can be executed in a controlled fashion on a more processing-centric device or virtual device, which, in some embodiments, can avoid possible conflicts or deadlock conditions that can occur when processing for single streams occurs in isolation.
[0026]In some embodiments, a color-correlated, user-interactive, circle-based display overlay can be used to correlate biometric data with regions, areas and points of interest. The color-correlation can enable the interactive identification of filtered and segregated sub-groups of participants in real-time. Rather than using heat maps and gaze plots, in some embodiments, the use of color-correlated circles minimizes the tendency to excessively obscure the stimulus used for testing, while, in some embodiments, providing the administrators the ability clearly identify trends and patterns within a set or subset of test participants. Further, the interactive element of the circles can enable the administrator to click on a specific circle at a given gaze location to, for example, see related parametric data. This can provide instantaneous awareness of demographic and / or metadata attributes that may be involved in trending or patterning as they relate to regions, areas or points of interest.
[0027]In some embodiments, a color-correlated, user-interactive, circle-based display overlay provides support for the overlay of a recorded stimulus with both a base set of biometric data and a participant's biometric data such that the divergence by the participant from the standard is easily observed at every point in the test. This can simplify the aggregation of participant data over an extended period of time such that, in some embodiments, this data can be easily overlaid on a recorded stimulus and the base biometric data easily identified based upon color. This is of particular interest in the case of novice to expert training. For example, visual information is important during medical training. Studying doctor's eye movements is an innovative way to assess skills, particularly when comparing eye movement strategies between expert medical doctors and novices. This comparison may show important differences that can be used in the training process. The ability to see the divergence patterns of the novice as compared to that of the expert in real-time allows for immediate correction and the proper focusing of the training process.
[0028]In some embodiments, individual biometric data streams can be isolated in real-time. This can allow for the identification and possible correction of anomalous behavior within a multi-user test environment. This isolation capability can also be indicative of equipment malfunctions, allowing for said malfunction to be immediately addressed, thus, improving the quality, quantity and accuracy of data collected and results obtained through the exclusion of outliers.

Problems solved by technology

This one-dimensional approach failed to account for the value of including data from multiple participants simultaneously.
It also failed to consider the value of displaying aggregated results in real time.
The conclusions drawn from such a one-dimensional analysis lacked accuracy, supportability and repeatability.
In addition, it was costly to attempt to collect data serially from single participants, especially in cases where tests needed to be repeated over an extended period of time.
This added step was not only time consuming, labor-intensive and error-prone, but made synchronization potentially difficult with respect to associating the collected biometric data with the dynamic environmental stimulus.
Another disadvantage of these methods and systems was that typically they were coupled to a specific biometric input device.
This resulted in end-to-end proprietary systems that were typically not capable of easily and efficiently capturing similar data from similar biometric capture devices, or dissimilar data from disparate biometric capture devices.
Vertical solutions with limited interfaces to a limited set of input devices and processing systems based on a static data model typically resulted in architectures that were very inefficient, costly, difficult to implement and lacking in robustness and extensibility.
A further disadvantage of these proprietary methods was a lack of consistency across presentation tools and drill-down capabilities within those tools.
The proprietary approach typically included a degree of manual involvement that was costly, complex and prone to error.
Further, the ability to drill down into the biometric data by interacting with the presentation of the results is also limited to the presentation tool's awareness of the attributes obtained in the static aggregated data structures.
The degree of modification required at the data level, as well as the development necessary to enable useful drill down for a particular test, was significant and often prohibitive in terms of time, expense and reusability.
The proprietary approach typically involved substantial customization that made broad dynamic application of biometric capture and analysis unrealistic.
In addition, these methods and systems were not typically designed to support multiple simultaneous participants utilizing disparate biometric capture devices.
Further, the data model for this method and system was typically designed only to manage a single family of biometric data, such as eye-tracking data, and to leave no flexibility for capturing, structuring, relating and efficiently analyzing other related biometric data.
The lack of a robust data model that can easily incorporate disparate biometric data severely limits the value of the results and the strength of conclusions drawn.
Display approaches were typically focused towards either a single user or an aggregation of all users, and did not enable the dynamic creation of user sets based on demographic data, metadata or multiple biometric data inputs.
Further, it was standard practice to display the data in such a way that it obscured the underlying area of interest, as is the case when using heat maps, or in a manner that does not adequately identify distinctive qualities of participant subgroups based upon demographic or other biometric data.
This information was used in complex post-collection processing to generate static charts, graphs or statistics, but lacked the flexibility to easily filter and segregate participants into subgroups across all dimensions, both for real-time display as well as for post-collection processing.
The design of the object model and data model in traditional systems typically failed to support the various data structures required to account for data collected from similar and dissimilar biometric devices, as well as for the collection and structuring of non-biometric data, such as demographic or environmental information.
These traditional approaches were designed primarily to perform post collection aggregation, processing and display, resulting in significant lag-time between testing and presentation.
This made it difficult to recognize relevant conditions under test and adjust or modify conditions in order to obtain the most valuable data for the purpose of drawing definitive conclusions.
Additional tests had to be scheduled that typically involved gathering participants at different times and days, with control conditions unintentionally varied.
This severely compromised the integrity of these additional test iterations and therefore the accuracy of the results obtained.
The absence of real-time processing and presentation of aggregated data added to the complexity and risk in using these systems and methods.
Calibration of biometric devices was yet another time consuming element of attempting to perform studies with multiple participants.
This error prone and time-intensive approach to device calibration was a disincentive to large scale multi-participant studies.
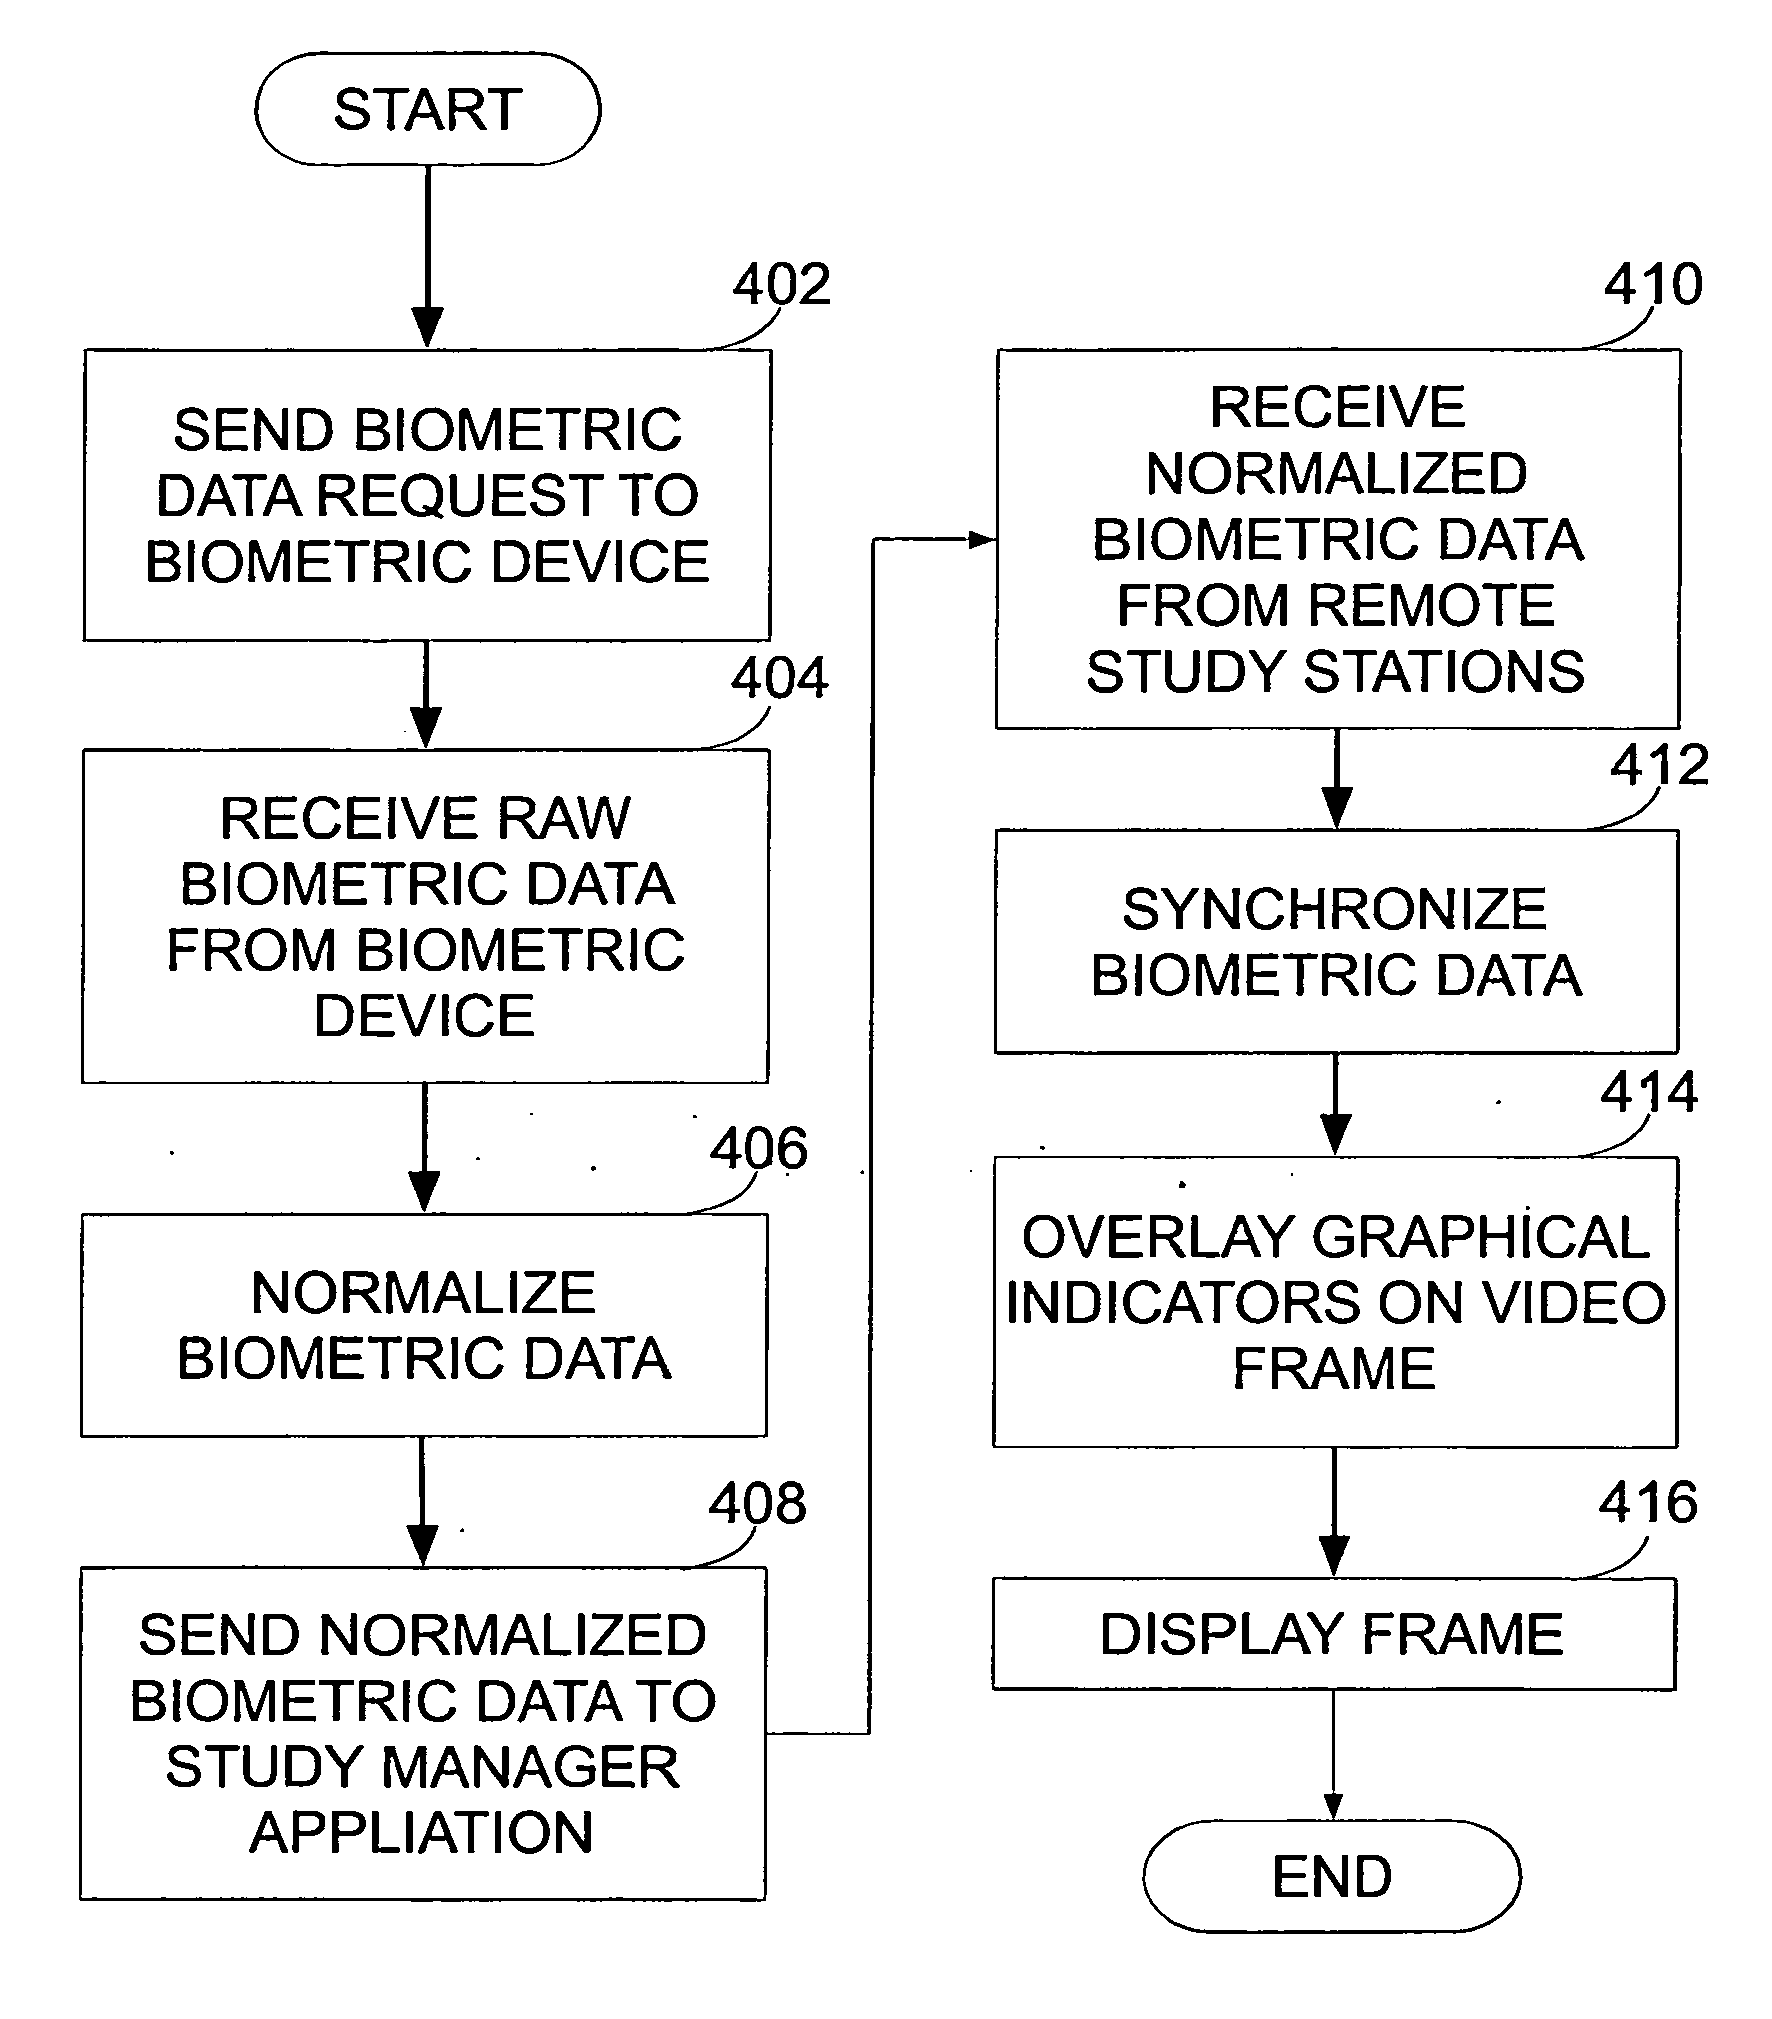
Traditional systems and methods did not provide a practical way to overlay a recorded stimulus with both a base set of biometric data and a participant's biometric data such that the divergence by the participant from the standard could be easily observed at every point in the test in real-time.
Further, it was very complex to collect participant data over an extended period of time which made the accurate and consistent overlaying of data on a recorded stimulus and the identification of base biometric data difficult.

Method used


Image

  • Multiple simultaneous biometric data acquisition and display system and method of use
  • Multiple simultaneous biometric data acquisition and display system and method of use
  • Multiple simultaneous biometric data acquisition and display system and method of use

Examples


Embodiment Construction

[0057]Broadly, this disclosure is directed towards a method and system for multiple simultaneous biometric data acquisition and display. The following description provides examples, and is not limiting of the scope, applicability, or configuration set forth in the claims. Changes may be made in the function and arrangement of elements discussed without departing from the spirit and scope of the disclosure. Various embodiments may omit, substitute, or add various procedures or components as appropriate. For instance, the methods described may be performed in an order different from that described, and various steps may be added, omitted, or combined. Also, features described with respect to certain embodiments may be combined in other embodiments.

[0058]Certain embodiments of the invention are described with reference to methods, apparatus (systems) and computer program products that can be implemented by computer program instructions. These computer program instructions can be provid...


PUM


Abstract

Systems and methods are disclosed for collecting and displaying biometric data associated with multiple individuals in real-time, including multiple computer stations, hardware for collecting raw biometric data, software for calibrating biometric devices, software for normalizing and transferring biometric data, and software for processing and displaying biometric data. In one embodiment, the system further includes software for generating graphical indicators that correspond to specific locations on a stimulus video, overlaying those graphical indicators on individual video frames of the stimulus video, and displaying the overlaid stimulus video. The system further includes software enabling real-time interaction with the display of the biometric data based on segregating participants according to meta-data values.

Description

CROSS-REFERENCE TO RELATED APPLICATIONS[0001]The present application for patent claims priority through the applicant's prior provisional patent application, entitled A Method And System For Multiple Simultaneous Acquisition And Display Of Biometric Data, Ser. No. 61 / 563,307, filed Nov. 23, 2011, which provisional application is hereby incorporated by reference in its entirety.COMPUTER PROGRAM LISTING APPENDIX[0002]This application includes a transmittal under 37 C.F.R. Sec. 1.52(e) of a Computer Program Listing Appendix stored on each of two duplicate compact disks which accompany this Specification. Each disk contains computer program listings which illustrate implementations of the invention, and is herein incorporated by reference. The computer program in the Computer Program Listing Appendix is written in C#. The listings are recorded as ASCII text in IBM PC, MS Windows compatible files which have the directory structures, creation dates and times, sizes (in bytes), and names l...

Claims


Application Information

Patent Timeline
Patent Type & Authority Applications(United States)
IPC IPC(8): G06T11/00
CPCG06F19/3418G06T11/00G16H30/40
Inventor NICHOLS, RONALD G.RASMUSSEN, TRISTAN
Owner VIZKINECT
Why Eureka
Try Eureka