Heparin Concentration and Heparin Response Imbalance Determination Method Within a Fluid Containing Heparin

Inactive Publication Date: 2013-12-26
VISCELL
View PDF2 Cites 1 Cited by
  • Summary
  • Abstract
  • Description
  • Claims
  • Application Information

AI Technical Summary

Benefits of technology

The methods and systems described in this patent allow for more efficient, reliable, and precise monitoring of heparin concentration and its response to abnormal activity. This is achieved by using two separate parameters that are related to different aspects of the coagulation model. A weighted average is also used to combine the individual results for heparin concentration, which takes into account the variation of the estimates. This approach compensates for changes in heparin concentration estimates across the range of concentrations. Overall, this patent provides a better understanding of heparin and its response to heparin by individuals.

Problems solved by technology

This physiological process, coagulation, is complex and involves multiple chemical reactions that progress sequentially.
Modeling the coagulation process from the perspective of a Global Hemostasis Monitor is not straightforward because each device incorporates different terminology to characterize the clot integrity and report test results.
Proper dosing of heparin during treatment improves patient outcomes since under-administration elevates the risk of forming unwanted blood clots and over-administration elevates the risk of bleeding.
A limitation of heparin monitoring tests based on measuring only T is imprecision to actual heparin concentration due to multiple sources of measurement variance.
While heparin neutralization testing with the ΔT result substantially eliminates patient to patient variance when the heparin concentration is zero, ΔT does not correct patient to patient variance in response to increasing heparin concentrations.
However, heparinase testing as introduced by Folkman in U.S. Pat. No. 4,795,703 has not achieved significant market success in managing heparin administration.
Also, heparinase testing is more expensive and running two tests is more complicated than running a single test on a blood sample.
During heparin therapy, some patients still bleed, blood component circuits occasionally occlude with blood clots, some patients still develop blood clots in repaired vessels, and thrombosis is a risk that can cause organ damage, stroke or death.
Global Hemostasis Monitors have been available for many years but have only found limited use within heparin management.
It is important to note that a multivariable linear regression is based on the assumption that T and R are independent variables and the heparin concentration is a function of T and R. This approach did show slight improvement in statistical correlation, but is flawed because T and R are not independent variables.
However, even this test has patient to patient variations in results, is expensive, and is not available as a point of care test for immediate patient management needs.
The anti-Xa offers precision but does not meet user requirements for convenience, cost, and processing time.
This technique is complicated and expensive.
Further, protamine titration provides limited accuracy since individual titration points are discrete which limits resolution.
Also, test cartridges typically only cover a limited heparin range; if heparin concentrations are above or below the test range, test results are inconclusive.
That method is a new variation of protamine titration and little is known about cost or performance.
If the intended anticoagulant effect is not achieved after heparin administration, the patient is at elevated risk for thrombosis or bleeding.
This type of heparin resistance is associated with abnormal performance during the Clot Formation Phase; currently, this type of heparin resistance identification is not practiced clinically.

Method used


Image

  • Heparin Concentration and Heparin Response Imbalance Determination Method Within a Fluid Containing Heparin
  • Heparin Concentration and Heparin Response Imbalance Determination Method Within a Fluid Containing Heparin
  • Heparin Concentration and Heparin Response Imbalance Determination Method Within a Fluid Containing Heparin

Examples


example 1

Single Channel Embodiment

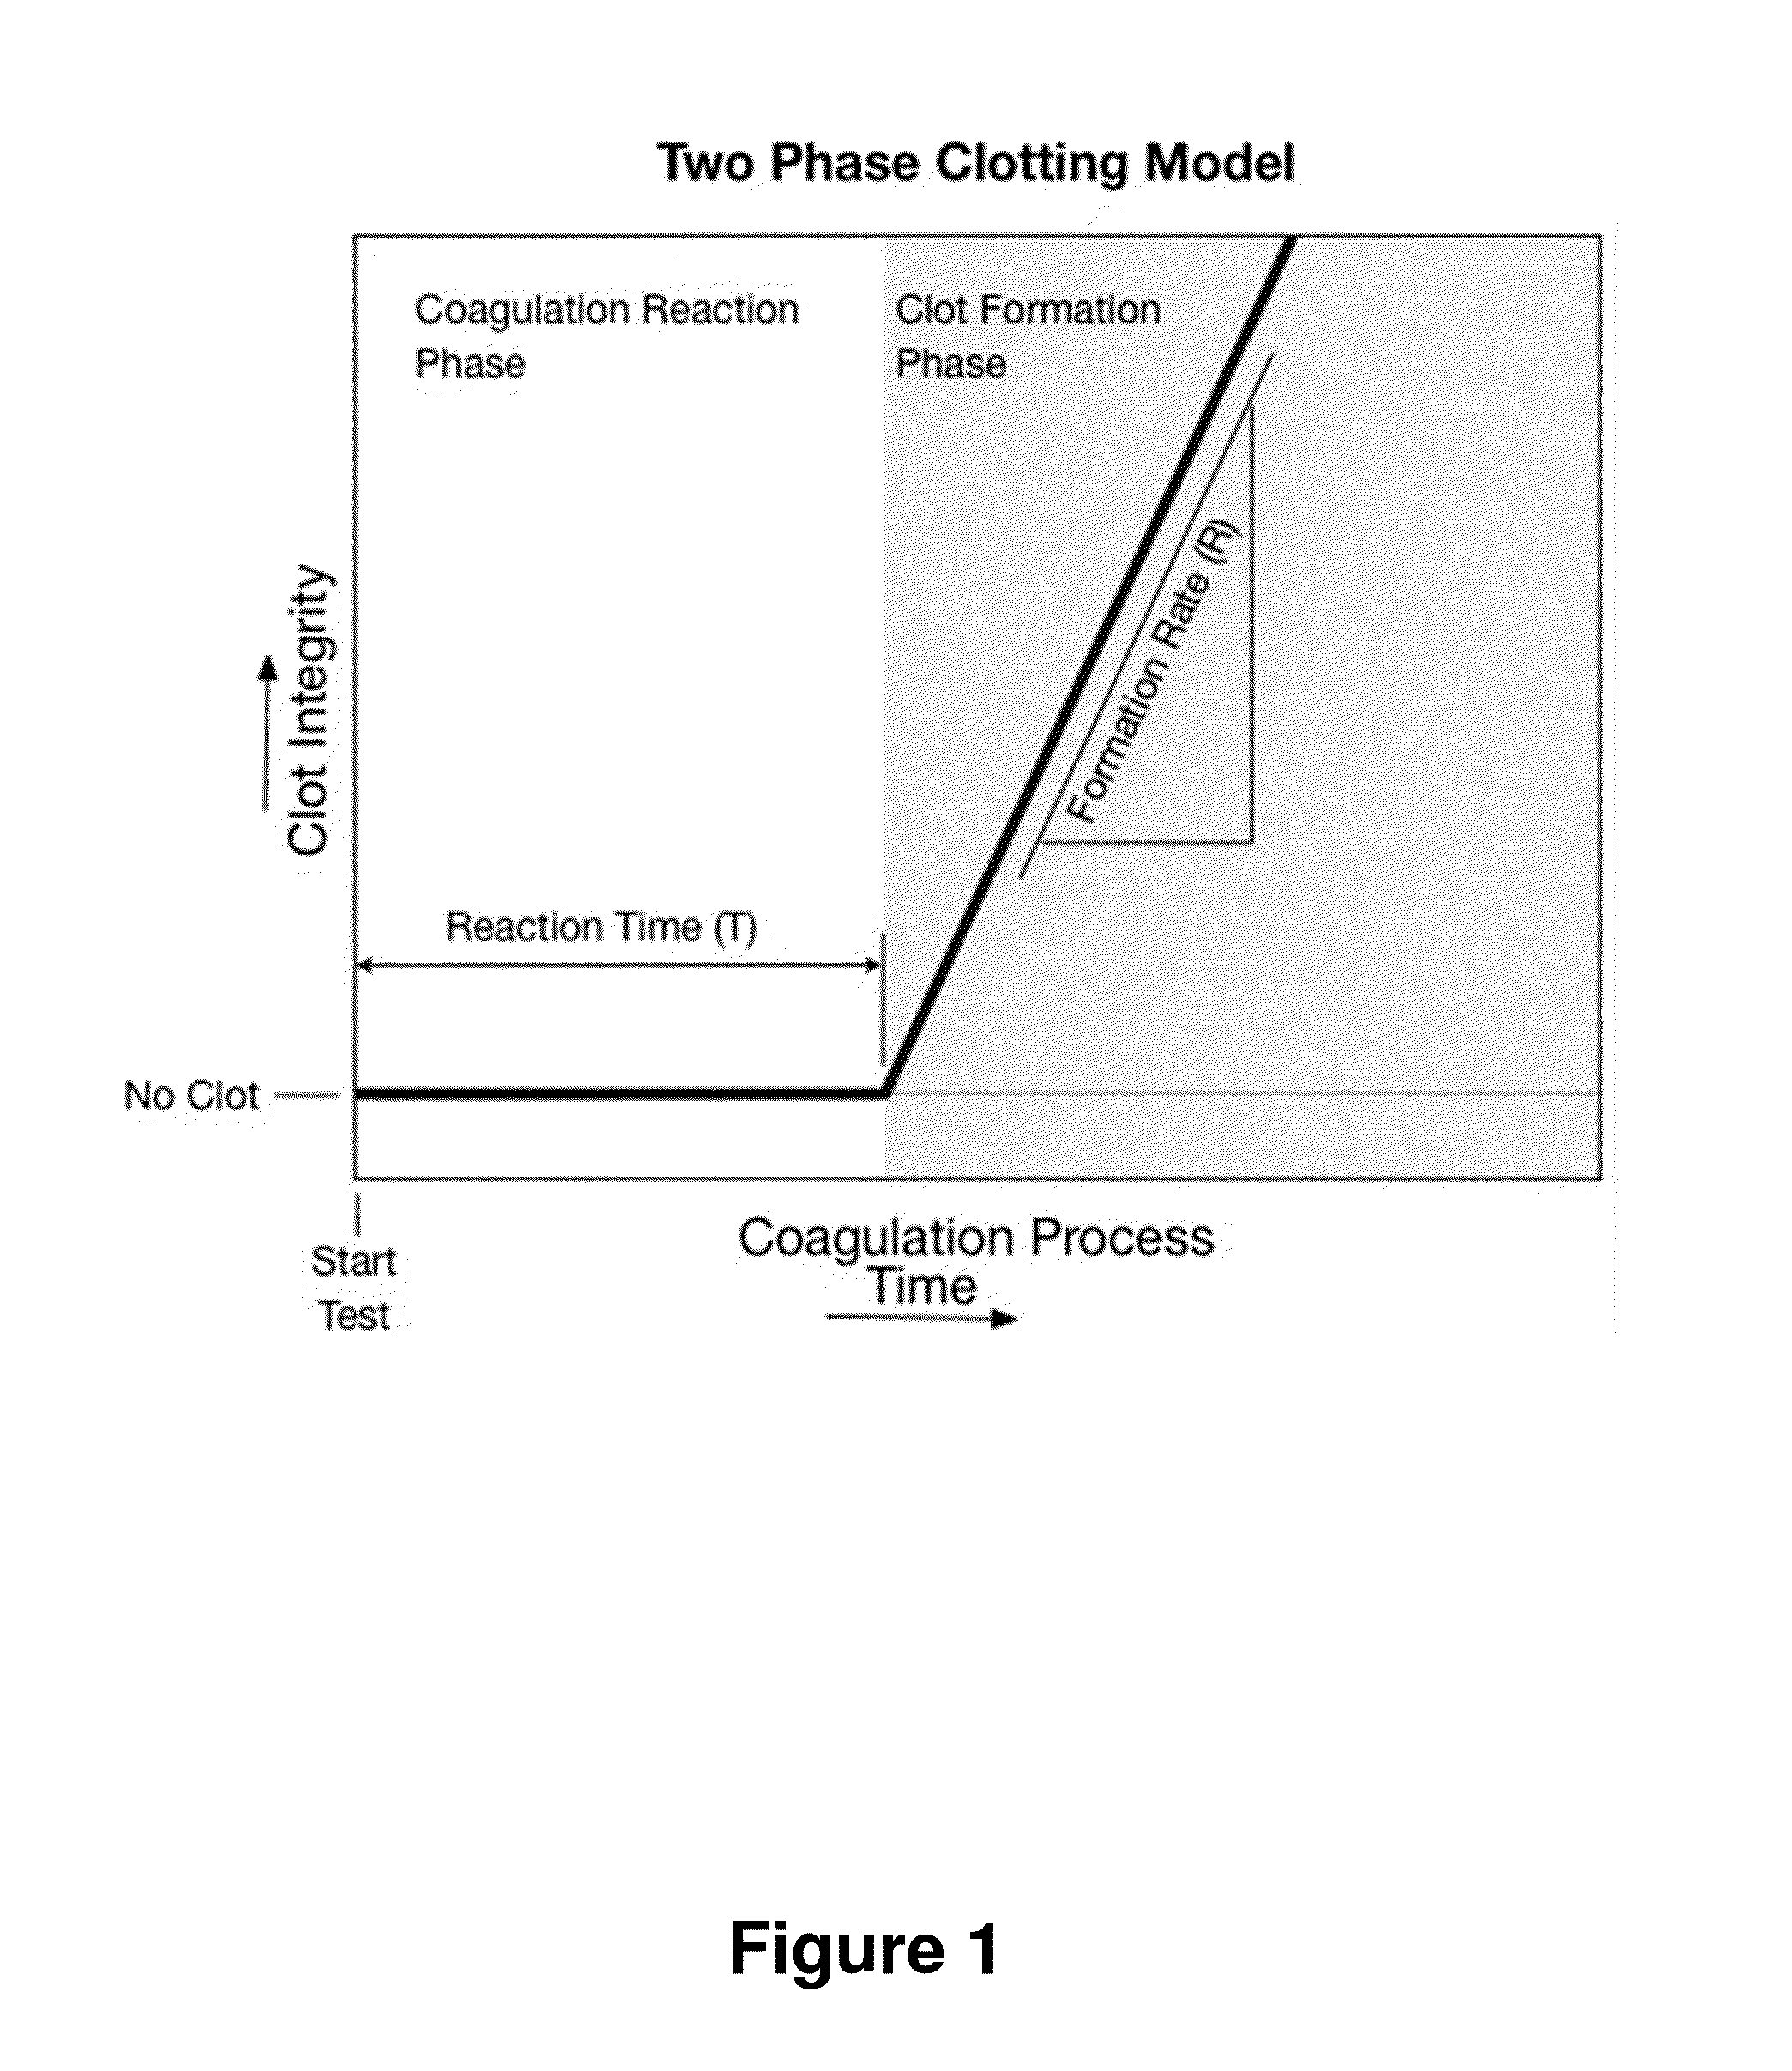
[0054]A simple embodiment of the heparin concentration or heparin response imbalance method is implemented on a single channel instrument. The implementation requires an instrument capable of measuring multiple aspects of the two-phase coagulation model, such as T and R results. The instrument calculates a heparin concentration from the T and R results. The instrument can be calibrated to calculate heparin concentration estimates in either whole blood or plasma. The process utilizes two separate procedures: a calibration procedure that derives the relationships between T and R results and heparin concentration in either whole blood or plasma, and a test analysis procedure that runs a test, calculates T and R, and then calculates a heparin concentration estimate based on the T and R results.

[0055]The single channel embodiment procedure for running a test and calculating a heparin concentration in whole blood is described in the flow chart contained in FIG. 5....

example 2

Two Channel Embodiment

[0066]FIG. 9 shows another embodiment of the method. Here, two tests are run for each blood sample: one sample run on the instrument and a second sample run on the instrument after first neutralizing or removing the heparin. In this test analysis, the two Reaction Times, T and TØh, the Reaction Time without heparin, are used to make an improved estimate, HW(T,TØh), the heparin concentration estimate that characterizes the Coagulation Reaction Phase performance. T and TØh results are combined to generate an estimate that corrects for patient to patient variability in T when no heparin is present. In this embodiment, HW(T,TØh) is implemented using ΔT, the difference: T−TØh; thus HW(T,TØh) is implemented with HW(ΔT). HW(T,TØh) has lower variance than HW(T) at low heparin levels. However, HW(T,TØh) has less variance than HW(T) only at low heparin concentrations.

[0067]The two Reaction Rates, R and RØh, the Formation Rate without heparin, are used to make an improved...

example 3

Calibration Equations

[0073]FIGS. 7, 8, 11, and 12 show examples where an improved estimation of heparin concentration is obtained from two or more estimates of the heparin concentration. In these examples heparin concentration estimation equations are used to determine two or more heparin concentration estimates from [T, R] or [T, R, TØh, RØh] test results. Additionally, a variance weighted average of the individual heparin concentration estimates is used to determine a final heparin concentration result. The most precise combined estimate from multiple independent estimates is achieved when the weight used for an individual estimate is equal to the inverse of the variance of the estimate. Estimates with lower variance contribute greater weight than estimates with higher variance. During calibration, the standard error of each intermediate result is estimated as a function of the corresponding initial heparin parameter. The weight is the inverse of the square of the standard error.

[...


PUM

PropertyMeasurementUnit
Weightaaaaaaaaaa
Concentrationaaaaaaaaaa
Viscosityaaaaaaaaaa

Abstract

Provided herein are various methods for determining heparin concentration or heparin response imbalance in native whole blood, citrated whole blood, or plasma by measuring two parameters that characterize each phase of a two-phase coagulation response, such as a time period until clot formation initiation and a post-initiation clot formation.

Description

CROSS-REFERENCE TO RELATED APPLICATION[0001]This application claims benefit to U.S. Provisional Patent 61 / 658,139 filed Jun. 11, 2012, which is specifically incorporated by reference.BACKGROUND OF THE INVENTION[0002]Blood has the ability to change from a liquid into a clot. This physiological process, coagulation, is complex and involves multiple chemical reactions that progress sequentially. The coagulation process is typically quantified by adding an activator to a blood sample and measuring the time period between activation and initial clot formation. While various activators are used to characterize different aspects of coagulation, these tests share a common testing methodology of measuring a time period and using this time result to characterize coagulation performance.[0003]Most historical devices for characterizing clotting involve chemically activating the clotting process, automatically detecting the resulting clot, and timing the process until the clot is detected. Herei...

Claims


Application Information

Patent Timeline
IPC IPC(8): G01N33/86
CPCG01N33/86G01N33/54373G01N33/94G01N2400/40G01N33/4905
Inventor HENDERSON, JON HARRYDEBIASE, BARBARA ANN
Owner VISCELL
Why Eureka
Try Eureka