
Medical devices with coatings for enhanced echogenicity

a technology of echogenicity and medical devices, applied in the field of medicine, physics and biotechnology, can solve the problems of increasing scattering, better visibility of medical objects, and decreasing the visibility of objects, and achieve the effect of best visibility of objects

Active Publication Date: 2015-12-10
ENCAPSON
View PDF4 Cites 1 Cited by
  • Summary
  • Abstract
  • Description
  • Claims
  • Application Information

AI Technical Summary

Benefits of technology

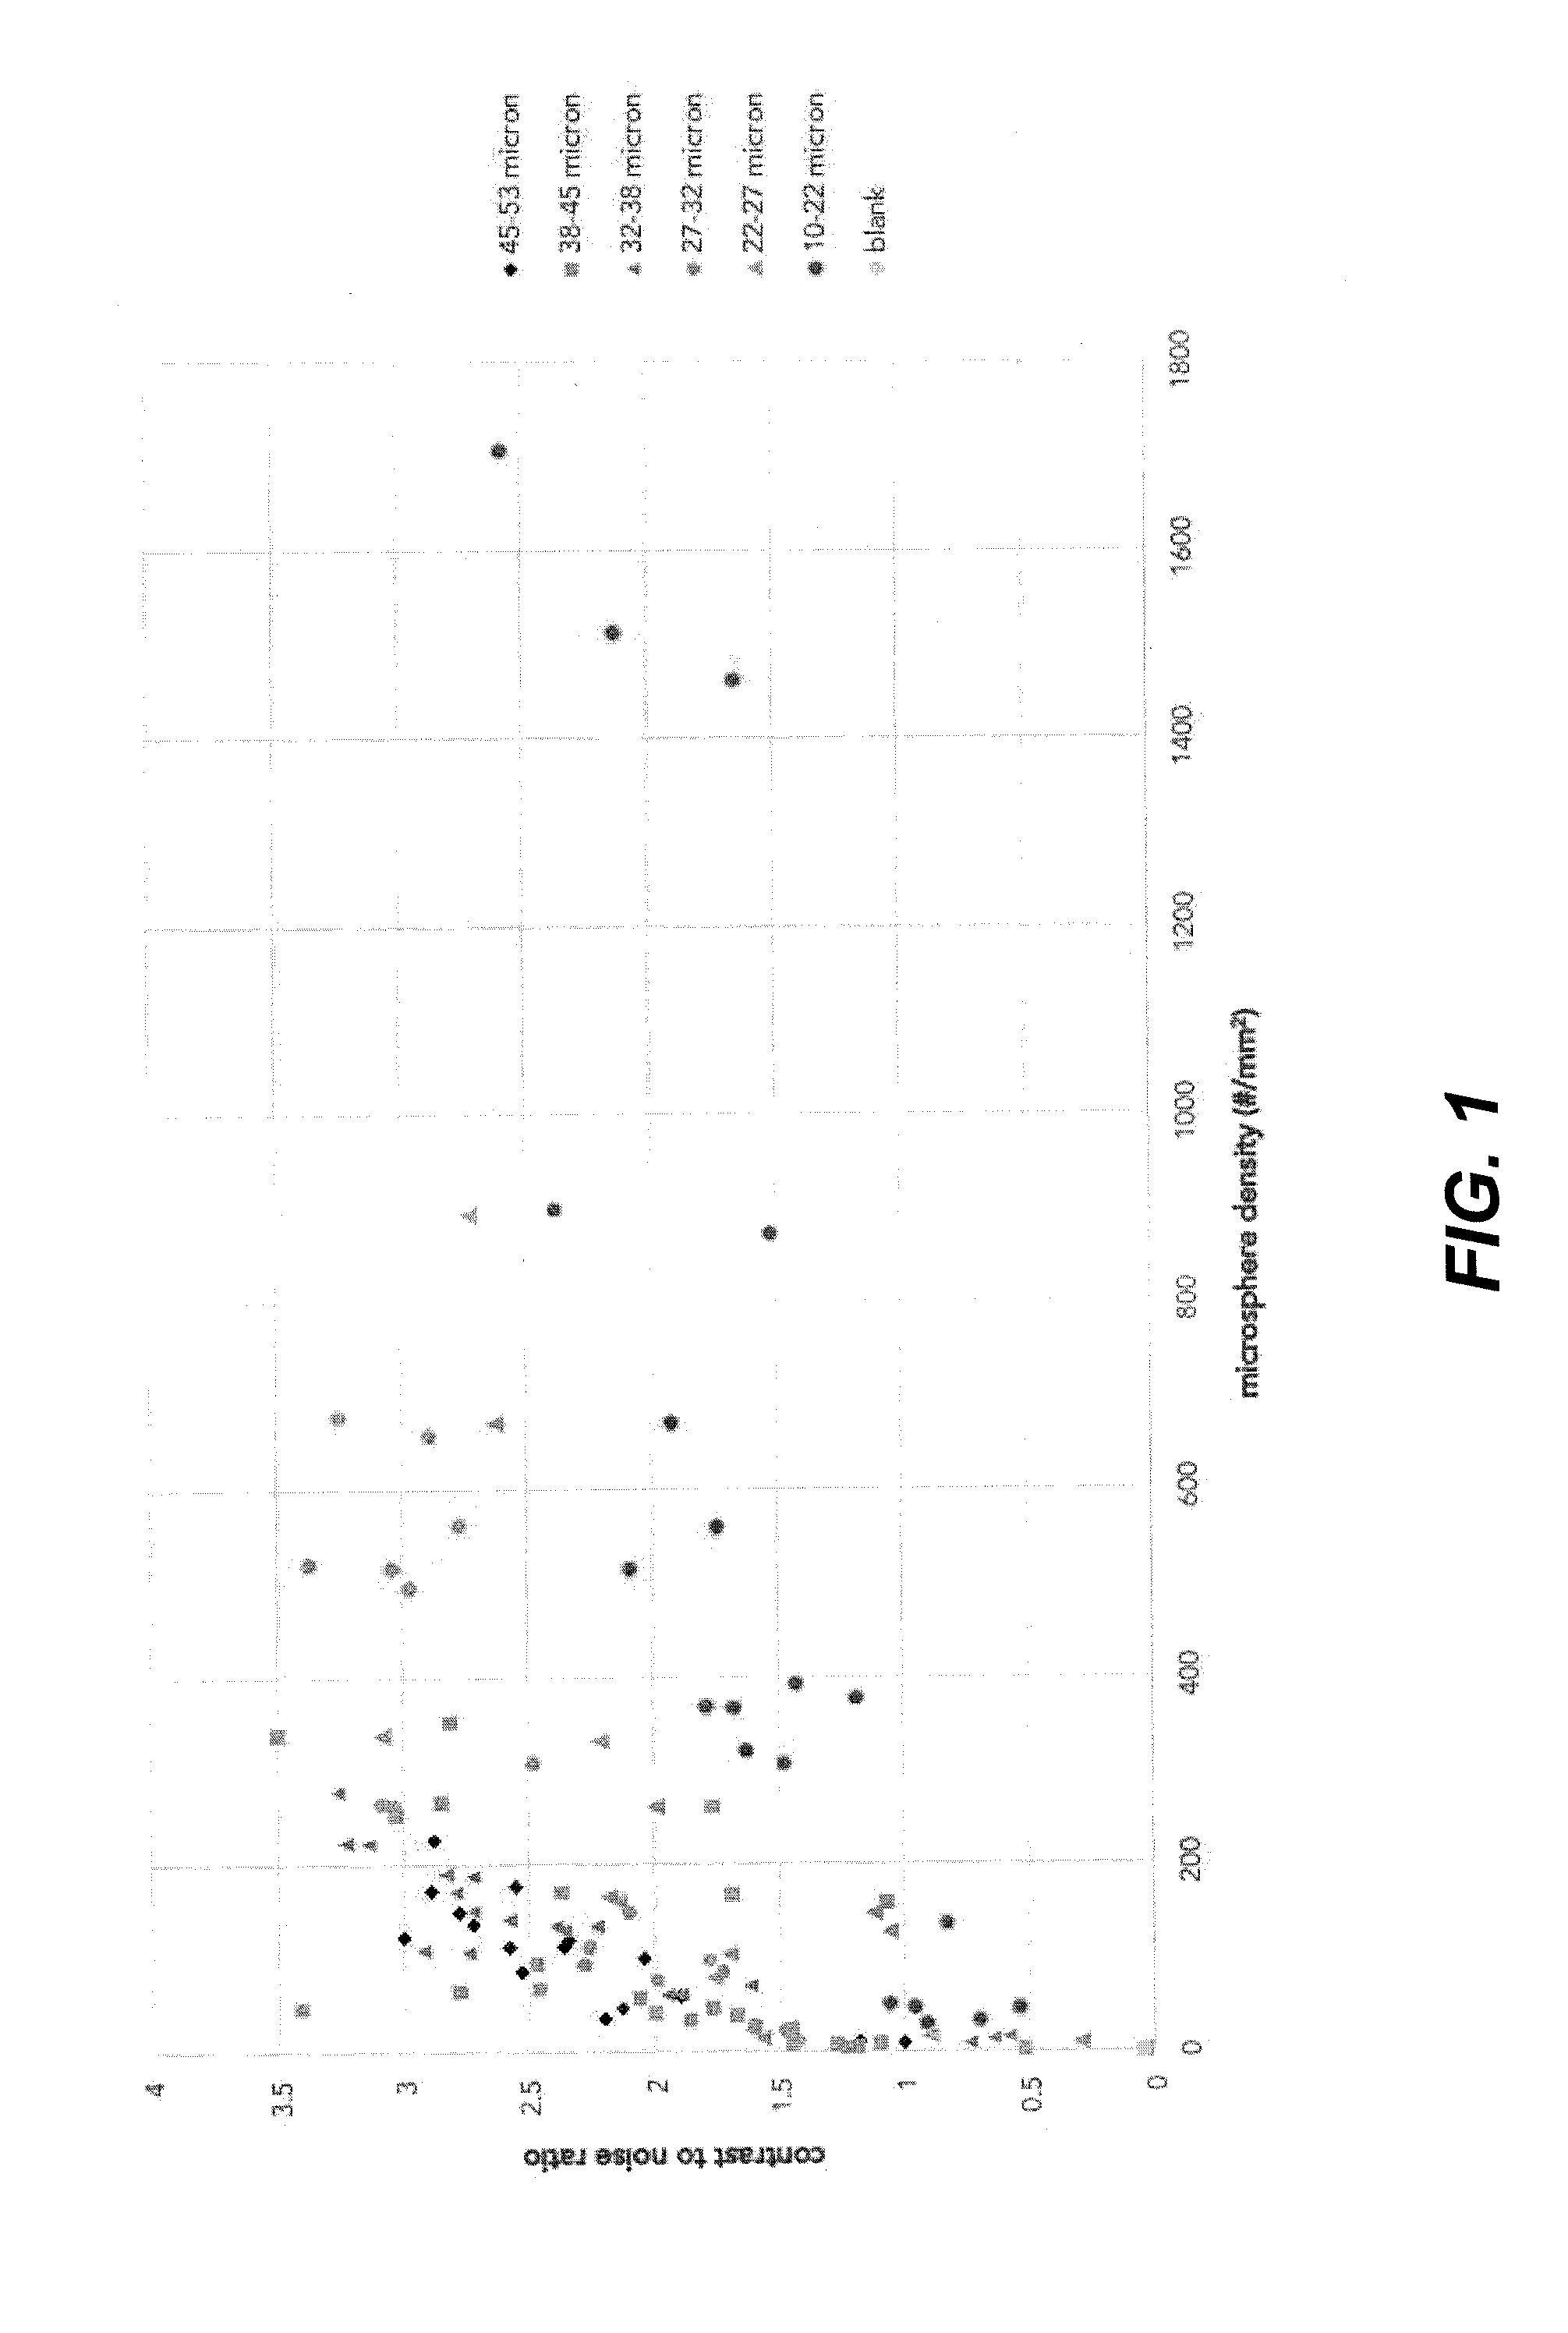
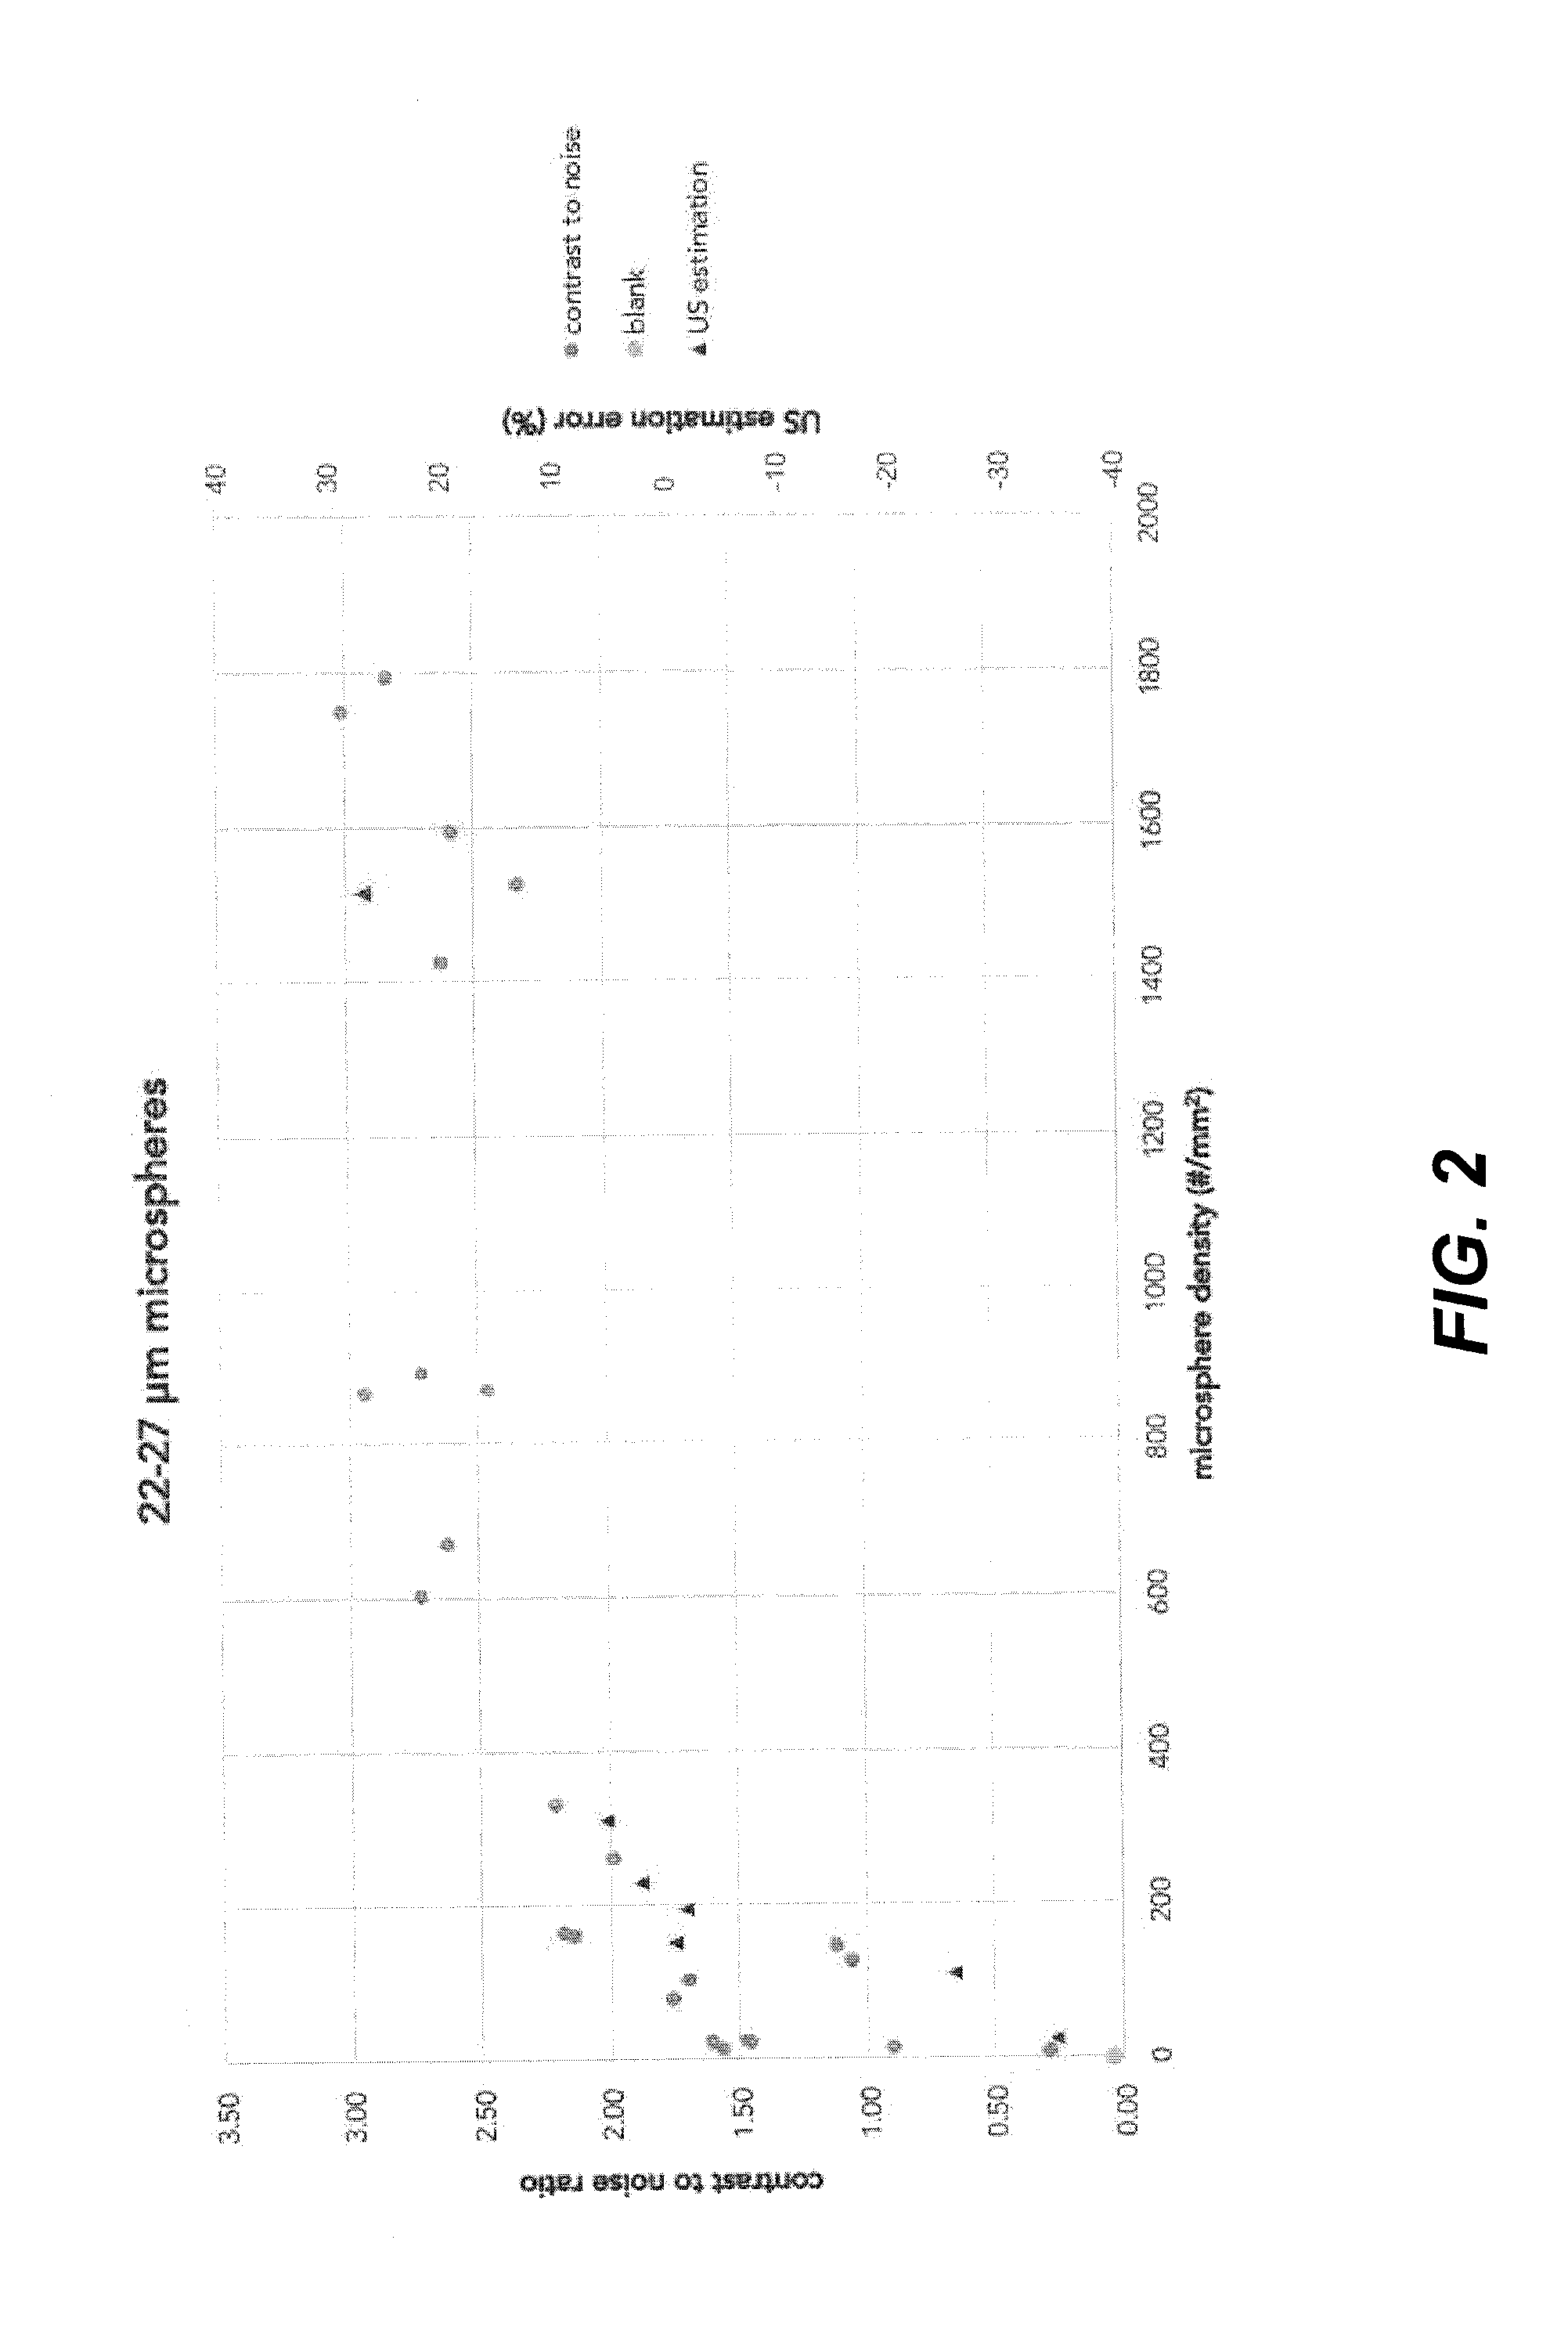
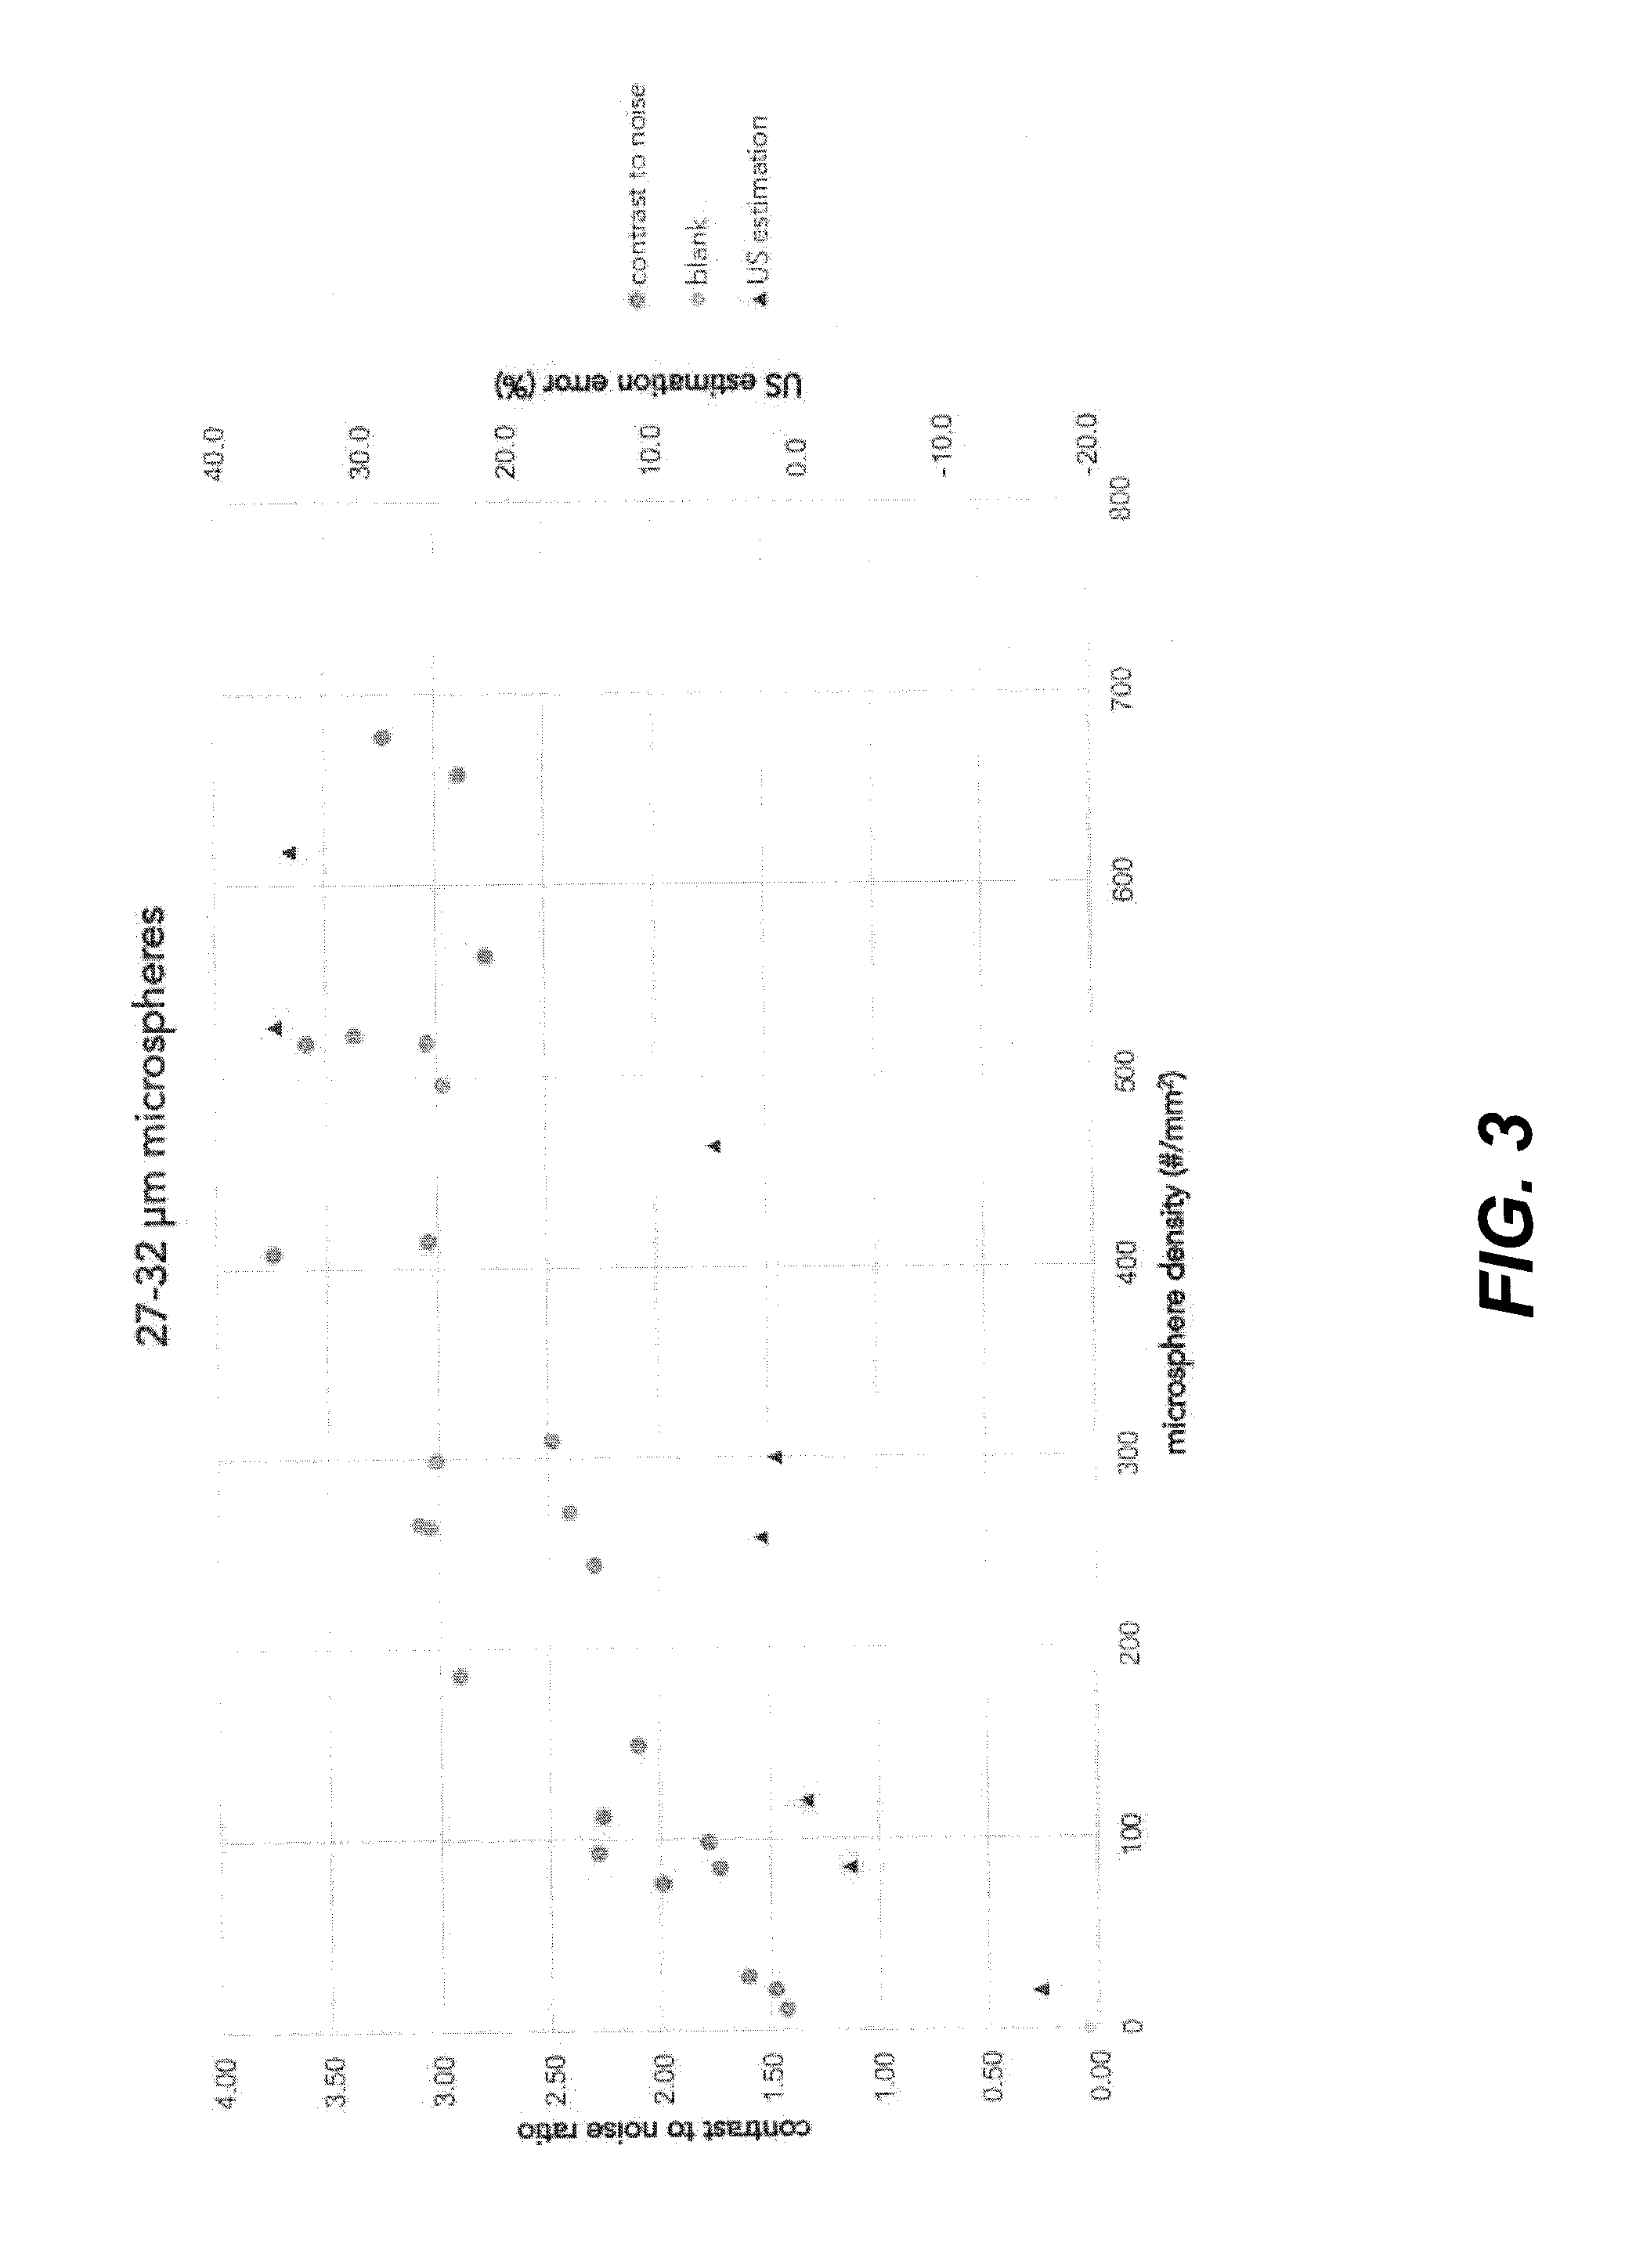
The patent text provides optimal conditions for ultrasound imaging by discussing the importance of echogenic microparticles on a medical device. The study found that particles with a diameter between 10 and 45 μm and a density between 45 and 450 particles / mm2 provide the best visibility of the coated object during ultrasound imaging. The optimal particle density is important for accurately locating the object and determining its size. The study also explains that a higher reflectivity of ultrasound waves does not always result in better visibility and can lead to an overestimation of the object size, making it harder for a user to determine its exact location. The patent text suggests that an optimal number of particles on the surface of the device is important for improving ultrasound imaging and achieving a sharp image.

Problems solved by technology

Hence, a higher reflectivity of ultrasound waves does not always result in a better visibility of a medical object.
The boundaries between the object and the environment become more vague, thereby decreasing the visibility of the object.
However, when the number of particles increases beyond an optimum point, the scattering is further increased, but the ultrasound image of the device becomes larger and less defined, leading to a less defined or less sharp image on the screen.
This results in an overestimation of the size of the device, the appearance of ultrasound artifacts and a less-defined ultrasound image for a user.
For practical reasons, such high particle densities are normally not used on medical devices because it would become problematic to bind such high amounts of particles to a surface.
What is not realized in Couture et al., however, is the insight of this disclosure that the amount of reflectivity of the ultrasound particles does not always correlate to the visibility of the device in a patient.
In this case, the user will overestimate the size of the device and lose accuracy.

Method used


Image

  • Medical devices with coatings for enhanced echogenicity
  • Medical devices with coatings for enhanced echogenicity
  • Medical devices with coatings for enhanced echogenicity

Examples


example 1

[0091]Commercially available solid glass microspheres (from Cospheric) with diameters ranging from 10 to 22 μm, 22 to 27 μm, 27 to 32 μm, 32 to 38 μm, 38 to 45 μm and 45 to 53 μm, all with a density of 2.5 g / mL, were mixed through a polyurethane coating matrix. The microspheres were added in different amounts in order to prepare mixtures containing 0.5 to 75.0 vol. % microspheres in the coating matrix. Subsequently, either 30- or 60-μm thick coating films were drawn on both glass and PEBAX® 6233 slides as substrates using a film applicator. The density of microspheres was determined to vary from 2 to 1831 particles / mm2.

[0092]The coated substrates were measured by ultrasound using a 33 mm linear array probe operating in brightness-mode (B-mode) at 6 MHz. The substrates were placed under an approximate angle of 45 degrees inside a commercially available ultrasound phantom, which acted as the medium.

[0093]From the recorded images, the contrast-to-noise ratio (CNR) was determined by com...

example 2

[0101]Commercially available solid glass microspheres with diameters ranging from 10 to 22 μm, 22 to 27 μm, 27 to 32 μm, 32 to 38 μm, 38 to 45 μm and 45 to 53 μm, all with a density of 2.5 g / mL, were mixed through a polyurethane coating matrix. The microspheres were added in different amounts in order to prepare mixtures containing 1.0 to 75.0 vol. % microspheres in the coating matrix. Subsequently, either 30- or 60-μm thick marker bands of coating were drawn on glass slides using a film applicator. These marker bands were applied by masking the area that was required to be uncoated. The width of the marker bands was measured.

[0102]The coated substrates were measured by ultrasound using a 33 mm linear array probe operating in brightness-mode (B-mode) at 6 MHz. The substrates were placed under an approximate angle of 45 degrees inside a commercially available ultrasound phantom, which acted as the medium.

[0103]From the recorded images, the width of the marker bands as visible under u...

example 3

[0114]Solid glass microspheres with a diameter ranging from 38 to 45 μm, as described above, with a density of 2.5 g / mL, were mixed through a polyurethane coating matrix. Subsequently, glass slides and plastic (PEBAX® 6233) were coated with these particles in different densities. The coated substrates were measured by ultrasound using a 33-mm linear array probe operating in brightness-mode (B-mode) at 6 MHz. The substrates were placed under an approximate angle of 45 degrees inside a commercially available ultrasound phantom, which acted as the medium. From the recorded images, the contrast-to-noise ratio (CNR) was determined in the same way as described in Example 1, and the determined CNRs were plotted against the microsphere concentration (FIG. 7).

[0115]As can be seen in FIG. 7, the CNR values for glass and plastic coated with the same amount of particles are comparable. This demonstrates that the material of the used surfaces does not significantly affect the CNRs.


PUM

PropertyMeasurementUnit
Fractionaaaaaaaaaa
Diameteraaaaaaaaaa
Diameteraaaaaaaaaa

Abstract

The disclosure provides medical devices comprising improved coatings for ultrasound detection, which provide optimal ultrasound images. Methods for preparing such devices are also provided.

Description

CROSS-REFERENCE TO RELATED APPLICATIONS[0001]This application is a national phase entry under 35 U.S.C. §371 of International Patent Application PCT / NL2013 / 050779, filed Oct. 31, 2013, designating the United States of America and published in English as International Patent Publication WO 2014 / 070012 A1 on May 8, 2014, which claims the benefit under Article 8 of the Patent Cooperation Treaty and under 35 U.S.C. §119(e) to European Patent Application Serial No. 12190924.6, filed Oct. 31, 2012.TECHNICAL FIELD[0002]The disclosure relates to the fields of medicine, physics and biotechnology.BACKGROUND[0003]In order to precisely locate a medical device such as, for instance, a needle or catheter inside a patient, ultrasound imaging is commonly used. Ultrasound imaging relies on the different ways in which sound waves are reflected from interfaces between substances. Ultrasound waves, with frequencies above the audible range of normal human hearing, typically from 20 kHz up to several gig...

Claims


Application Information

Patent Timeline
IPC IPC(8): A61B8/08A61M29/00A61B17/3205A61L31/10A61M25/10A61M16/04A61L31/08A61B1/00A61B17/29
CPCA61B8/481A61B1/00A61M29/00A61B17/32056A61B17/29A61M25/104A61L2420/02A61L31/088A61L31/10A61B2017/3413A61F2250/0096A61B2019/5425A61B2017/00526A61M16/0472A61L31/128A61L31/18A61L2400/12A61B2090/3925A61B17/34A61L31/08A61L31/14
Inventor VRIEZEMA, DENNIS MANUELAYRES, LEEASRIAN, DAVIDOPSTEEN, JOHANNES ANTONIUS
Owner ENCAPSON
Learn More