Systems and methods of grueneisen-relaxation photoacoustic microscopy and photoacoustic wavefront shaping

a technology of photoacoustic wavefront and relaxation, applied in the field of systems and methods for improving photoacoustic resolution, can solve the problems of insufficient sensitivity of non-radiative absorption contrast images, lack of optically defined axial resolution of confocal microscopic images,

Active Publication Date: 2016-10-20
CALIFORNIA INST OF TECH
View PDF5 Cites 27 Cited by
  • Summary
  • Abstract
  • Description
  • Claims
  • Application Information

AI Technical Summary

Benefits of technology

[0010]The lag interval time is less than a thermal relaxation time of the subject. The lag interval time is less than about 5 μs to about 20 μs. The first laser pulse heats the focus region from a first temperature to a second temperature, where the first temperature and the second temperature are both within a linear temperature range at which the Grueneisen parameter varies linearly with respect to temperature. The linear temperature ranges from about 10° C. to about 55° C. for a biological tissue comprising water, fatty tissues, or any combination thereof. The second temperature is no more than about 5° C. higher than the first temperature. The first laser pulse and the second laser pulse each include a pulse width of less than about 5 ns to about 10 ns. The first laser pulse includes a first laser pulse energy and the second laser pulse includes a second laser pulse energy that is essentially equal to the first laser pulse energy. The second laser pulse energy ranges from about 1% to about 100% of the first laser pulse energy. The first laser pulse and the second laser pulse further include a pulse wavelength ranging from about 400 nm to about 1300 nm. The lateral resolution of the GR-PAM is about 1 / √2 times the lateral resolution of OR-PAM performed using similar process parameters. The lateral resolution of the GR-PAM is less than about 0.5 μm. The axial resolution of the GR-PAM is at least 10 times finer than the axial resolution of OR-PAM performed using similar process parameters. The axial resolution of the GR-PAM is less than about 5 μm. The GR-PAM performs optical sectioning, where an axial FWHM of the GR-PA signal obtained from a planar target is about twice the Rayleigh range of a light beam comprising the first laser pulse and the second laser pulse.

Problems solved by technology

However, confocal microscopic contrast has been limited to back-scattering and fluorescence; it cannot image non-radiative absorption contrast with sufficient sensitivity.
However, like wide-field optical microscopy, OR-PAM lacks optically defined axial resolution when imaging planar objects—i.e., objects wider than the lateral resolution.
Specifically, the frequency dependence of acoustic attenuation limits the usable ultrasound bandwidth, leading to poor axial resolution.
Yet, it is challenging to effectively separate the two-photon PA signal from the predominant single-photon signal.

Method used


Image

  • Systems and methods of grueneisen-relaxation photoacoustic microscopy and photoacoustic wavefront shaping
  • Systems and methods of grueneisen-relaxation photoacoustic microscopy and photoacoustic wavefront shaping
  • Systems and methods of grueneisen-relaxation photoacoustic microscopy and photoacoustic wavefront shaping

Examples


example 1

The Grueneisen-Relaxation Effect

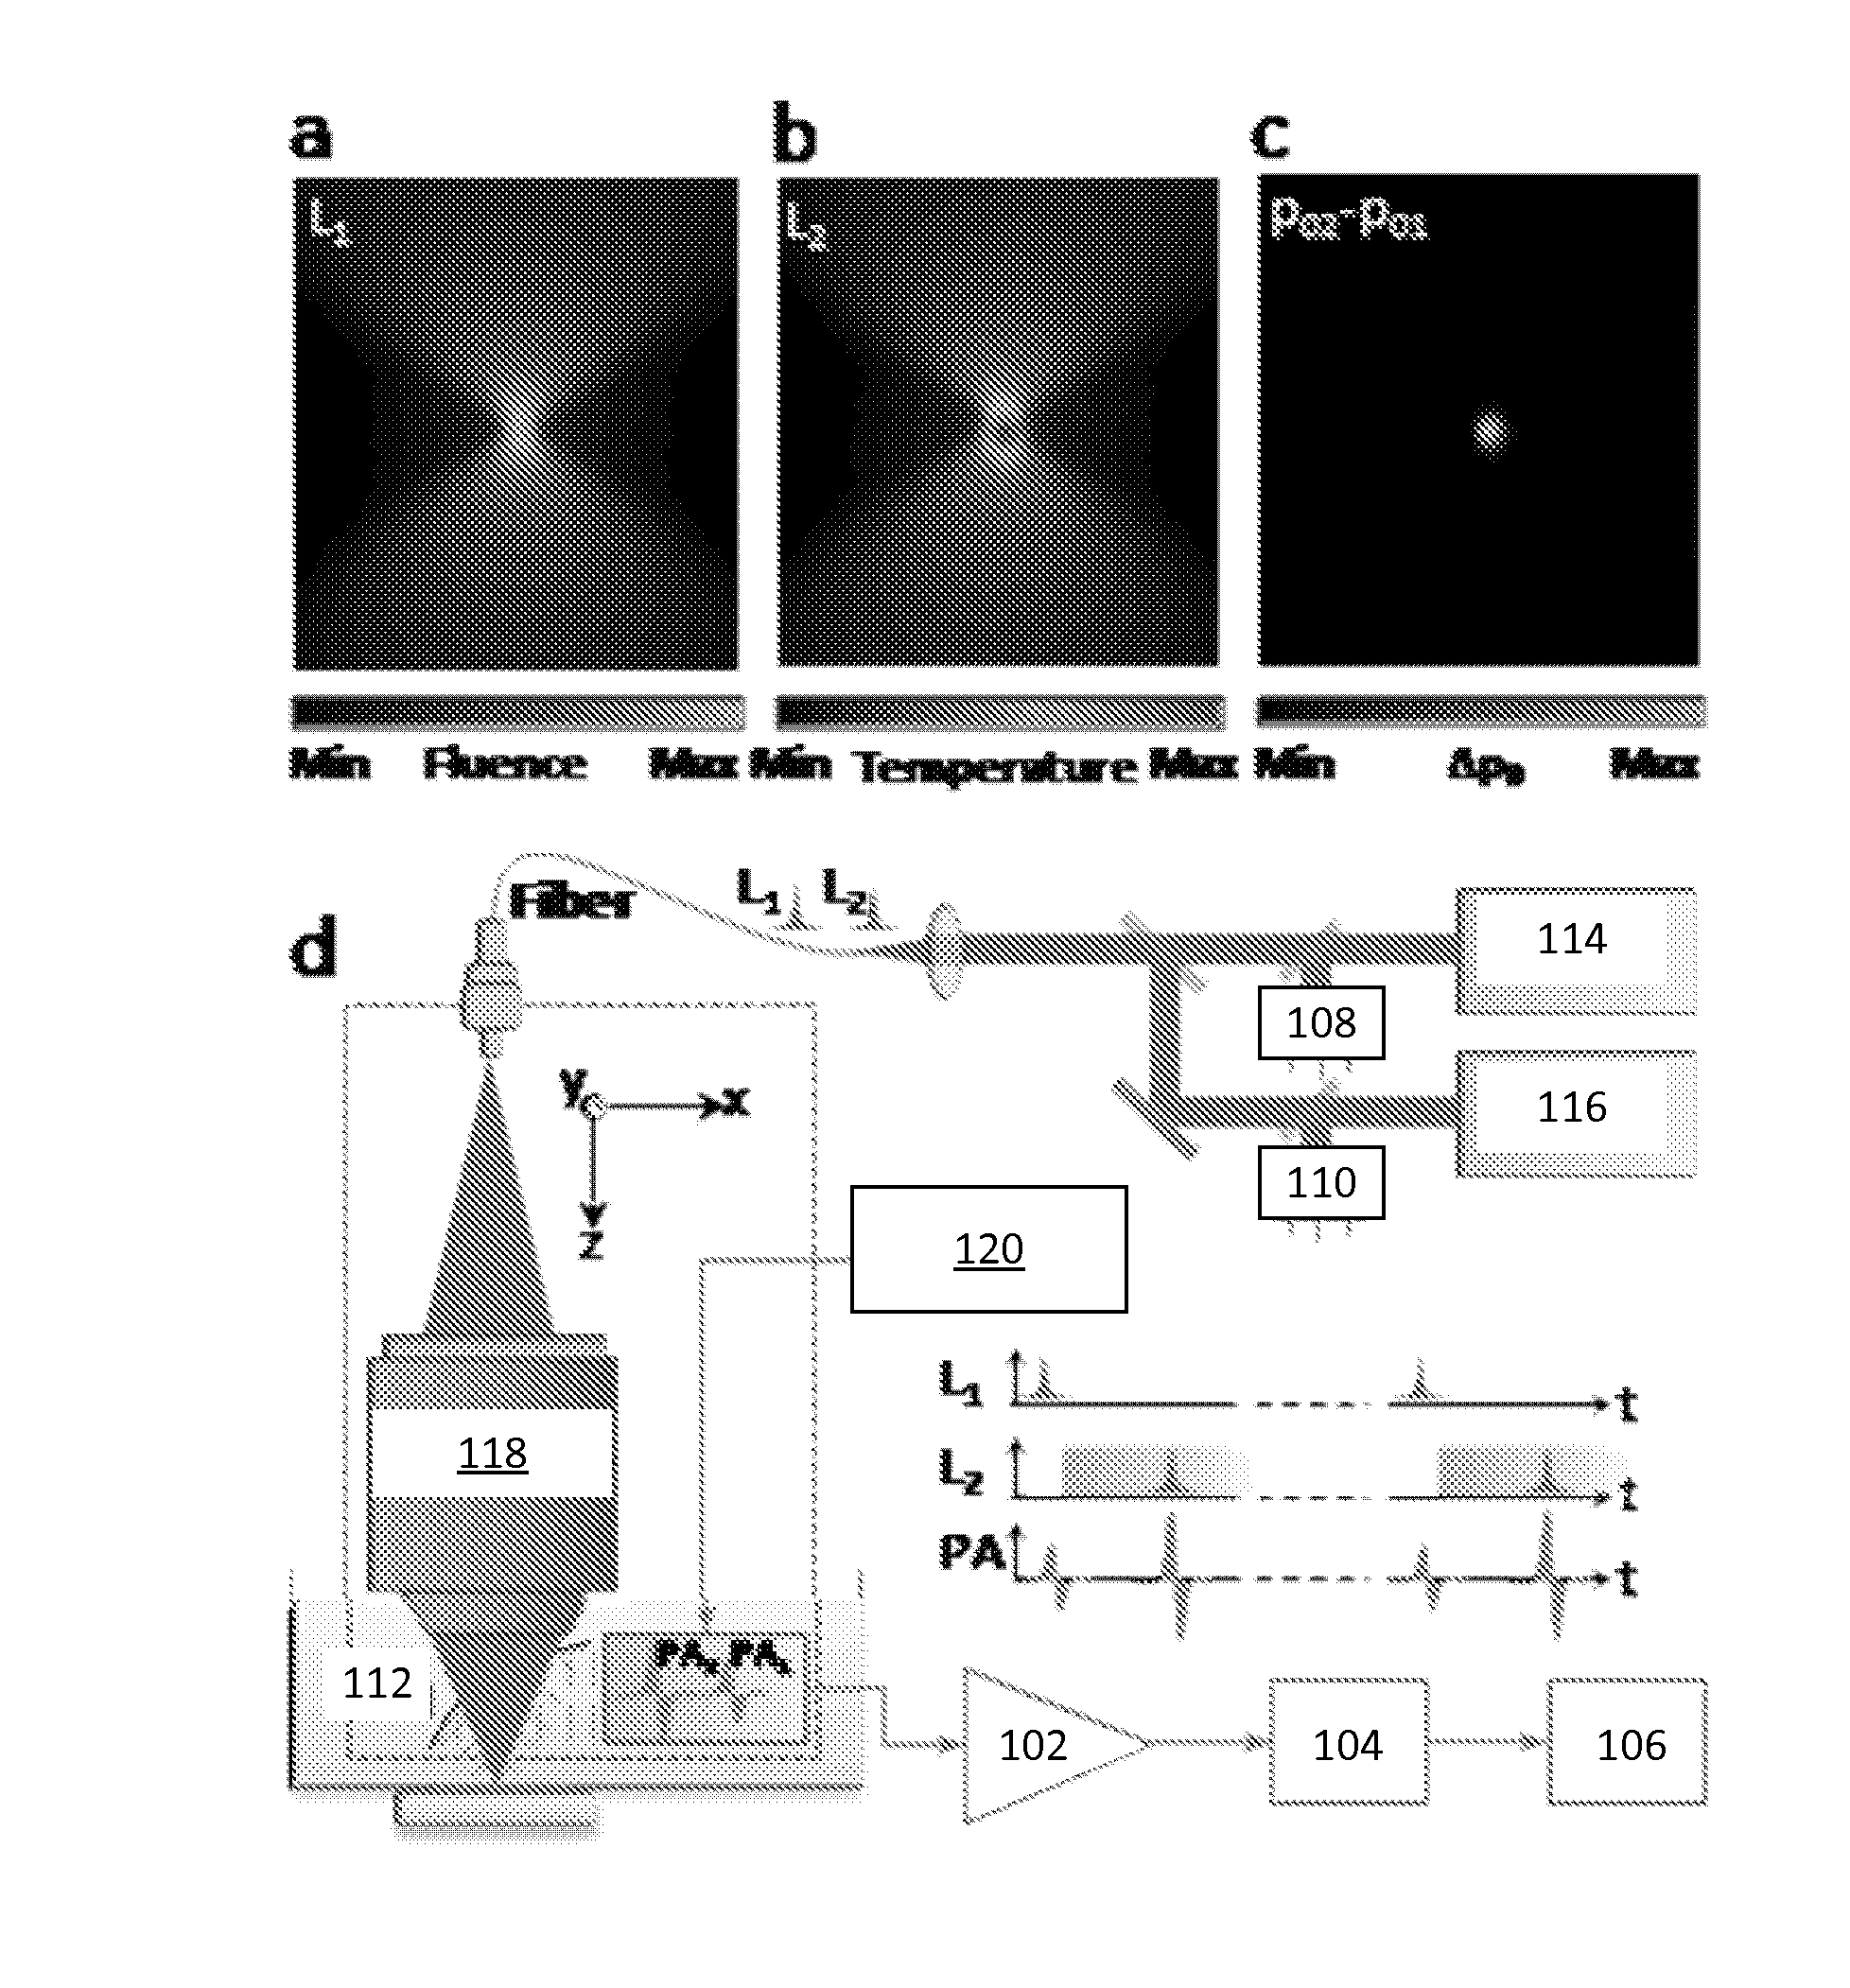
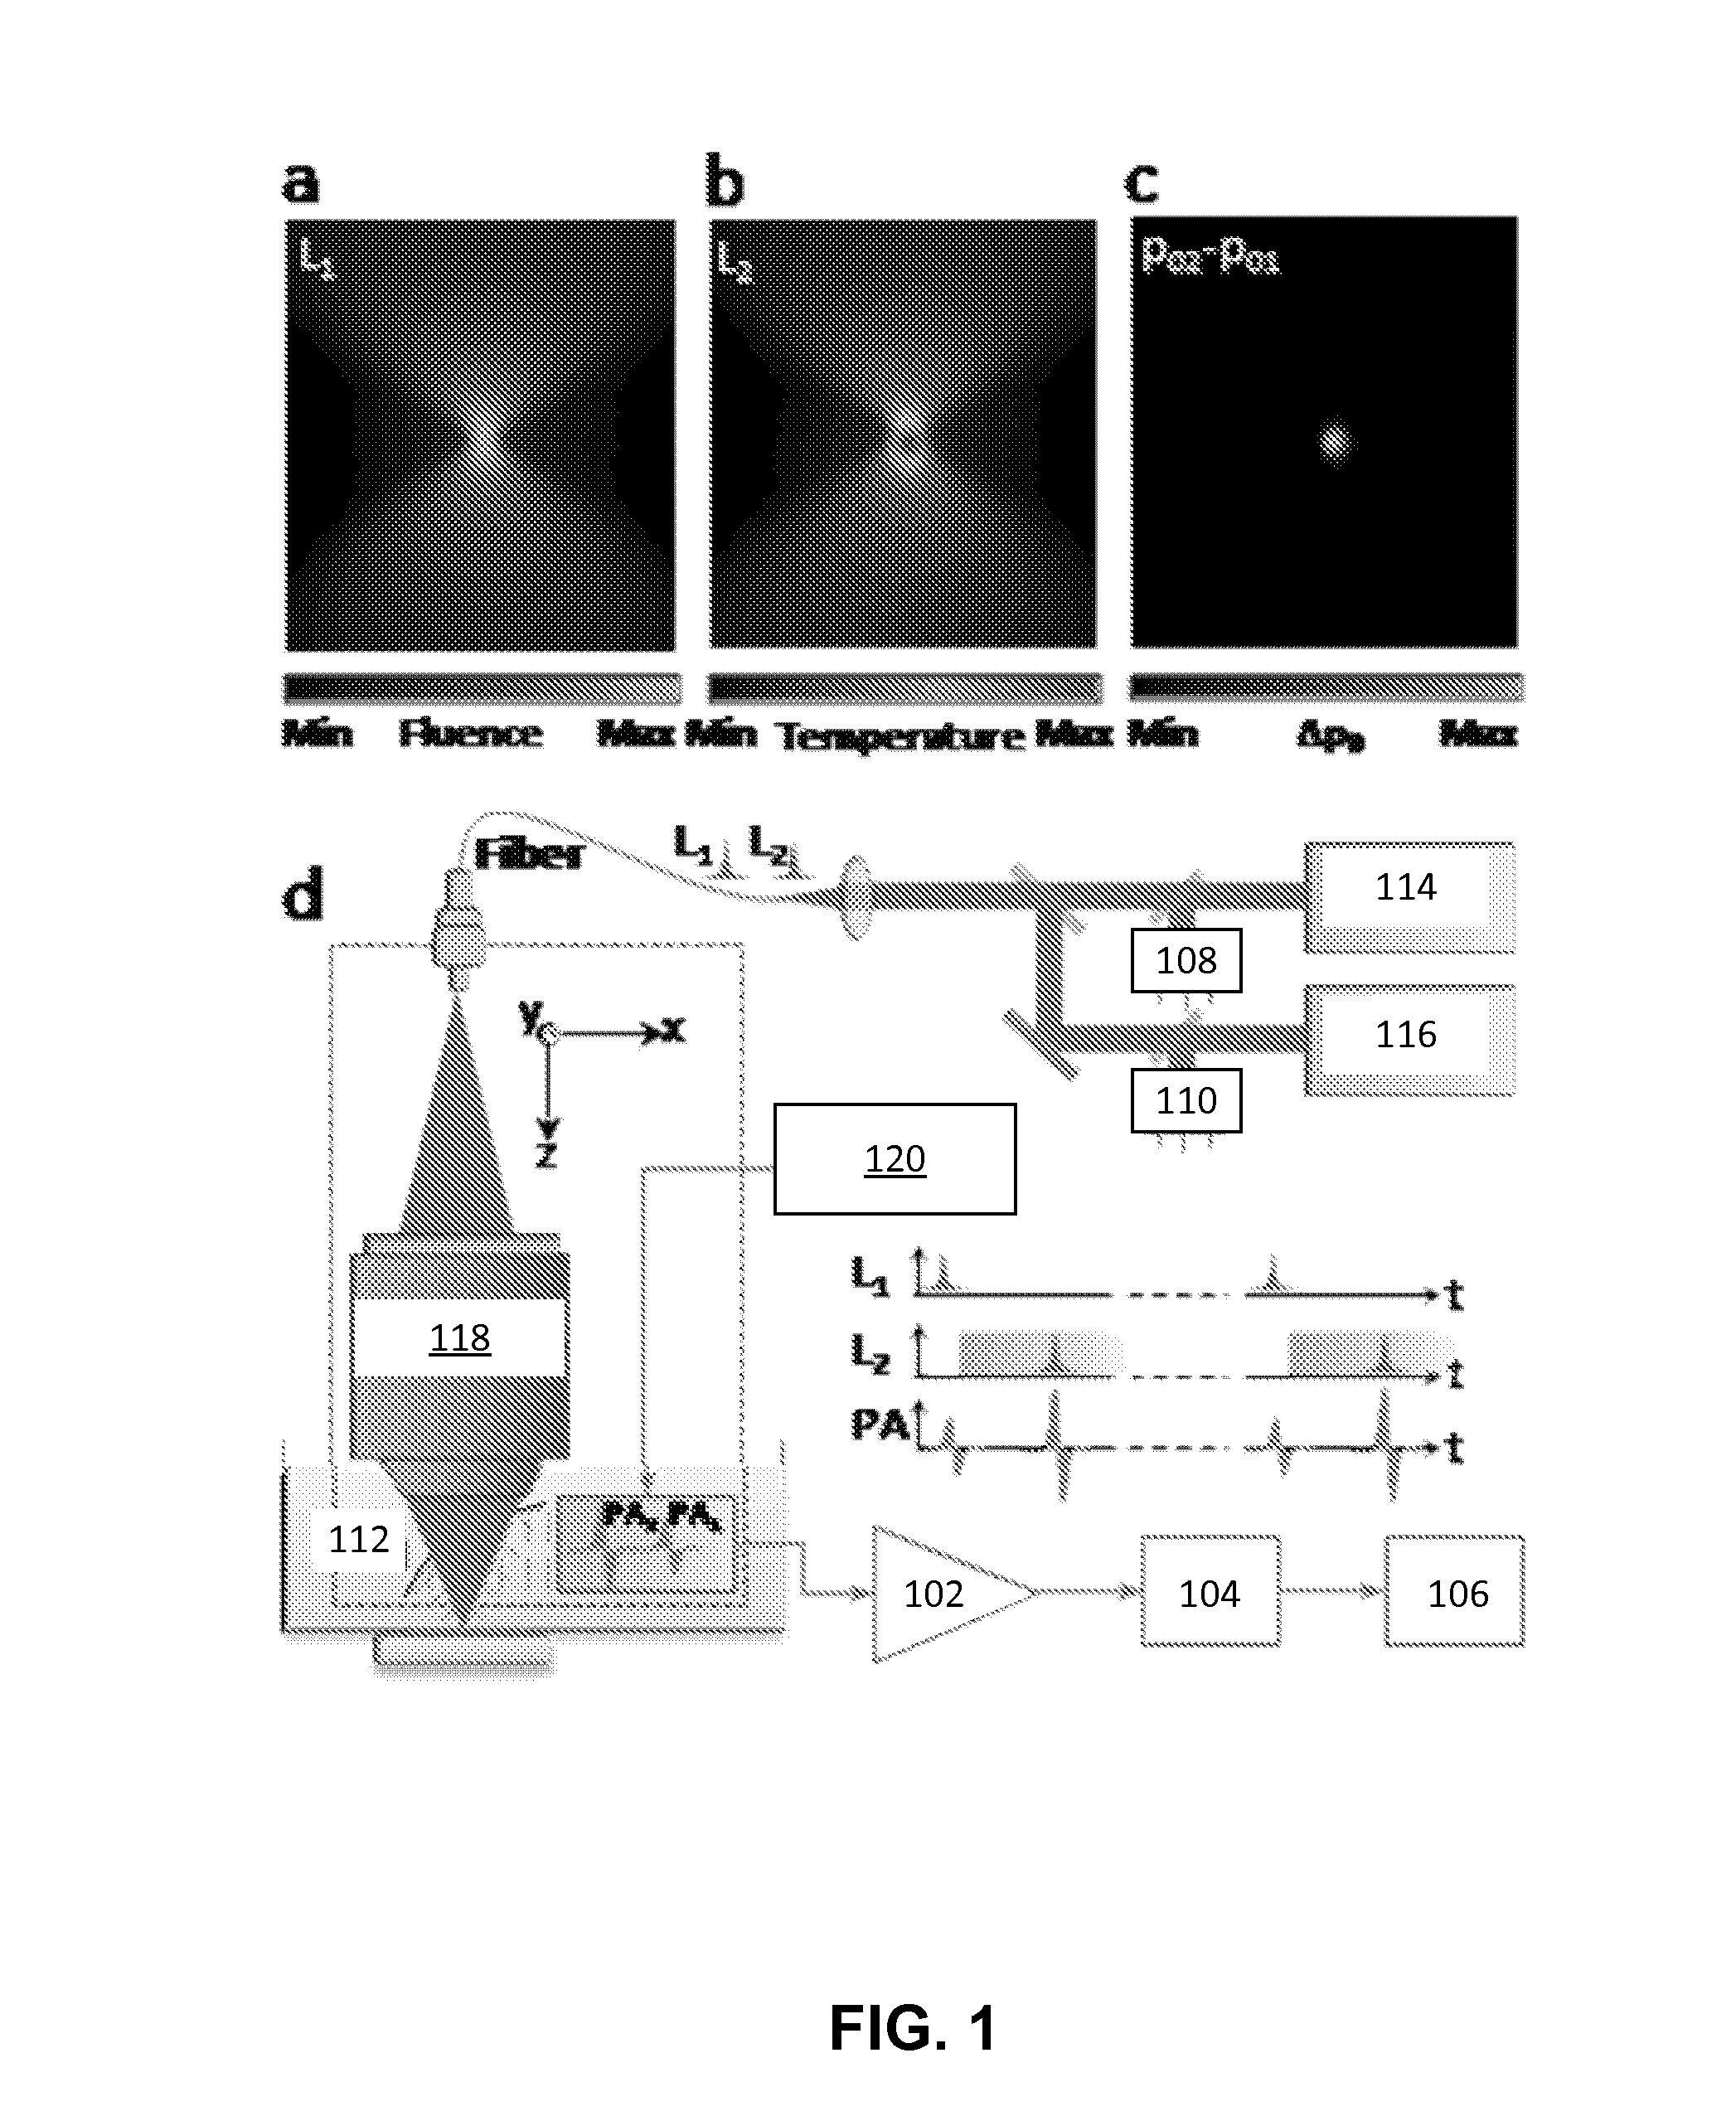
[0092]The Grueneisen-relaxation effect was experimentally validated by imaging red blood cells (RBCs). A monolayer of RBCs was fixed on a glass slide, immersed into deionized water, and positioned in the optical focal plane. Multiple PA images were acquired using two-dimensional raster scanning. At each measurement, the PA amplitude was calculated from the average signal of the entire PA image.

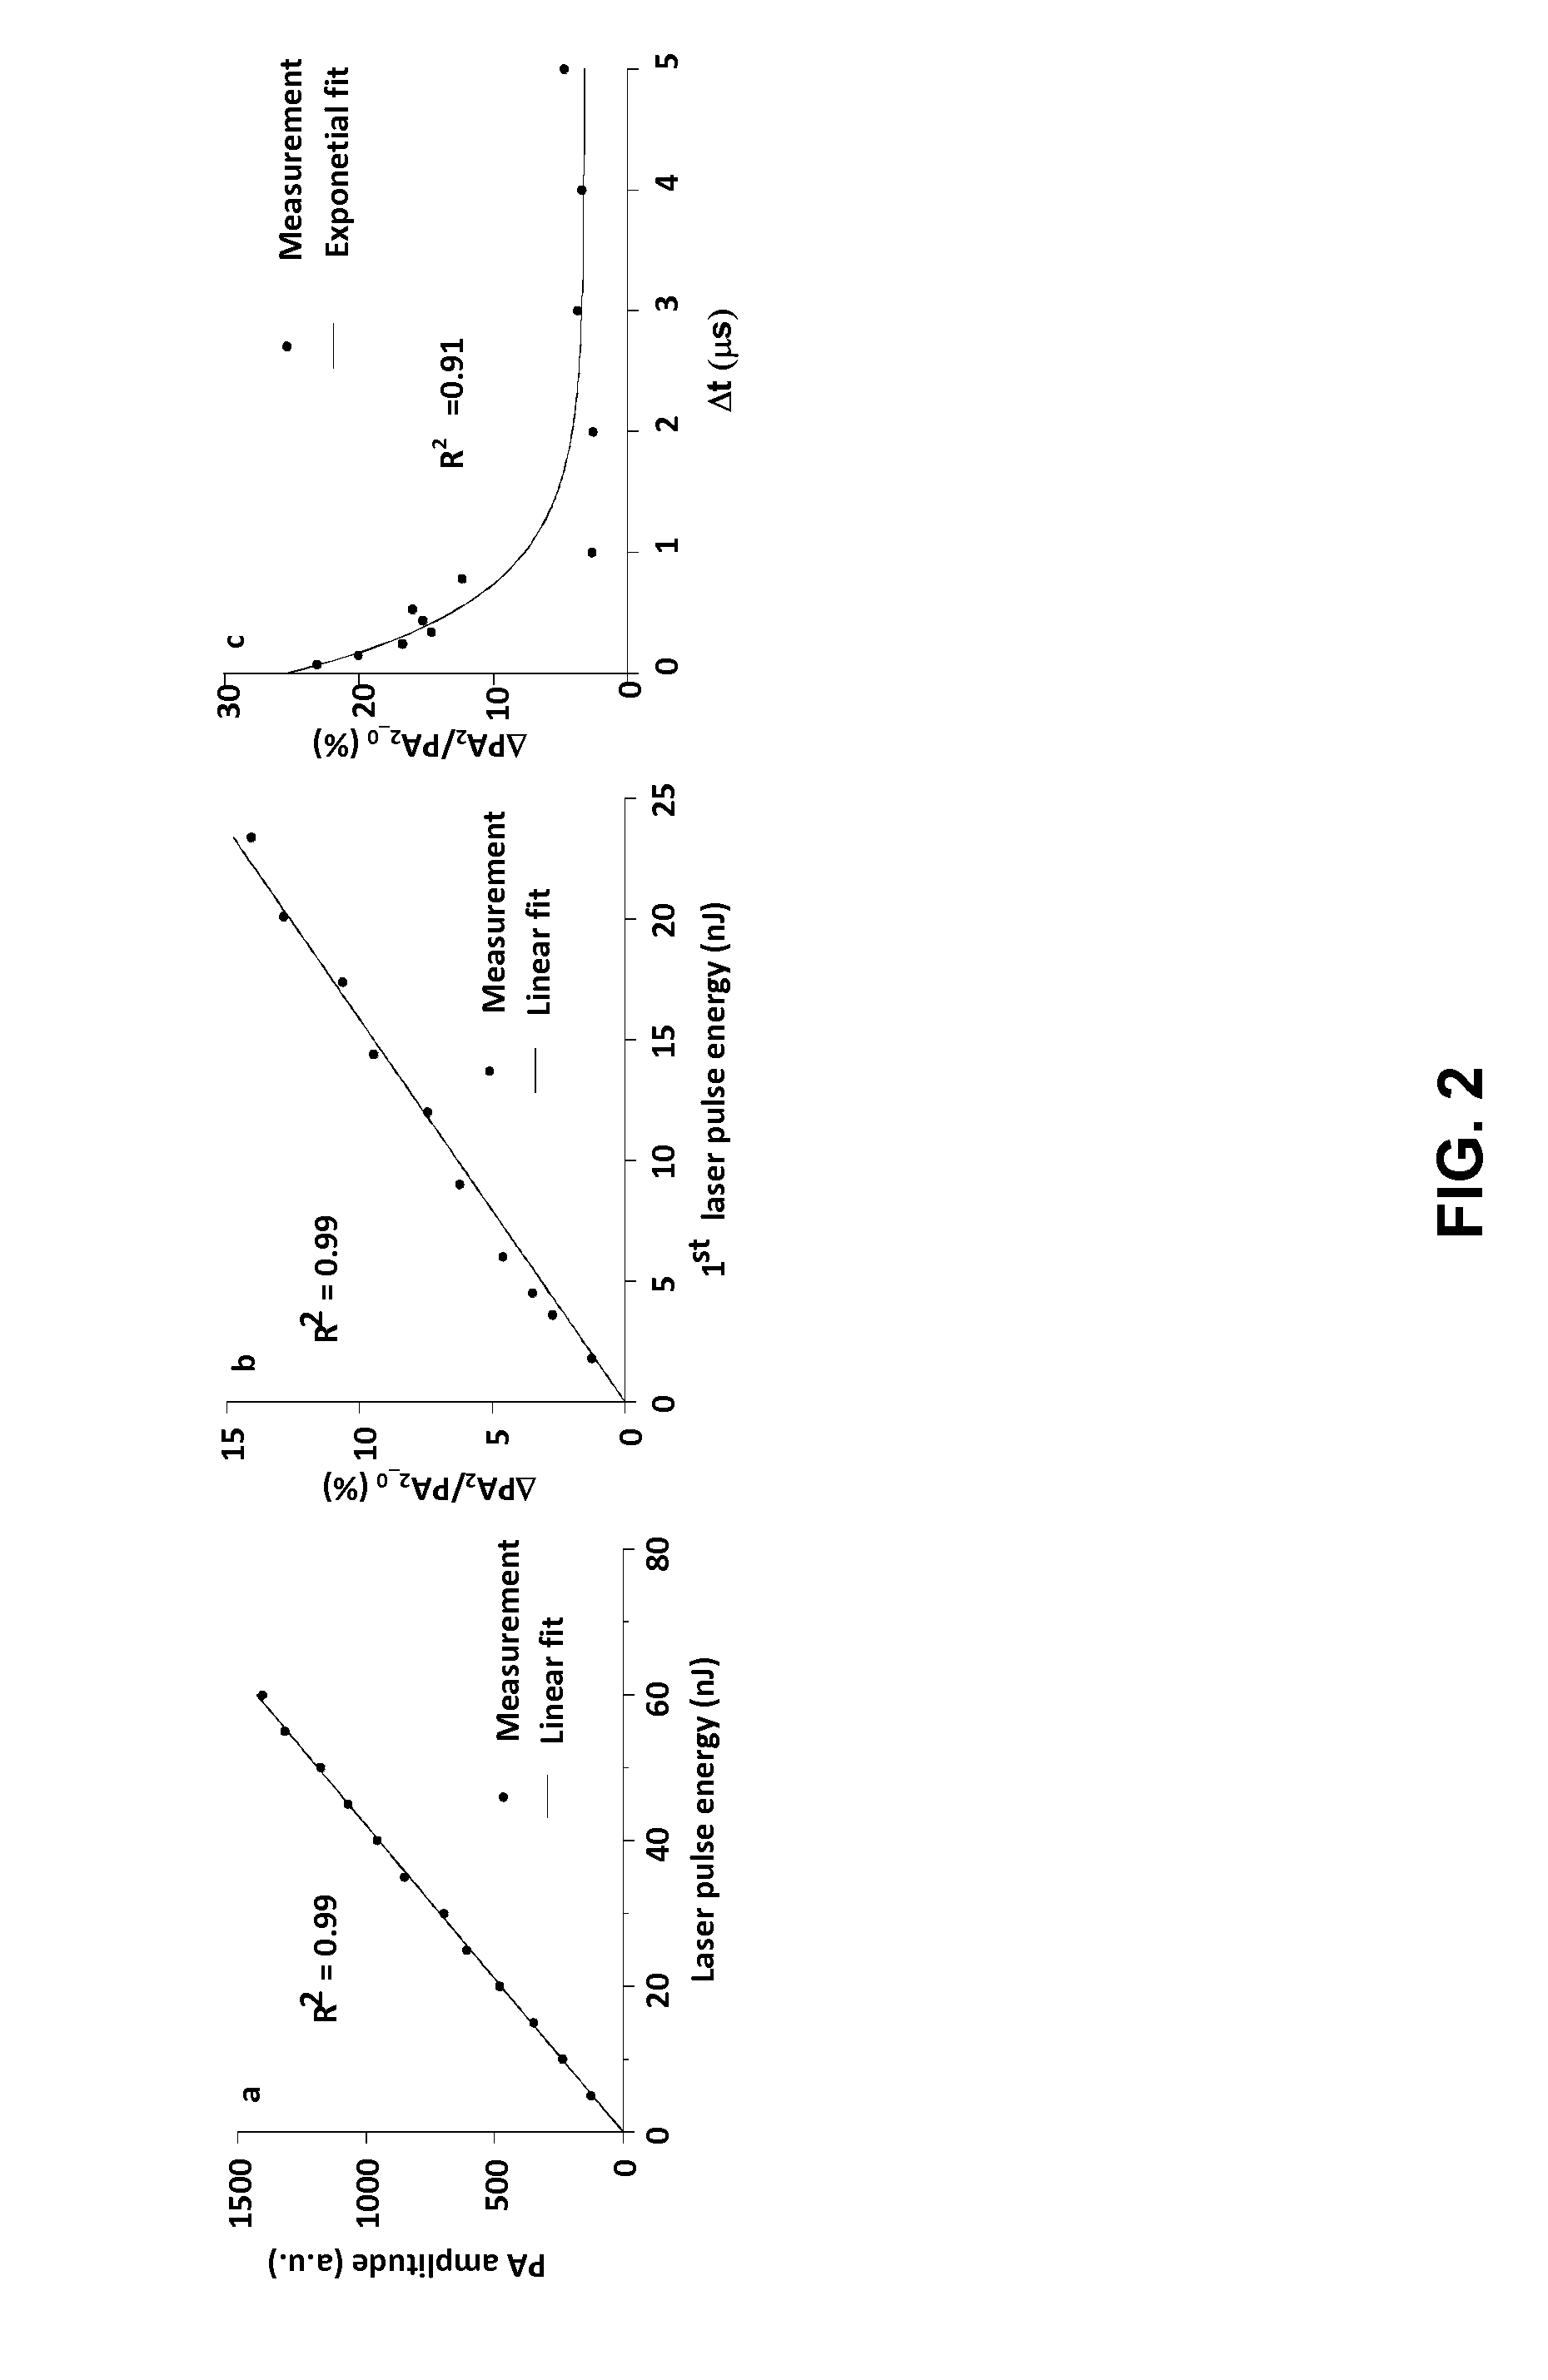
[0093]First, the linear relationship was validated between the single-pulse PA amplitude and the excitation laser pulse energy. To avoid the Grueneisen-relaxation effect, only one laser was triggered at 10 kHz. Laser energy was set from 0 to 60 nJ. FIG. 2a shows that the single-pulse PA amplitude was proportional to the laser pulse energy.

[0094]Then the Grueneisen-relaxation effect was experimentally demonstrated using two lasers that were sequentially triggered with a 500 ns delay. ΔPA2=PA2−PA2_0. PA2 was the second PA amplitude, whereas PA2_0 was the second PA...

example 2

Measurement of Lateral and Axial Resolutions

[0096]Lateral resolution was measured by imaging a sharp ink edge on a cover glass. The edge spread function (ESF) of the GR-PAM was obtained by scanning across the sharp edge (FIG. 3a). For comparison, the ESF of the OR-PAM was computed from the PA signal of the first laser pulses. Derivation of the ESFs gives the line spread functions (LSFs, inset in FIG. 3a). The FWHM of the LSF quantifies the lateral resolution. The lateral resolutions of OR-PAM and GR-PAM were 0.65 μm and 0.41 μm, respectively. Therefore, the lateral resolution was improved by a factor of 1.6, close to the theoretical prediction of √{square root over (2)}. In an aspect, the FWHM of the OR-PAM profile may be 45 μm.

[0097]Axial resolution was quantified by scanning perpendicularly to a monolayer of RBCs. At each axial position, the peak-to-peak amplitude of the differential PA signal was recorded to form a 1D depth-resolved image of the GR-PAM, which was fitted to a Gaus...

example 3

Optical Sectioning Imaging of Red Blood Cells

[0098]GR-PAM enables optical sectioning, improving the axial resolution. FIG. 4a, FIG. 4b, and FIG. 4c show GR-PAM images of a monolayer of RBCs placed at different axial positions. The average laser pulse energy was set at 25 nJ. As the RBCs moved out of optical focus, the GR-PA signals quickly decreased, demonstrating optical sectioning. FIG. 4d, FIG. 4e, and FIG. 4f present OR-PAM images of the same sample. The OR-PAM signals did not show obvious changes when scanning the sample along the axial direction. FIG. 4g and FIG. 4h present GR-PAM and OR-PAM side-view images in the x-z plane. With optical axial resolution, a small tilt angle of the sample slide was clearly imaged using GR-PAM. In addition to the improvement in the axial resolution, GR-PAM also enhanced image contrast. The doughnut-feature contrast was quantified as c=(PAmax−PAmin) / PAmax, where PAmin is the smallest pixel value in the doughnut feature, and PAmax is the nearest ...


PUM

PropertyMeasurementUnit
lag interval timeaaaaaaaaaa

Abstract

Systems and methods for focusing a light pulse within a focus area using nonlinear photoacoustic wavefront shaping (PAWS) are disclosed herein. The method includes modulating a spatial phase pattern of a light pulse's waveform based on a Grueneisen-relaxation photoacoustic (GR-PA) feedback signal. In addition, systems and methods for performing Grueneisen-relaxation photoacoustic microscopy (GR-PAM) are disclosed herein that include analyzing photoacoustic signals resulting from illumination of a focus region by two closely spaced light pulses. A method of obtaining an absorption coefficient of a sample using Grueneisen-relaxation photoacoustic microscopy (GR-PAM) is also disclosed.

Description

CROSS REFERENCE TO RELATED APPLICATIONS[0001]This application is a PCT of U.S. Provisional Application No. 61 / 906,238 filed on Nov. 19, 2013, which is incorporated herein by reference in its entirety.GOVERNMENTAL RIGHTS IN THE INVENTION[0002]This invention was made with government support under Grant No. R01 CA159959 (NIH), R01 CA186567 (NIH), DP1 EB016986 (NIH), and IS 13 (National Academies Keck Futures Initiative). The government has certain rights in the invention.FIELD OF THE INVENTION[0003]The invention generally relates to systems and methods for improving photoacoustic resolution.BACKGROUND OF THE INVENTION[0004]Confocal microscopy has broad applications in life science, semiconductor inspection, and materials science. It offers better optical resolution and signal-to-background ratio than wide-field microscopy. However, confocal microscopic contrast has been limited to back-scattering and fluorescence; it cannot image non-radiative absorption contrast with sufficient sensit...

Claims


Application Information

Patent Timeline
Patent Type & Authority Applications(United States)
IPC IPC(8): G01N29/24G02B21/00
CPCG01N29/2418G01N2201/06113G02B21/0028G02B21/008G02B21/0004G02B21/002
Inventor WANG, LIHONG V.WANG, LIDAIZHANG, CHILAI, PUXIANGTAY, JIAN WEI
Owner CALIFORNIA INST OF TECH
Why Eureka
Try Eureka