Dot detection, color classification of dots and counting of color classified dots

a technology of color classification and dots, applied in image analysis, instruments, image enhancement, etc., can solve the problems of high risk of recurrence, poor clinical outcome, laborious manual interpretation of tissue slides, etc., to reduce the time it takes to diagnose, improve laboratory throughput, and accurate and robust

Active Publication Date: 2017-11-09
VENTANA MEDICAL SYST INC
View PDF0 Cites 18 Cited by
  • Summary
  • Abstract
  • Description
  • Claims
  • Application Information

AI Technical Summary

Benefits of technology

[0020]As described further in Example 1 herein, the present disclosure discloses a superior method of automated dot detection, dot classification, and dot counting as compared with the prior art, especially in the context of dual ISH for HER2 detection. Indeed, Applicants have shown a significant decrease in the number of false negatives picked up by the current method compared to prior art methods, where both methods were evaluated against the same ground truth data. Overall, the presently disclosed method sets forth a workflow which produces results that are more accurate and more robust than previous approaches, even when images containing significant data variability (e.g. stain quality, focus, fringing, and artifacts) were evaluated. It is further believed that the presently disclosed automated scoring process can reduce the time it takes to diagnose and thus increase laboratory throughput. Additionally, the automated process can provide consistent and reliable scoring to enhance interpretation accuracy.

Problems solved by technology

Sadly, this alteration is also an independent prognostic factor predictive of poor clinical outcome and a high risk of recurrence.
Interpreting tissue slides manually is labor intensive, costly and involves the risk of human errors and inconsistency, while using automated image analysis can provide additional automatic, fast and reproducible analyses, assisting the pathologist in making an accurate and timely diagnosis.
Digital images for automated analysis often contain variations that make it difficult to detect and classify differently colored dots representative of, for example, ISH signals.
Other problems may exist including (a) image backgrounds stained with the same or similar color to the signals being detected, (b) optical fringing (chromatic aberrations) of objects within the image, and (c) poor focus of the original image.
In addition, it is possible that any dot detection and classification method may (i) incorrectly classify objects whose features are faint (e.g. a faint red dot may get detected but may not be classified properly as a red dot versus a black dot), (ii) fail to detect those dots that are faint; or (iii) in instances where the image contains speckling of small black dots, the speckling may be wrongly picked up and / or classified as black dots.

Method used


Image

  • Dot detection, color classification of dots and counting of color classified dots
  • Dot detection, color classification of dots and counting of color classified dots
  • Dot detection, color classification of dots and counting of color classified dots

Examples


example 1

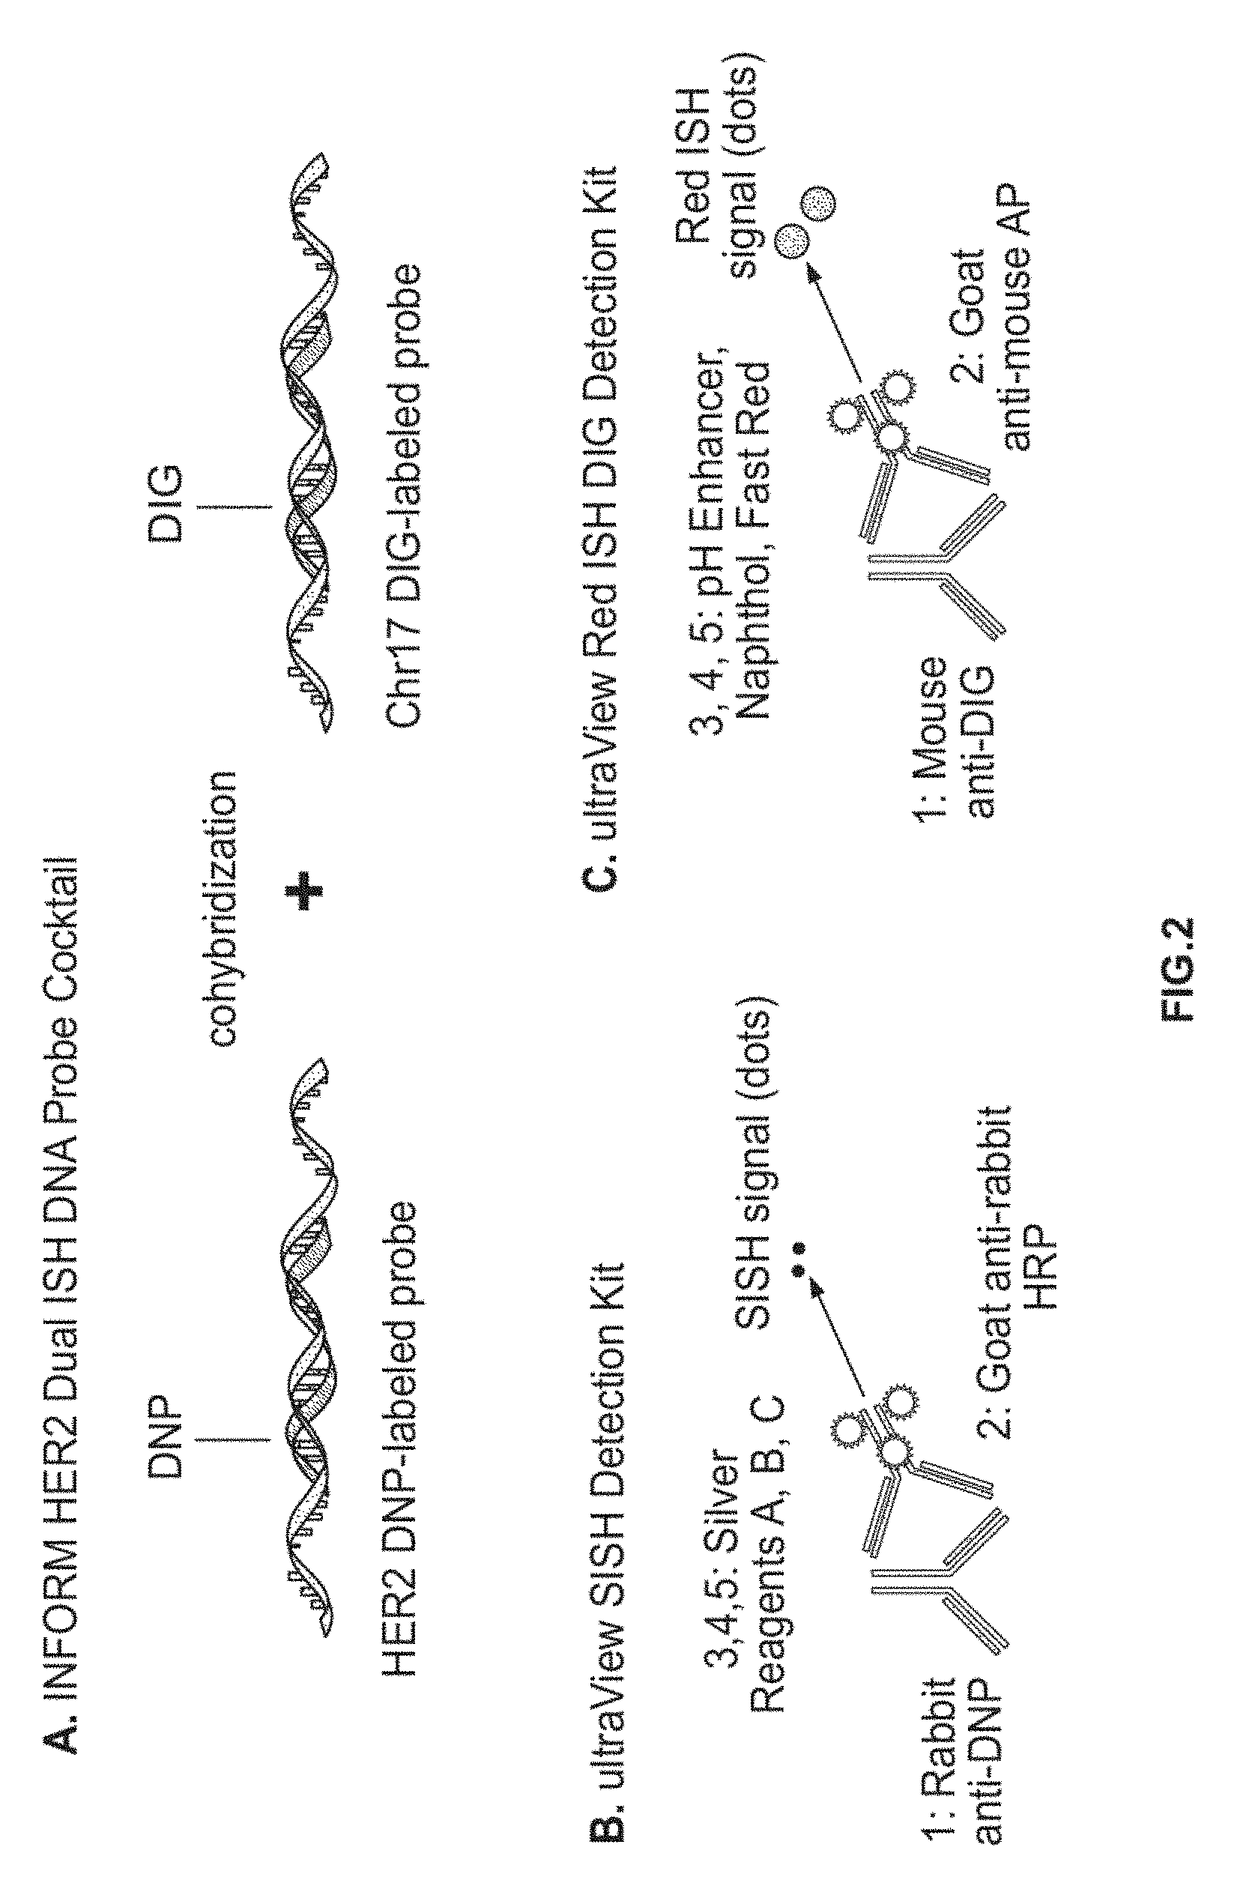
[0276]In dual ISH for HER2 detection as described in detail herein, if we have 20 cells for the given FOV(s), and the cell score is “Bi” (number of black dots picked for the i-th cell) and “Ri” (number of red dots picked for the i-th cell), then for the i-th cell, the final score for that slide is computed as:

[0277]Score=(ΣBi) / (ΣRi), where the score is computed for all i where both Bi and Ri are >0.

[0278]The score is grouped into 3 bins:

[0279]i) Bin 1: score <=1.8

[0280]ii) Bin 2: score >1.8 and score <=2.2

[0281]iii) Bin 3: score >2.2

[0282]A prior art dot detection and classification method (V1) and the presently disclosed dot detection and classification method (V2) were both compared against ground truth values (GT) using 386 slides scanned on a HT Scanner (model number B113N7131) using software version number 1.0.2.2.

[0283]Table 1 provides a 3×3 confusion matrix comparing ground truth values against the prior art method (V1). The number of false negatives is shown for each bin.

TAB...


PUM


Abstract

The present disclosures relates to a method of detecting, classifying, and counting dots in an image of a tissue specimen comprising detecting dots in an image of the tissue sample that meet criteria for absorbance strength, black unmixed image channel strength, red unmixed image channel strength, and a difference of Gaussian threshold, wherein the detected dots correspond to in situ hybridization signals in the tissue samples; classifying the detected dots as belonging to a black in situ hybridization signal or to a red in situ hybridization signal; and calculating a ratio of those dots belonging to the black in situ hybridization signal and those belonging to the red in situ hybridization signal.

Description

CROSS-REFERENCE TO RELATED APPLICATIONS[0001]This patent application is a continuation of International Patent Application No. PCT / EP2016 / 051902 filed Jan. 29, 2016, which claims priority to and the benefit of U.S. Provisional Application No. 62 / 109,459, filed Jan. 29, 2015. Each of the above patent applications are hereby incorporated by reference herein in their entireties.BACKGROUND OF THE DISCLOSURE[0002]Molecular pathology is the examination at a molecular level of the DNA, mRNA, and proteins that cause or are otherwise associated with disease. Gene amplification and / or overexpression have been identified as an indicator of patient prognosis in a variety of tumors or for determining those patients that should be provided certain treatments. For example, a certain type of breast cancer is associated with an over-abundance (e.g., over expression) of the human epidermal growth factor 2 (“HER2”) versus the number of chromosome 17s found in the cell. Sadly, this alteration is also a...

Claims


Application Information

Patent Timeline
Patent Type & Authority Applications(United States)
IPC IPC(8): G06K9/00G06T7/00G06T7/11G06T7/90
CPCG06K9/00127G06T7/0012G06T7/11G06T2207/30096G06T2207/10024G06T2207/10056G06T2207/30024G06T7/90G06V20/69
Inventor SARKAR, ANINDYAMARTIN, JIM
Owner VENTANA MEDICAL SYST INC
Why Eureka
Try Eureka