
Perfusion digital subtraction angiography

a technology of perfusion and subtraction angiography, applied in the field of diagnostic imaging devices and methods, can solve problems such as different interpretation of perfusion dsa, and achieve the effect of improving patient outcomes

Active Publication Date: 2019-01-17
RGT UNIV OF CALIFORNIA
View PDF0 Cites 30 Cited by
  • Summary
  • Abstract
  • Description
  • Claims
  • Application Information

AI Technical Summary

Benefits of technology

The patent text describes a method for improving decision-making in endovascular interventions for stroke treatment using neuroimaging techniques. The imaging methods can provide valuable information to guide the treatment and monitoring of recovery. The technology also allows for quantitative description of blood perfusion across the image, which can aid in identifying patients who may benefit from specific treatment strategies. Overall, the patent aims to enhance the accuracy and efficiency of treating acute stroke and promote recovery.

Problems solved by technology

However, the interpretation of perfusion DSA is different due to the nature of the view (frontal or lateral) and the overlap of several brain structures within a given location.

Method used


Image

  • Perfusion digital subtraction angiography
  • Perfusion digital subtraction angiography
  • Perfusion digital subtraction angiography

Examples


example 1

[0085]To demonstrate the operational principles of the perfusion angiography framework and parametric imaging methods, data was collected from patients evaluated at a single, academic comprehensive stroke center and identified with symptoms of acute ischemic stroke. A total of 66 patients (median age: 68 years, including 35 women, satisfied the study criteria.

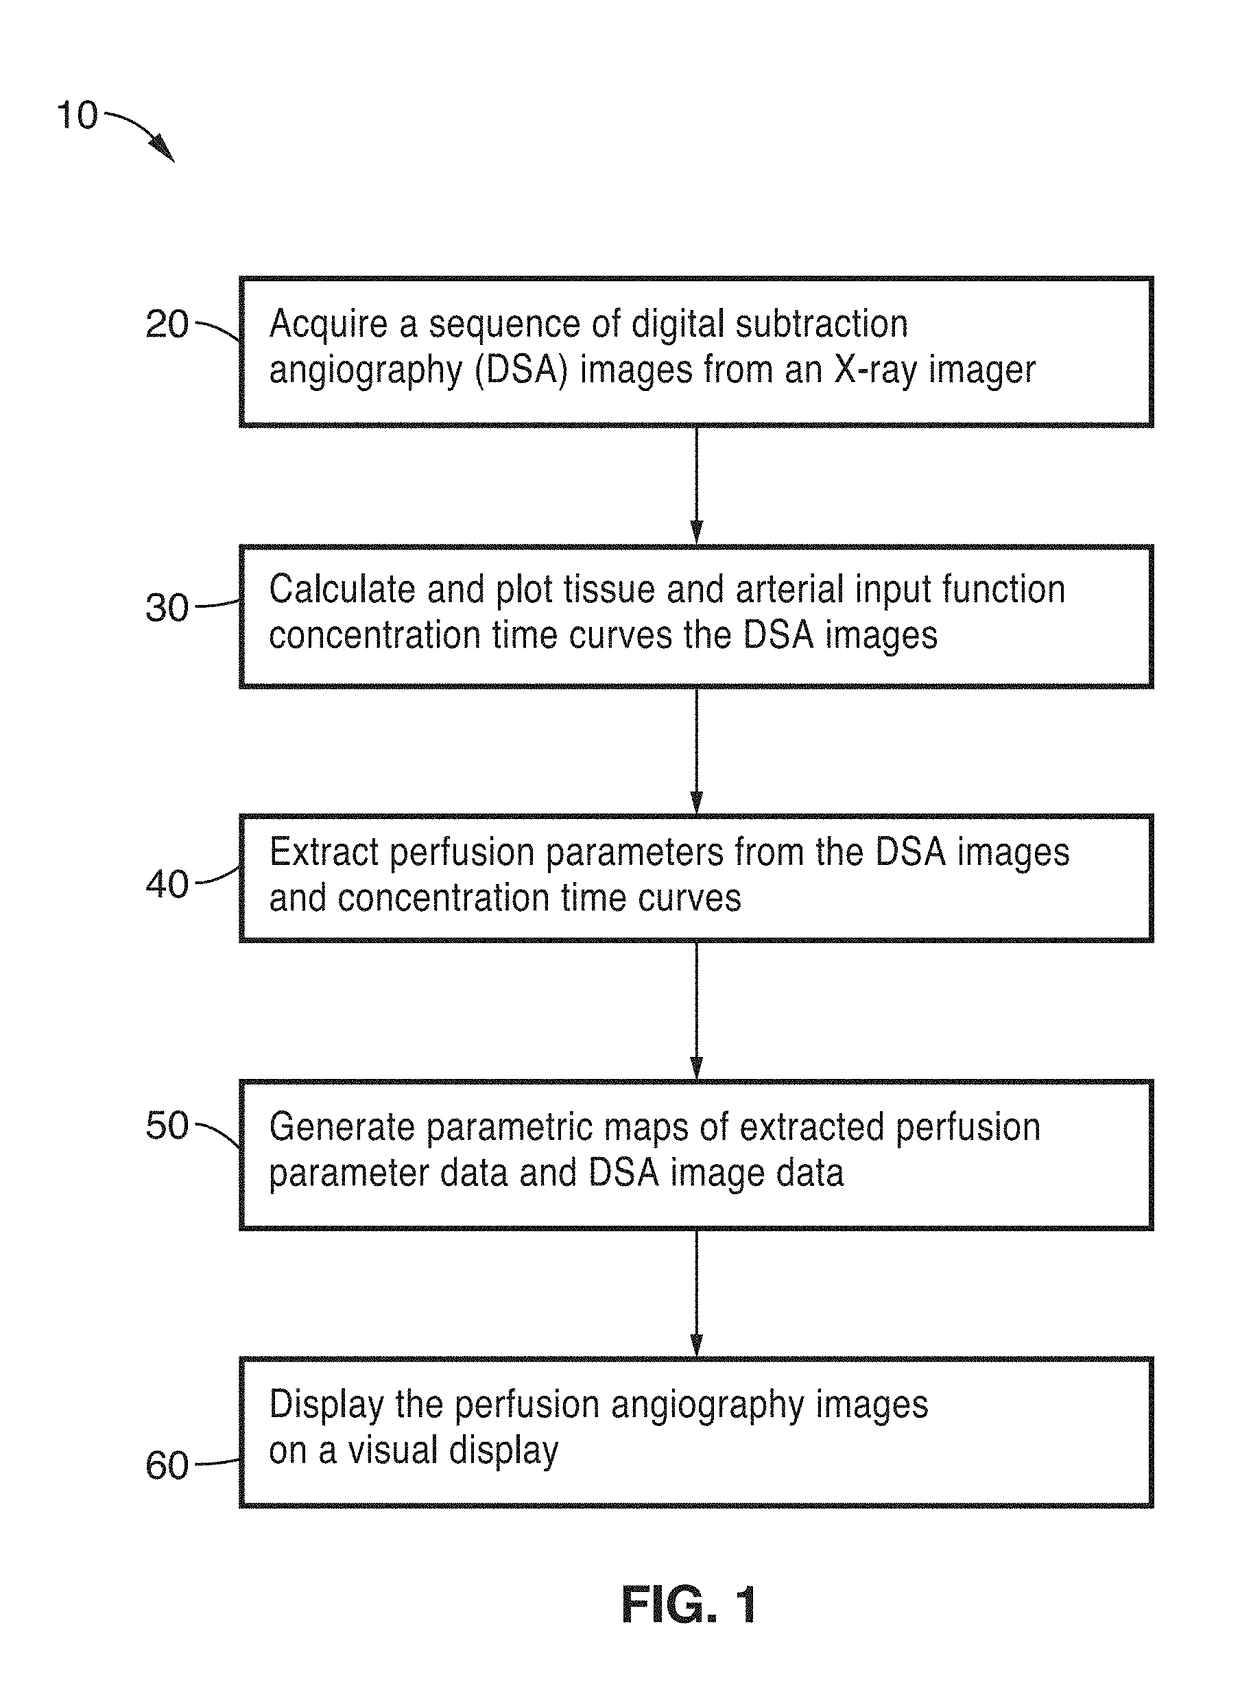
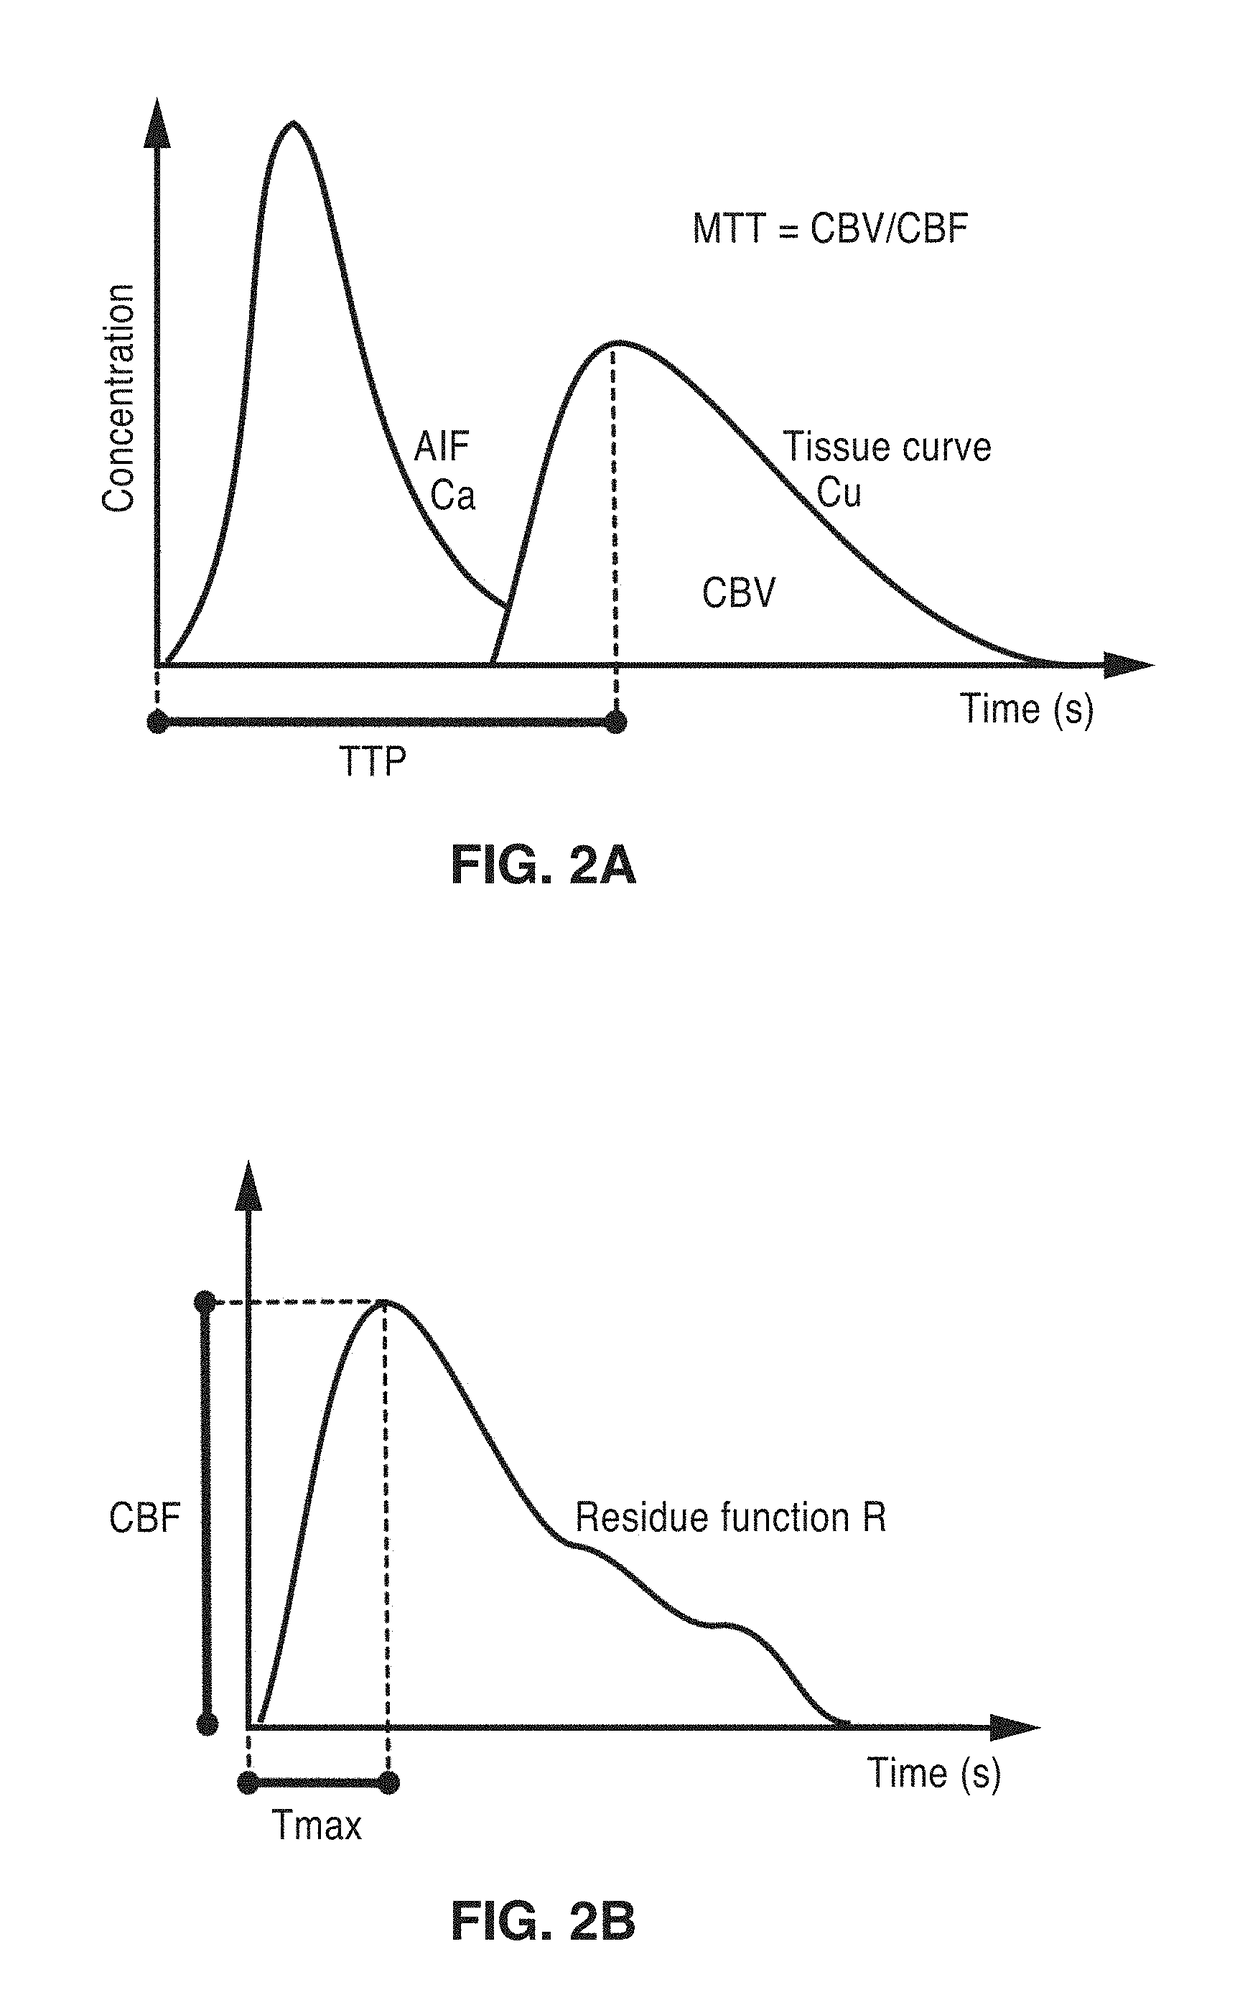
[0086]Source DSA images of each patient were processed with the perfusion angiography framework described in FIG. 1. The concentration time-curve of the arterial input function (AIF) (Ca) required for the computation of perfusion maps was obtained by extracting the average of the DSA values comprised within a region of interest (ROI) at each time point that was arbitrarily selected. In this illustration, the ROI was set on the intracerebral artery (ICA) as an elliptical region fully included in the vessel.

[0087]The capability of the method of extracting and calculating various parameters from the raw source DSA images and the e...

example 2

[0096]To further test the functionality of the methods, the perfusion angiography methods were applied to the dataset composed of DSA sequences following endovascular thrombectomy recorded on acute ischemic stroke patients with MCA occlusion. The tests are formulated such that the distribution of a given perfusion parameter across the MCA territory was averaged and studied with respect to the TICI score.

[0097]Statistical measurements of correlation and dispersion were then performed. Source DSA images of each patient were processed with perfusion angiography. The concentration-time curve of the arterial input function (AIF) Ca required for the computation of perfusion maps was obtained by extracting the average of the DSA values comprised within a region of interest (ROI) at each time point.

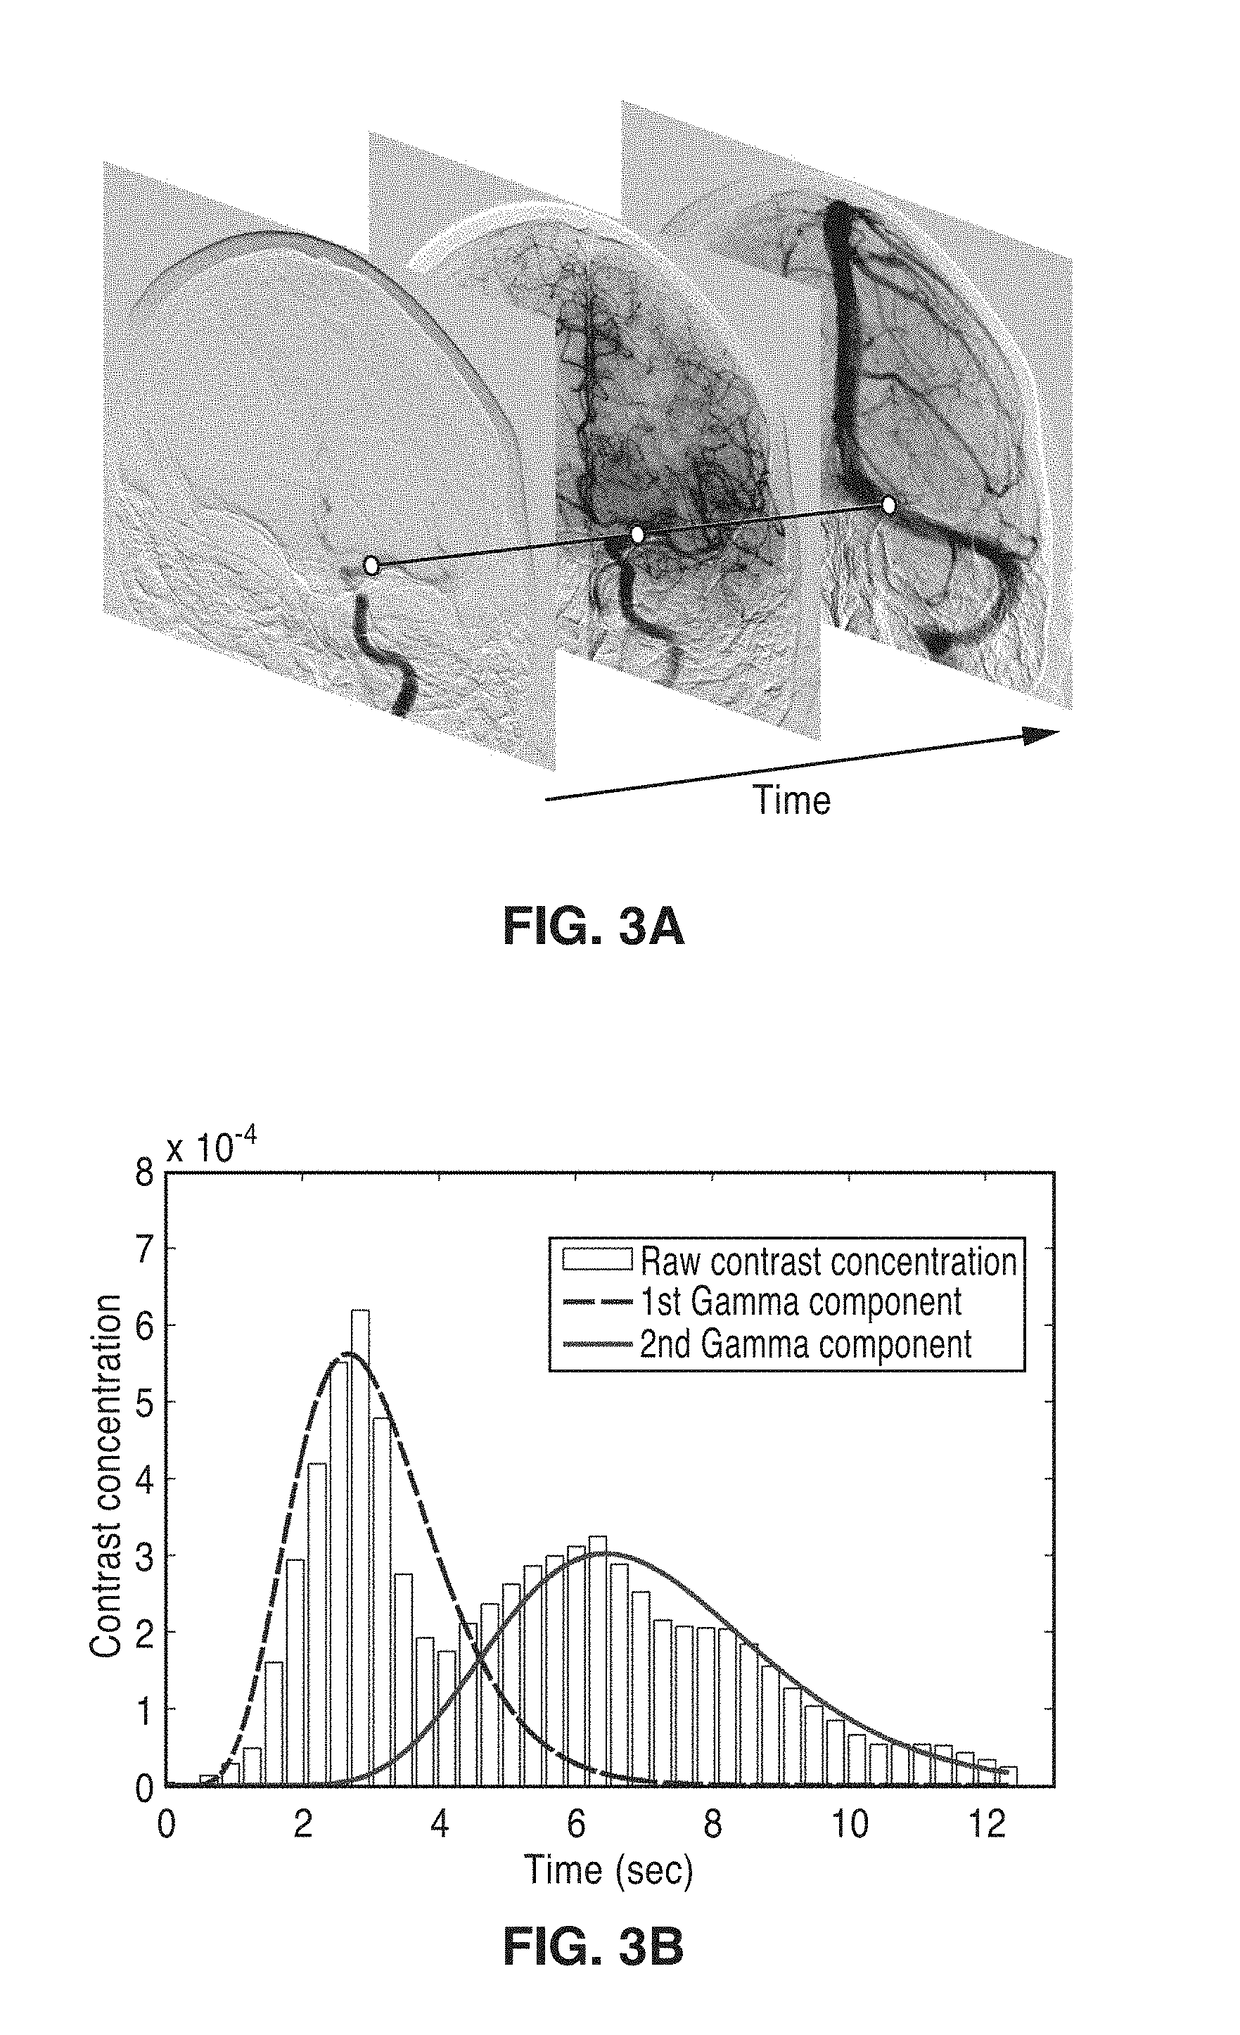
[0098]The perfusion angiography was conducted using the BIC criterion to select among a maximum of two Gamma components to differentiate between the arterial and the venous phase. After processin...


PUM


Abstract

An apparatus and methodological framework are provided, named perfusion angiography, for the quantitative analysis and visualization of blood flow parameters from DSA images. The parameters, including cerebral blood flow (CBF) and cerebral blood volume (CBV), mean transit time (MTT), time-to-peak (TTP), and Tmax, are computed using a bolus tracking method based on the deconvolution of time-density curves on a pixel-by-pixel basis. Individual contrast concentration curves of overlapping vessels can be delineated with multivariate Gamma fitting. The extracted parameters are each transformed into parametric maps of the target that can be color coded with different colors to represent parameter values within a particular set range. Side by side parametric maps with corresponding DSA images allow expert evaluation and condition diagnosis.

Description

CROSS-REFERENCE TO RELATED APPLICATIONS[0001]This application is a 35 U.S.C. § 111(a) continuation of PCT international application number PCT / US2016 / 067400 filed on Dec. 17, 2016, incorporated herein by reference in its entirety, which claims priority to, and the benefit of, U.S. provisional patent application Ser. No. 62 / 270,042 filed on Dec. 21, 2015, incorporated herein by reference in its entirety. Priority is claimed to each of the foregoing applications.[0002]The above-referenced PCT international application was published as PCT International Publication No. WO 2017 / 112554 on Jun. 29, 2017, which publication is incorporated herein by reference in its entirety.STATEMENT REGARDING FEDERALLY SPONSORED RESEARCH OR DEVELOPMENT[0003]Not ApplicableINCORPORATION-BY-REFERENCE OF COMPUTER PROGRAM APPENDIX[0004]Not ApplicableBACKGROUND1. Technical Field[0005]The technology of this disclosure pertains generally to diagnostic imaging devices and methods, and more particularly to a system...

Claims


Application Information

Patent Timeline
Patent Type & Authority Applications(United States)
IPC IPC(8): A61B6/00G06T7/00
CPCA61B6/5217A61B6/507A61B6/504A61B6/461A61B6/501G06T2207/30016G06T7/0012G06T2207/10124G06T2207/20224G06T2207/30104A61B6/481A61B6/486A61B6/487A61B6/465A61B6/5205G16H50/30
Inventor LIEBESKIND, DAVID S.SCALZO, FABIEN
Owner RGT UNIV OF CALIFORNIA
Learn More