Markers of plant health
a plant health and plant technology, applied in the field of methods for improving plant health, can solve the problems of the cost of field trials of testing the efficacy of new treatments, and achieve the effect of improving plant health
- Summary
- Abstract
- Description
- Claims
- Application Information
AI Technical Summary
Benefits of technology
Problems solved by technology
Method used
Image
Examples
example 1
n of Samples
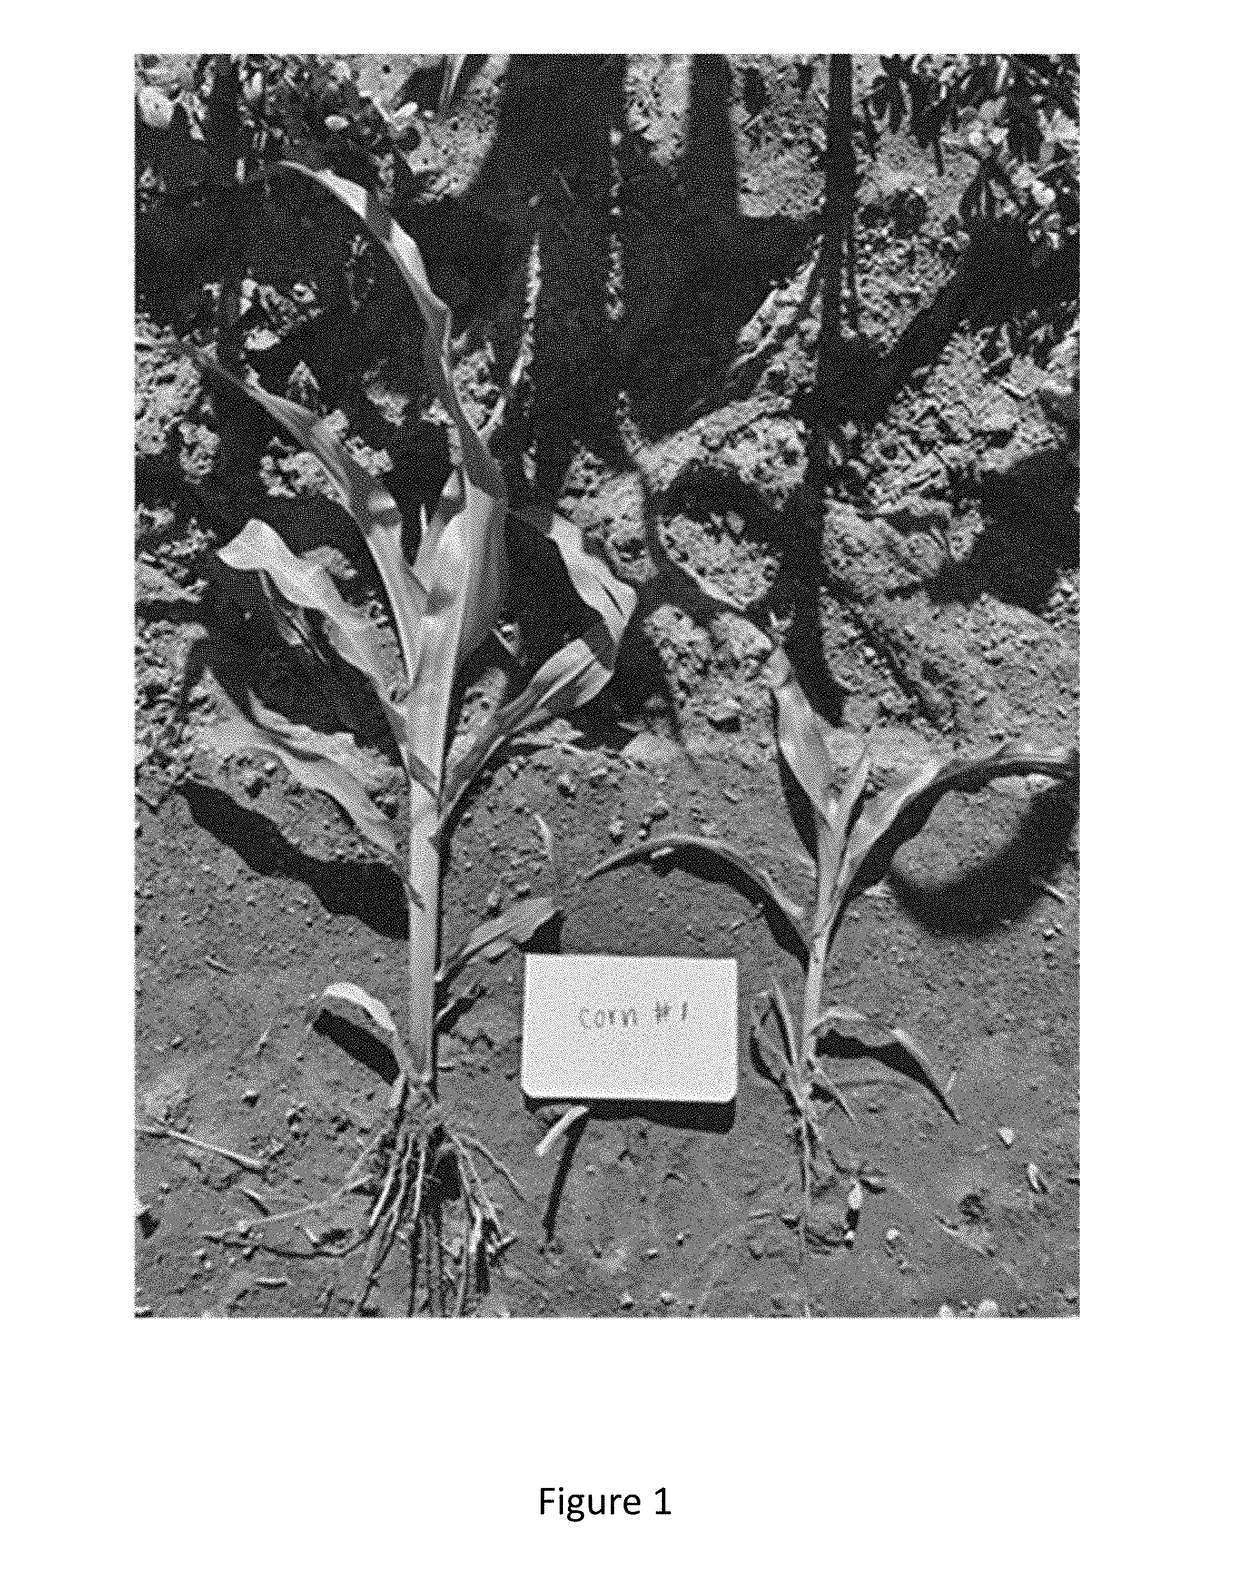
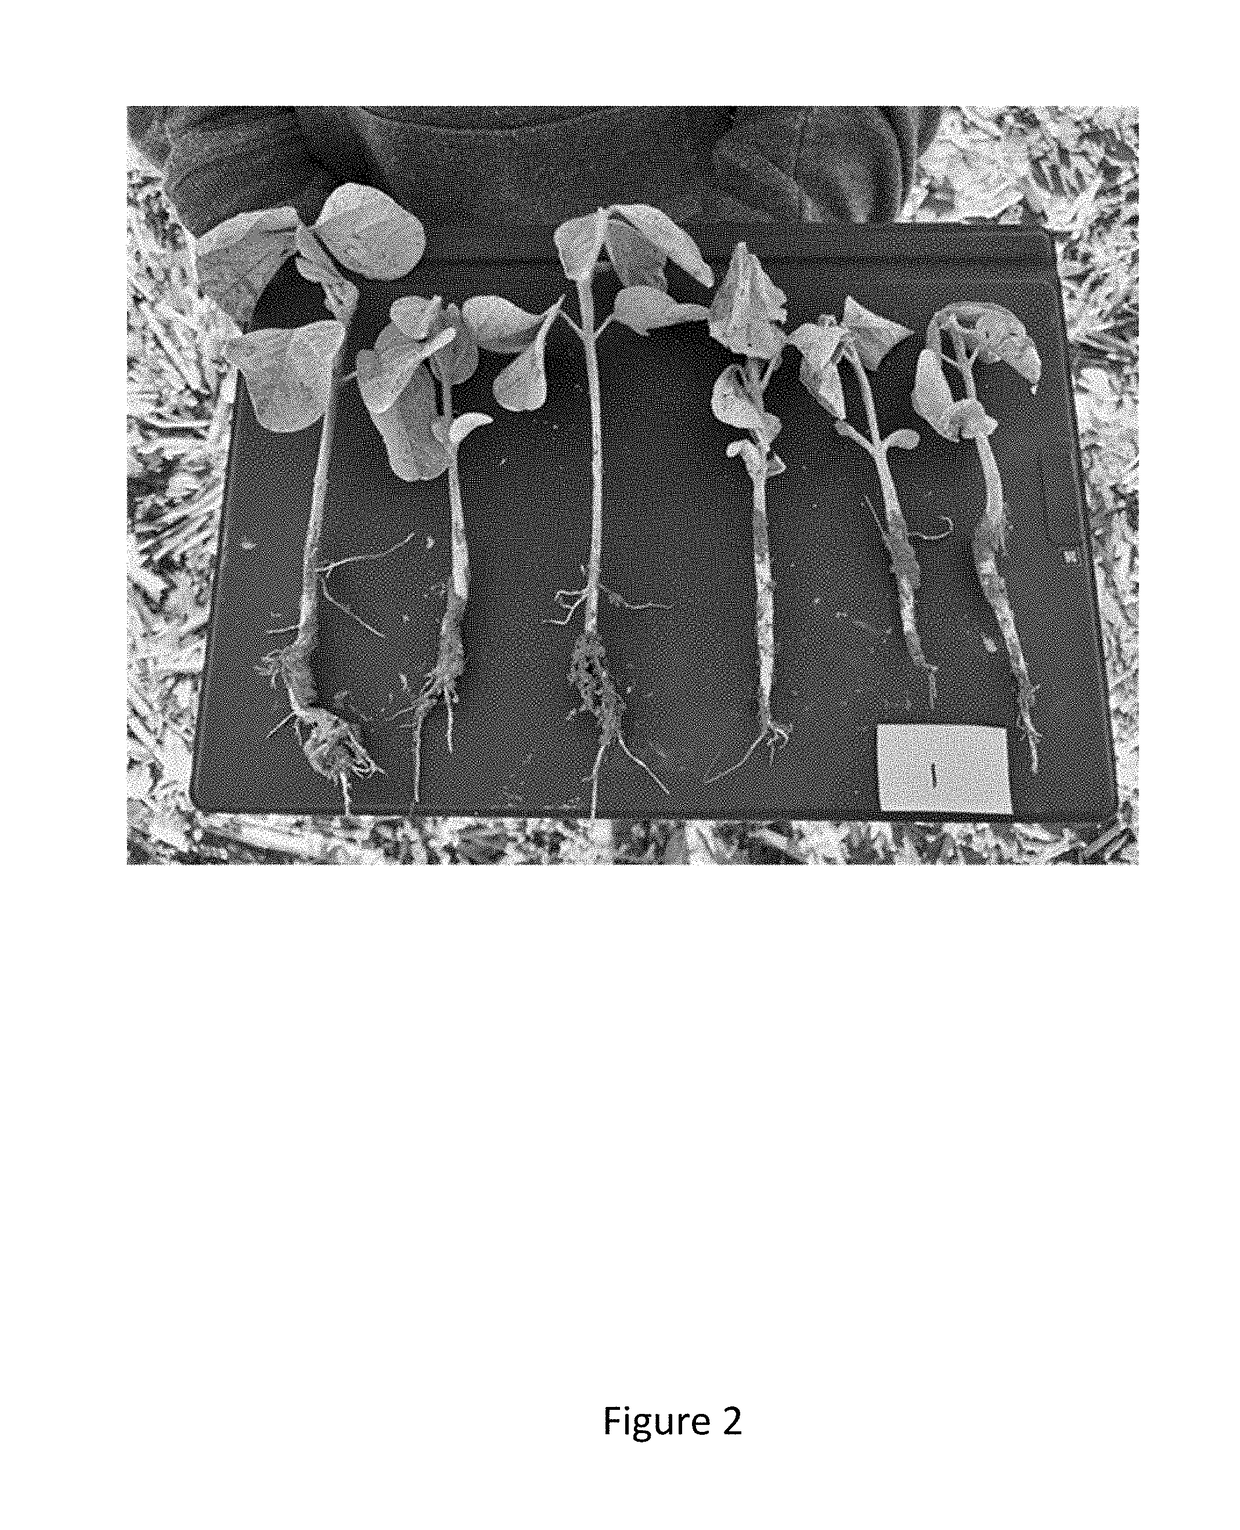
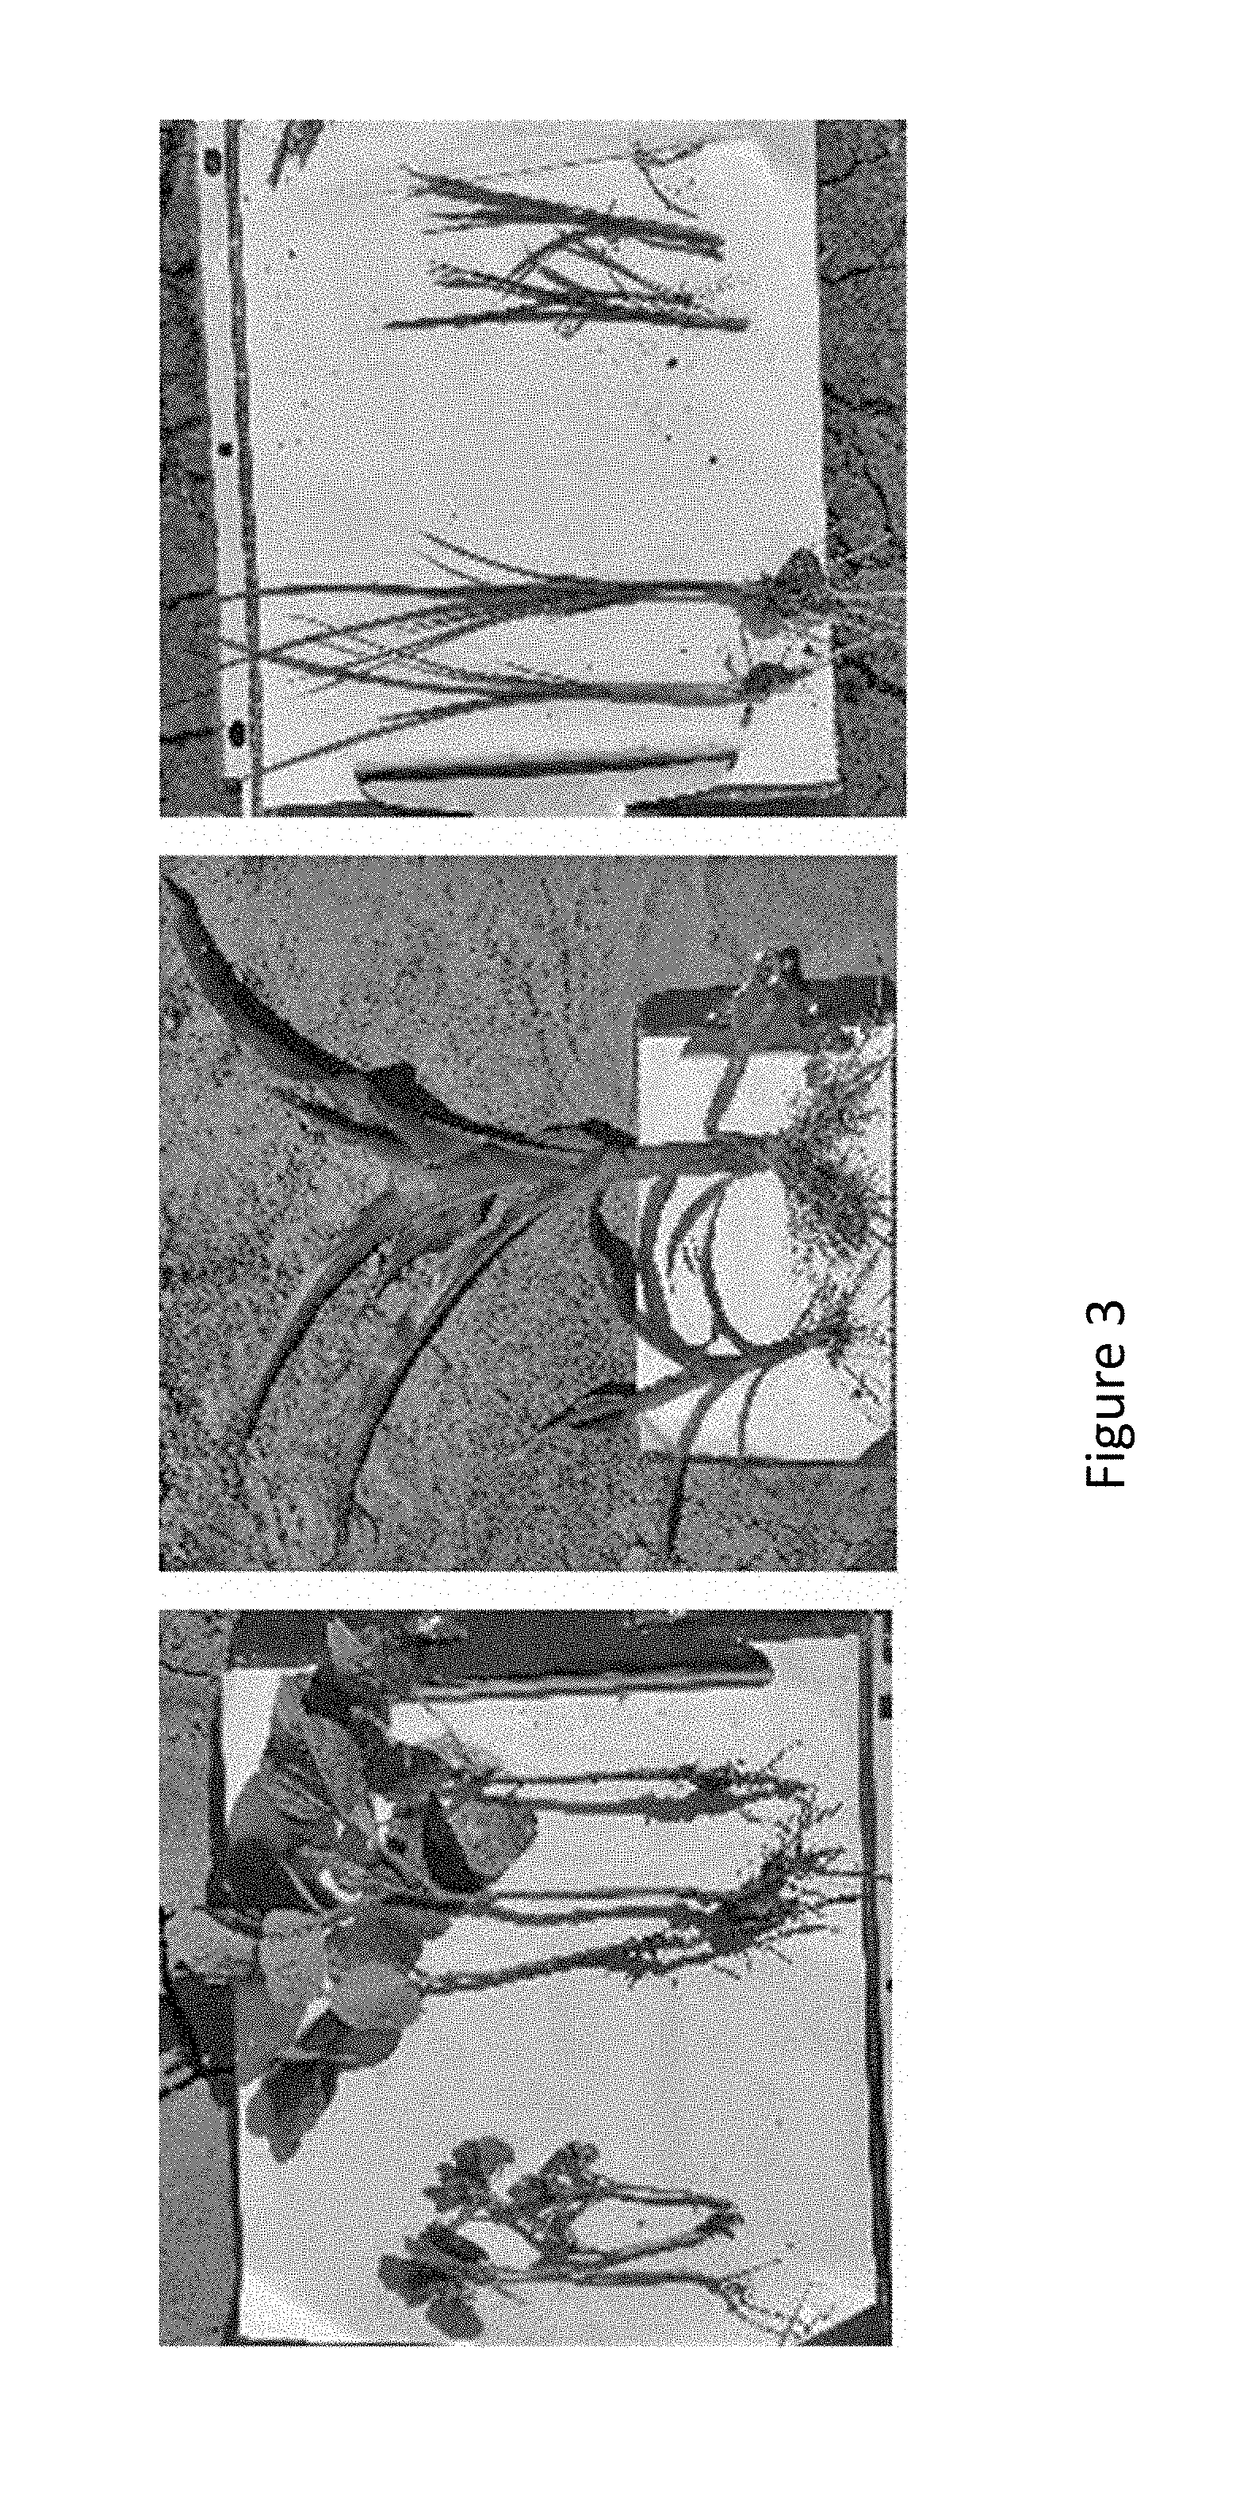
[0106]Leaf and root tissue were collected from corn, soybean and rice plants that were grown under commercially relevant field conditions. Within each crop, development stage, and sampling location, equivalent numbers of samples were collected from healthy plants which were larger and more robust plants and from unhealthy plants which were smaller, less green and less vibrant. Exemplary photos of healthy and unhealthy plants are shown in FIGS. 1-3. At least 25 samples for each phenotype / crop combination were collected at each site sampled.
DNA Extraction
[0107]Each sample was processed independently. Each sample was washed in a dilute water and detergent solution; 2 g of rinsed root and shoot tissue was collected from corn, 1 g of tissue was collected from rice and soy plants. Samples were surface sterilized by successive rinses: 2 minutes in 10% bleach solution, 2 minutes in 70% ethanol solution, and a rinse with sterile water. The series of rinses was re...
example 2
ughput Community Sequencing and OTU Assignment
[0108]Marker genes were amplified and sequenced from the extracted DNA. For the bacterial and archaeal analyses, the V4 hypervariable region of the 16S rRNA gene was amplified using primer 515f: 5′-GTGCCAGCMGCCGCGGTAA-3′ (SEQ ID NO: 3) and primer 806r: 5′-GGACTACHVGGGTWTCTAAT-3′ (SEQ ID NO: 4); where M is A or C; H is A or T or C; V is A or C or G; and W is A or T. For the fungal community analysis, the second internal transcribed spacer (ITS2) region of the rRNA operon was amplified using primer fITS7: 5′-GTGARTCATCGAATCTTTG-3′ (SEQ ID NO: 210) and primer ITS4: 5′-TCCTCCGCTTATTGATATGC-3′ (SEQ ID NO: 211) where R is A or G. The two marker genes were PCR amplified separately using 35 cycles, and staggered 9-bp barcoded primers specific to each sample were used to facilitate combining of samples. To reduce the amplification of chloroplast and mitochondrial DNA, PNA clamps specific to the rRNA genes in these organelles were used. PCR reacti...
example 3
Analysis to Detect Plant Health in Cereal Crops
[0110]The OTU tables generated in Example 2 were used to measure the number of taxonomic units detected (observed diversity) and alpha diversity in the microbial communities for corn (Zea mays).
[0111]FIGS. 7A and 7B show the relative abundance of Phyla and Proteobacteria Classes in corn plants at stage V4. FIG. 7A shows samples that are less robust corn plants (labeled Control). FIG. 7B shows samples that are more robust (labeled Winner). Individual samples are displayed along the x-axis, the relative abundance of OTU in the taxonomic categories listing in the legend are shown on the y-axis. It is apparent that there are more diverse taxonomic categorizations represented in the microbial communities of the more robust corn plants compared to the microbial communities of less robust plants.
[0112]Both the observed and alpha diversity calculations show that increased observed and alpha diversity together are an indicator of plant health. F...
PUM
| Property | Measurement | Unit |
|---|---|---|
| melting temperature | aaaaa | aaaaa |
| melting temperature | aaaaa | aaaaa |
| length | aaaaa | aaaaa |
Abstract
Description
Claims
Application Information
 - R&D
- Intellectual Property
- Life Sciences
- Materials
- Tech Scout
- Unparalleled Data Quality
- Higher Quality Content
- 60% Fewer Hallucinations
Browse by: Latest US Patents, China's latest patents, Technical Efficacy Thesaurus, Application Domain, Technology Topic, Popular Technical Reports.
© 2025 PatSnap. All rights reserved.Legal|Privacy policy|Modern Slavery Act Transparency Statement|Sitemap|About US| Contact US: help@patsnap.com


