Systems and methods for single-cell rna-seq data analysis

a single-cell rnaseq and data analysis technology, applied in the field of systems and methods for single-cell rnaseq data analysis, can solve the problems amplification bias etc., and achieve the effect of low library size, low sequencing depth, and lessening amplification bias

Pending Publication Date: 2020-03-19
AMPEL BIOSOLUTIONS LLC
View PDF0 Cites 5 Cited by
  • Summary
  • Abstract
  • Description
  • Claims
  • Application Information

AI Technical Summary

Benefits of technology

[0003]An average signal of a cell population obtained from conventional sequencing technologies may overlook heterogeneity within a cell population, which can be crucial for analysis of tissue functions and disease progression. Single-cell RNA sequencing (scRNA-Seq) may provide the capability to identify different cell types within a cell population, thereby allowing researchers or clinicians to characterize the subpopulation structure and function of a heterogeneous cell population. However, conventional single-cell sequencing techniques can suffer from low sequencing depth, low library size, and/or amplification bias, due to the small starting amounts of RNA in individual cells. The use of Unique Molecular Identifie...

Problems solved by technology

However, conventional single-cell sequencing techniques can suffer from low sequencing depth, low library size, and/or amplification bias, due to the small starting amounts of RNA in individual cells.
However, data sets generated using U...

Method used


Image

  • Systems and methods for single-cell rna-seq data analysis
  • Systems and methods for single-cell rna-seq data analysis
  • Systems and methods for single-cell rna-seq data analysis

Examples


example 1

g of Peripheral Blood Mononuclear Cells (PBMCs)

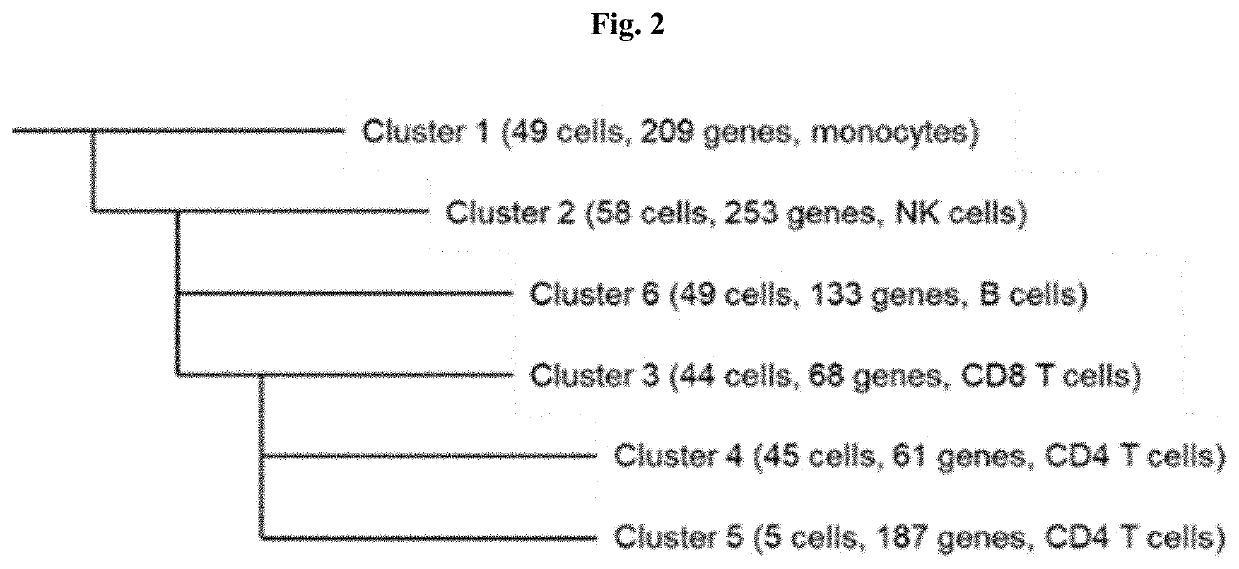
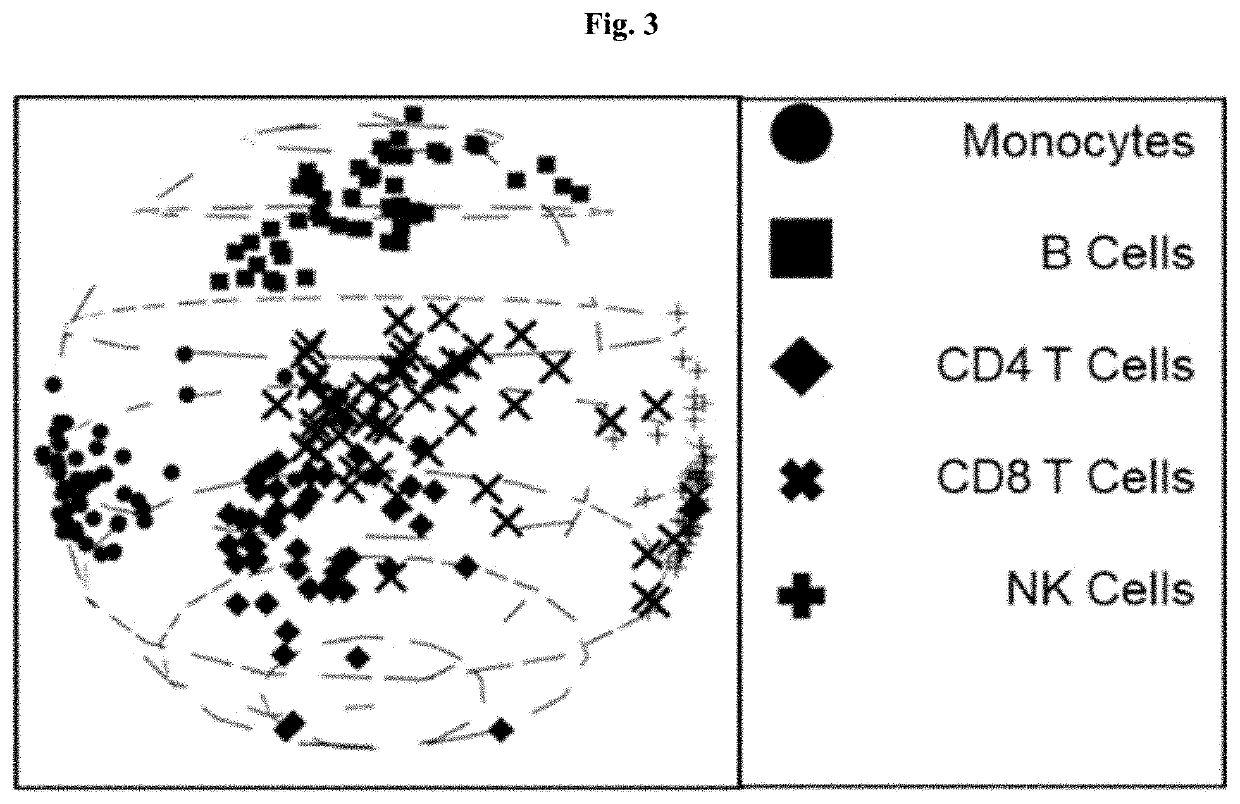
[0106]According to methods and systems provided herein, 250 PBMCs (50 each of CD14 monocytes, CD19 B cells, CD4 helper T cells, CD8 T cells, and CD56 NK cells) were classified into clusters. Without using a priori knowledge of the cell types, 6 clusters were generated that closely corresponded to the known cell types, as shown in FIG. 2. A visualization of 6 clusters on a three-dimensional sphere was generated using sMDS, and shows spatial clustering of each of the cell types. For comparison, hierarchical clustering and one-off spherical k-means with k set to 5 were also performed on the same data sets, and ARI values were obtained for each approach. The hierarchical clustering produced an ARI of 0.45, the one-off spherical k-means approach produced an ARI of 0.89, and the classification according to the methods and systems provided herein produced an ARI of 0.86.

example 2

n of Clustering of PBMCs and Mouse Embryos

[0107]The methods and systems herein were compared with four other clustering methods, including Seurat (using the Seurat R package to apply a graph-based approach for clustering), hierarchical clustering, conventional spherical k-means, and Partitioning Around Medoids (PAM) using two different data sets. One data set included 7 types of peripheral blood mononuclear cells (PBMCs) with 100 cells for each type. Another dataset included 300 mouse embryos at different development stages with 9 known types of cells. Both data sets were analyzed using all 5 clustering methods. For clustering methods other than the methods and systems disclosed herein, the data was normalized, and highly variable genes were filtered. The number of cell types was set as the known number for hierarchical clustering, conventional spherical k-means, and Partitioning Around Medoids (PAM). The Adjusted Rand Index (ARI), which measures the agreement between clusters gener...

example 3

g of Kidney Cells in Lupus Patients

[0108]As shown in FIG. 4, in a particular embodiment, 3,199 cells were obtained from 30 patients and 5 controls 401. The cells were analyzed by scRNA-Seq. There were 19,702 genes in the cells, and all the genes were processed by gene filtering (as in operation 402). After the filtering, data associated with 1,230 variable genes remained for clustering. Genes with low detection rate or associated with mitochondrial transcripts were also filtered out. A user can configure one or more parameters for the clustering algorithm 403. In this embodiment, a user pre-set differentially expressed gene threshold to 60 genes (5% of available genes). The minimum cluster size was set by the user to be 10 cells. Using the systems and methods provided herein, 3,199 cells were automatically clustered with 1,230 genes. As a result, 25 clusters were generated as the output 404. The marker genes of each cluster were determined by Mann-Whitney U tests. These sets of mark...


PUM


Abstract

Disclosed are computer-implemented methods, systems, and media for clustering cells using gene differential expression of single cells. In an aspect, a method may comprise: mapping RNA-Seq data of a plurality of cells onto a sphere (e.g., a hypersphere); calculating a plurality of distances, each of which is associated with an angle between two different cells mapped onto the sphere; clustering the plurality of cells into two clusters based on the plurality of distances; evaluating each of the two clusters using a pre-determined stopping criterion; and repeating the clustering and evaluating on each of the two clusters until the pre-determined stopping criterion or a second stopping criterion is met.

Description

CROSS-REFERENCE[0001]This application claims the benefit of U.S. Provisional Patent Application No. 62 / 725,753, filed on Aug. 31, 2018, the contents of which are hereby incorporated in their entirety.BACKGROUND OF THE INVENTION[0002]Conventional methods for quantifying molecular states of cells such as standard RNA sequencing (RNA-Seq) analysis may use an average signal of multiple cells. Single-cell RNA sequencing (scRNA-Seq) can provide the gene expression profile of individual cells.SUMMARY OF THE INVENTION[0003]An average signal of a cell population obtained from conventional sequencing technologies may overlook heterogeneity within a cell population, which can be crucial for analysis of tissue functions and disease progression. Single-cell RNA sequencing (scRNA-Seq) may provide the capability to identify different cell types within a cell population, thereby allowing researchers or clinicians to characterize the subpopulation structure and function of a heterogeneous cell popul...

Claims


Application Information

Patent Timeline
IPC IPC(8): G16B30/20G16B40/10G16H50/30G16B40/30G16B20/20G16H50/20G16H50/50G06N20/10
CPCG16B20/20G16B40/30G16B40/10G06N20/10G16H50/30G16H50/20G16B30/20G16H50/50G16B25/10G16B20/00
Inventor LIPSKY, PETER E.KEGERREIS, BRIANGRAMMER, AMRIE C.
Owner AMPEL BIOSOLUTIONS LLC
Why Eureka
Try Eureka