

Methods and systems for crop pest management utilizing geospatial images and microclimate data
- Summary
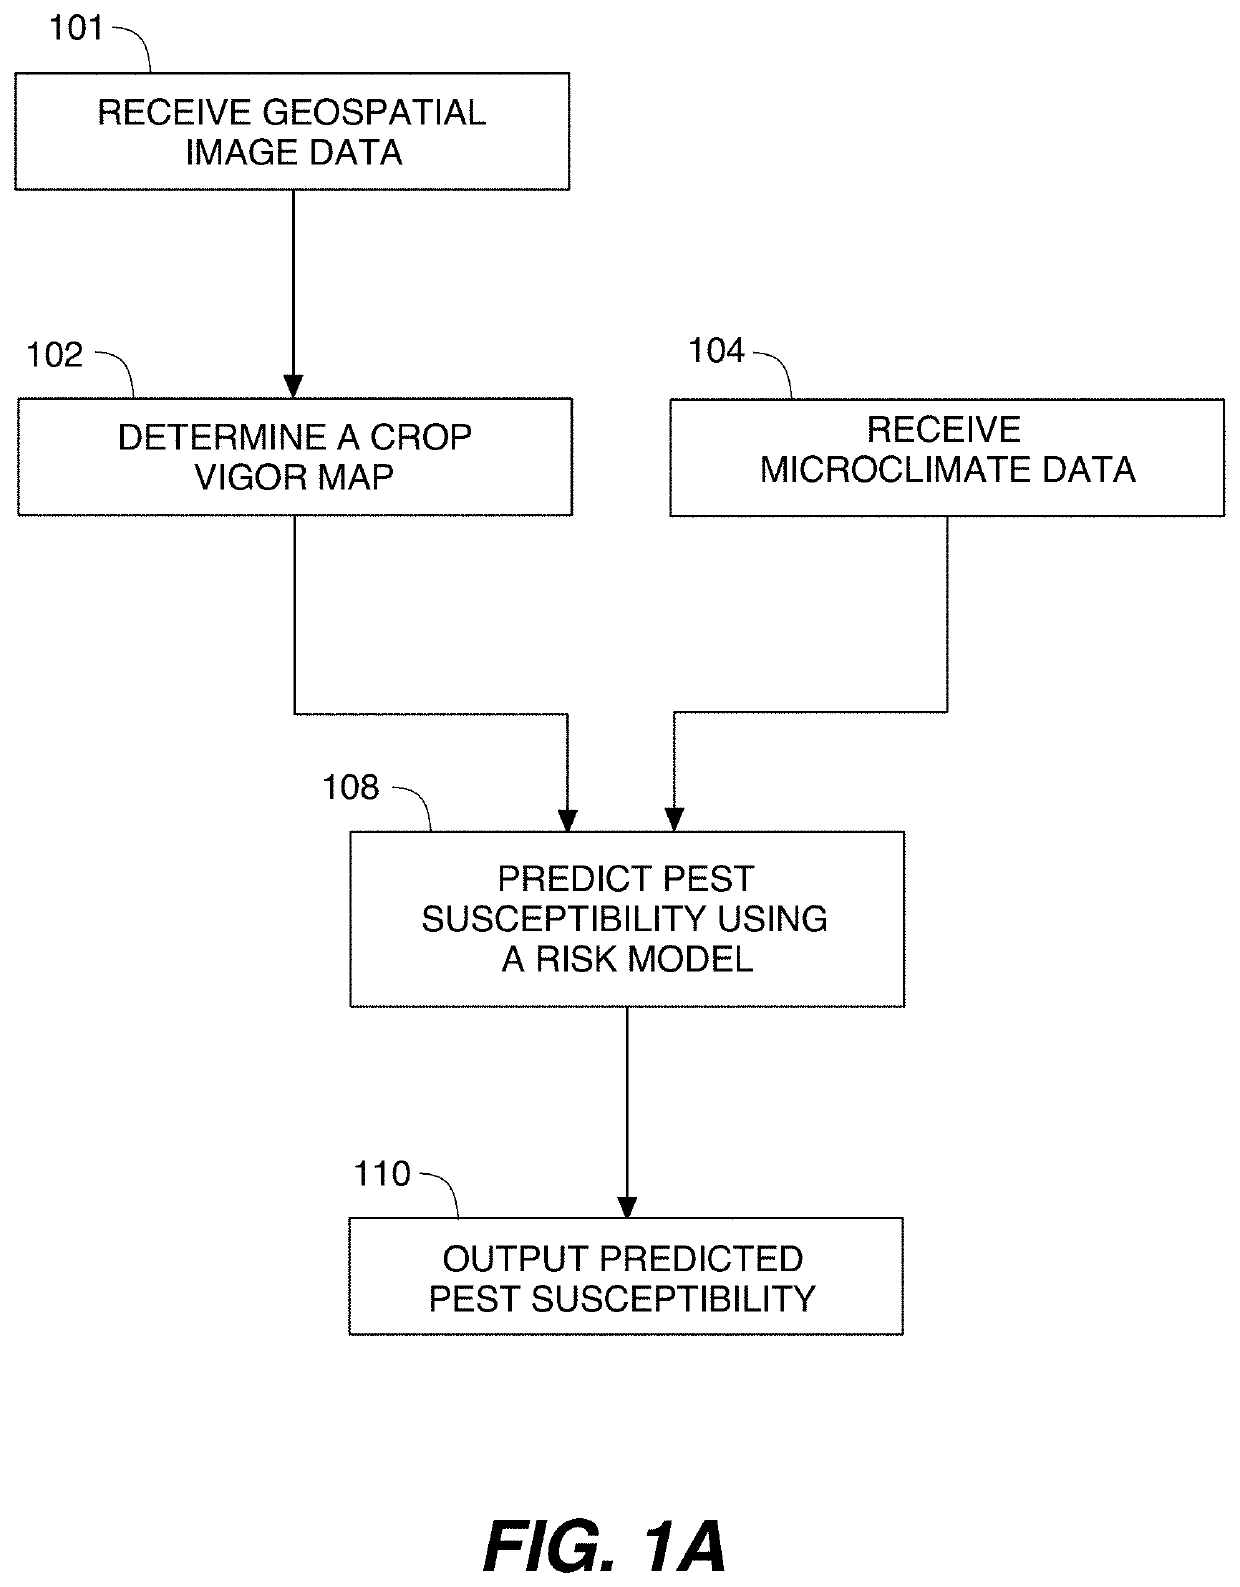
- Abstract
- Description
- Claims
- Application Information
AI Technical Summary
Benefits of technology
Problems solved by technology
Method used
Image

Examples
example use cases
and Proof-of-Concept of the Present Invention
[0145]FIG. 11 shows an exemplary relationship between canopy temperature and crop vigor index. The measurements are derived from CERES IMAGING sensors for a specific crop field and show a plotted regression line illustrating the linear relationship between the two quantities. The variable on the x-axis is a crop vigor index similar to NDVI or NDRE, and the y-axis is temperature in degrees Fahrenheit.
[0146]The plot of FIG. 11 highlights how diurnal canopy temperatures (solar noon) are generally warmer where the canopy is open / weak. Most of the ˜10,000 points from this soybean field are clustered at a relatively dense canopy with indices ranging from −0.1 to 0.0. FIG. 11 shows that this dense canopy is cooler during the day (i.e., less than 70 degrees Fahrenheit). These parts of the field are more susceptible to diseases such as white mold. The strong correlation between the crop vigor index on the x-axis and canopy temperature on the y-axi...
PUM
 Abstract
Description
Claims
Application Information