A polypeptide having xylanase activity
a polypeptide and activity technology, applied in the field of isolated polypeptides with xylanase activity, can solve the problems of reducing enzyme performance and technical challenges in the production of biofuels from lignocellulose biomass
- Summary
- Abstract
- Description
- Claims
- Application Information
AI Technical Summary
Benefits of technology
Problems solved by technology
Method used
Image
Examples
example 1
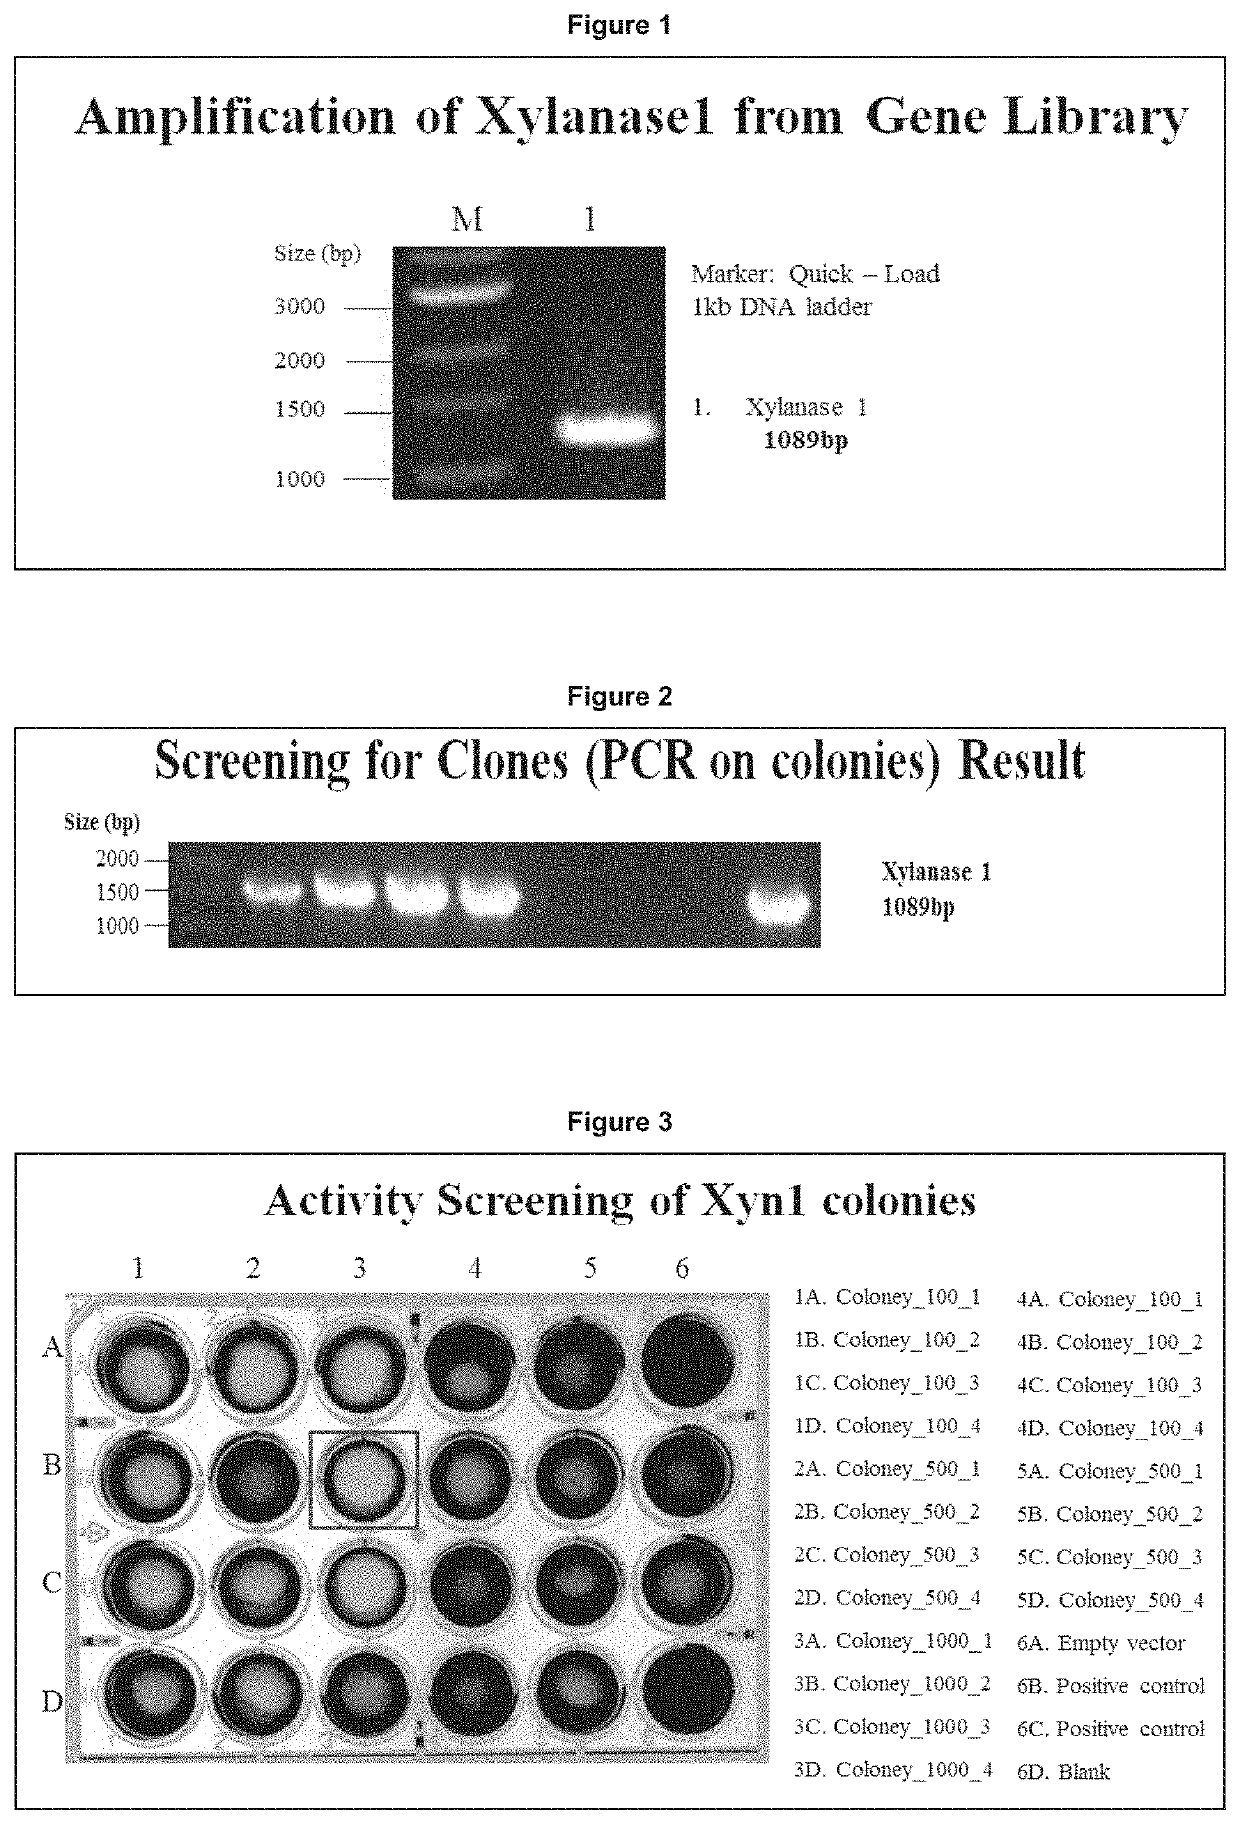
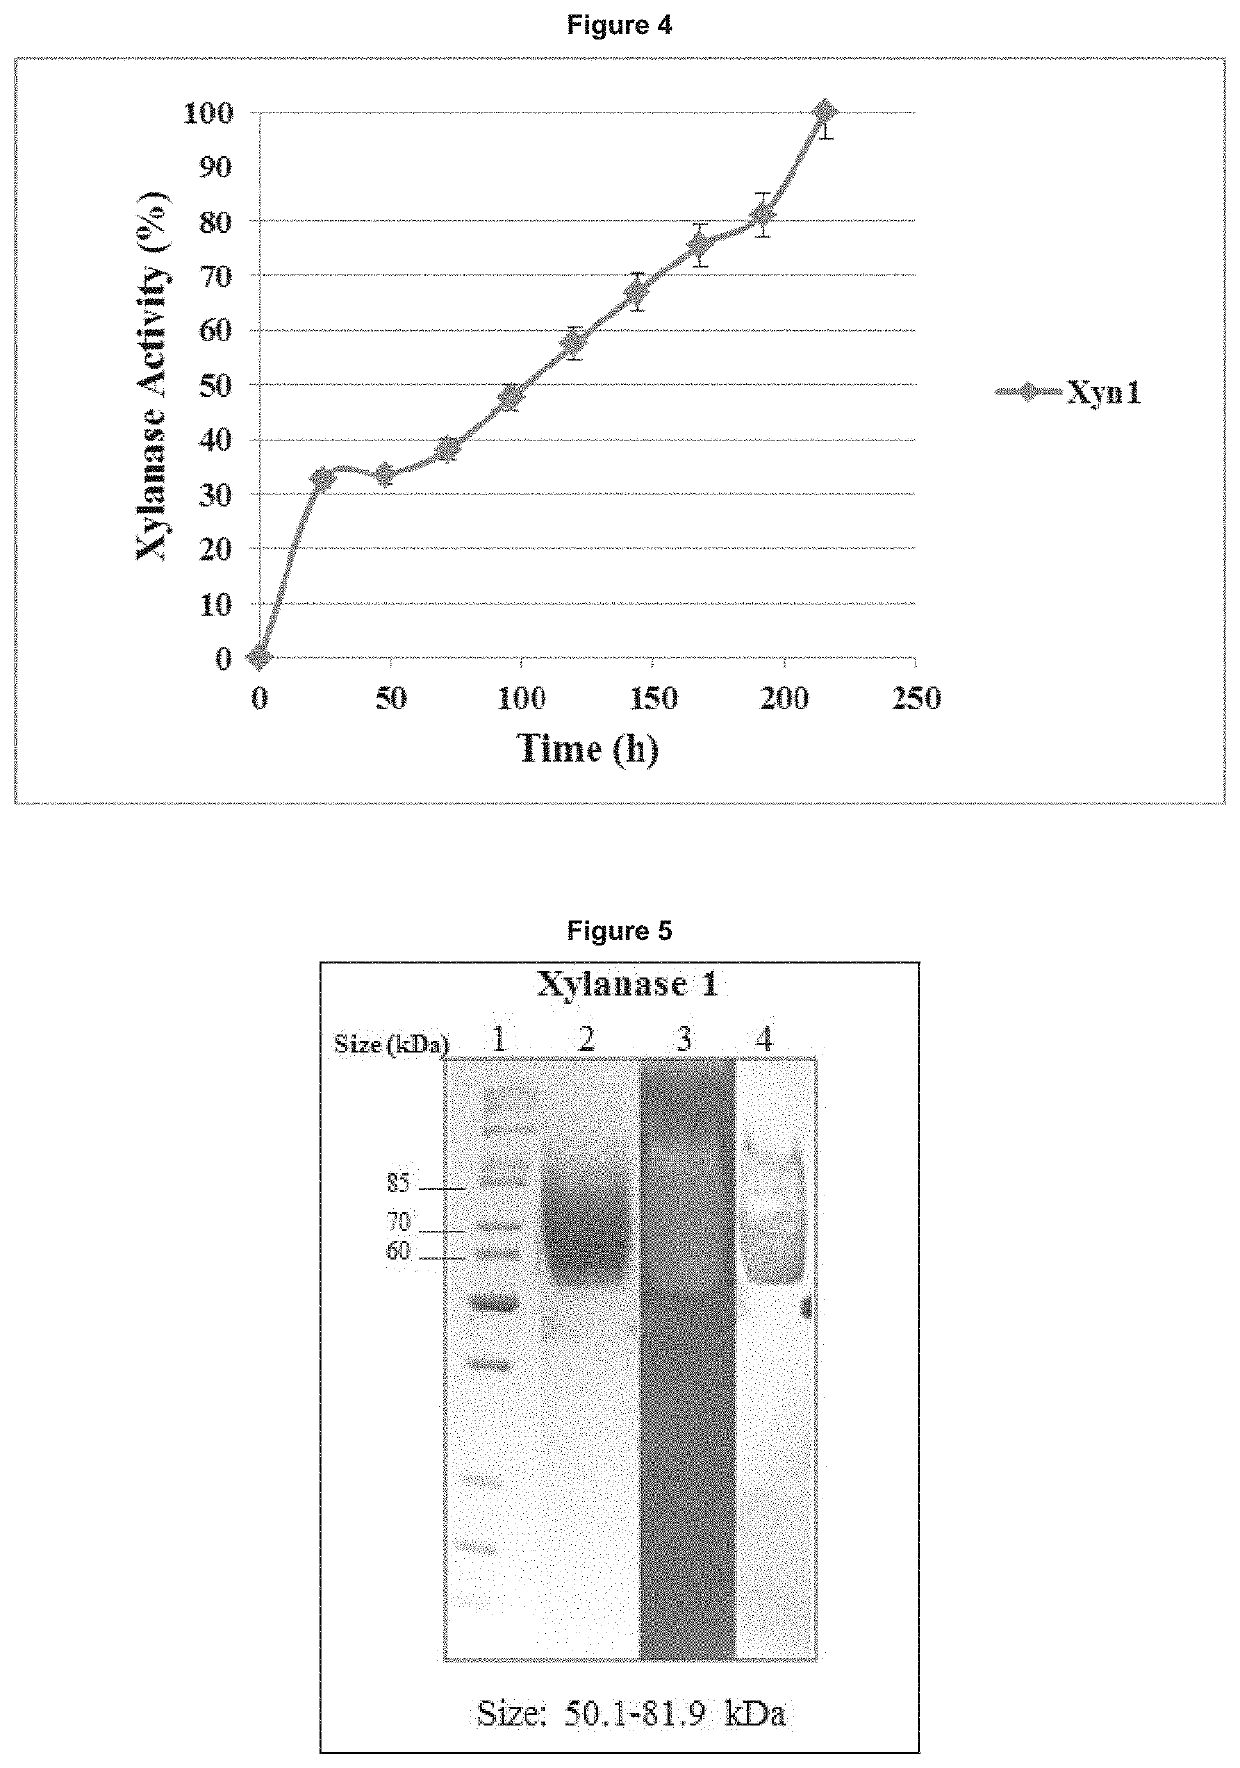
[0227]Amplification of the Isolated Polypeptide (Xyn1)
[0228]PCR reactions were carried out using insert-containing vector as a template (ordered from Eurofins) and Herculase II Fusion polymerase from Agilent Technologies Ireland. The primers used in the amplification of xyn1 are listed in Table 1 and the PCR cycle parameters are listed in Table 2. The primers were designed to omit the signal sequence of each sequence.
TABLE 1PCR primers designed to amplify xyn1 genefrom a gene library. All genes were sub-cloned into pICZα vectors.SignalRestrictionForwardEnzymeVectorSequenceenzymeprimerXyn 1pICZα 1-18EcoR1gggggaattcTTAGCTATTCAACTCGAACCXba1ggggtctagagtGCACACACTACAACTCACC
TABLE 2PCR conditions for amplifying DNA from PJET vectors.Temperature (° C.)TimeNumber of cycles952min19520s5820s357245s725min1
[0229]After the PCR reaction cycles described above were complete, the DNA samples were loaded onto the agarose gel (FIG. 1). The DNA ladder; Quick-Load 1 kb DNA ladder form New England Biolabs...
example 2
[0274]Determination of pH Versus Activity Profiles
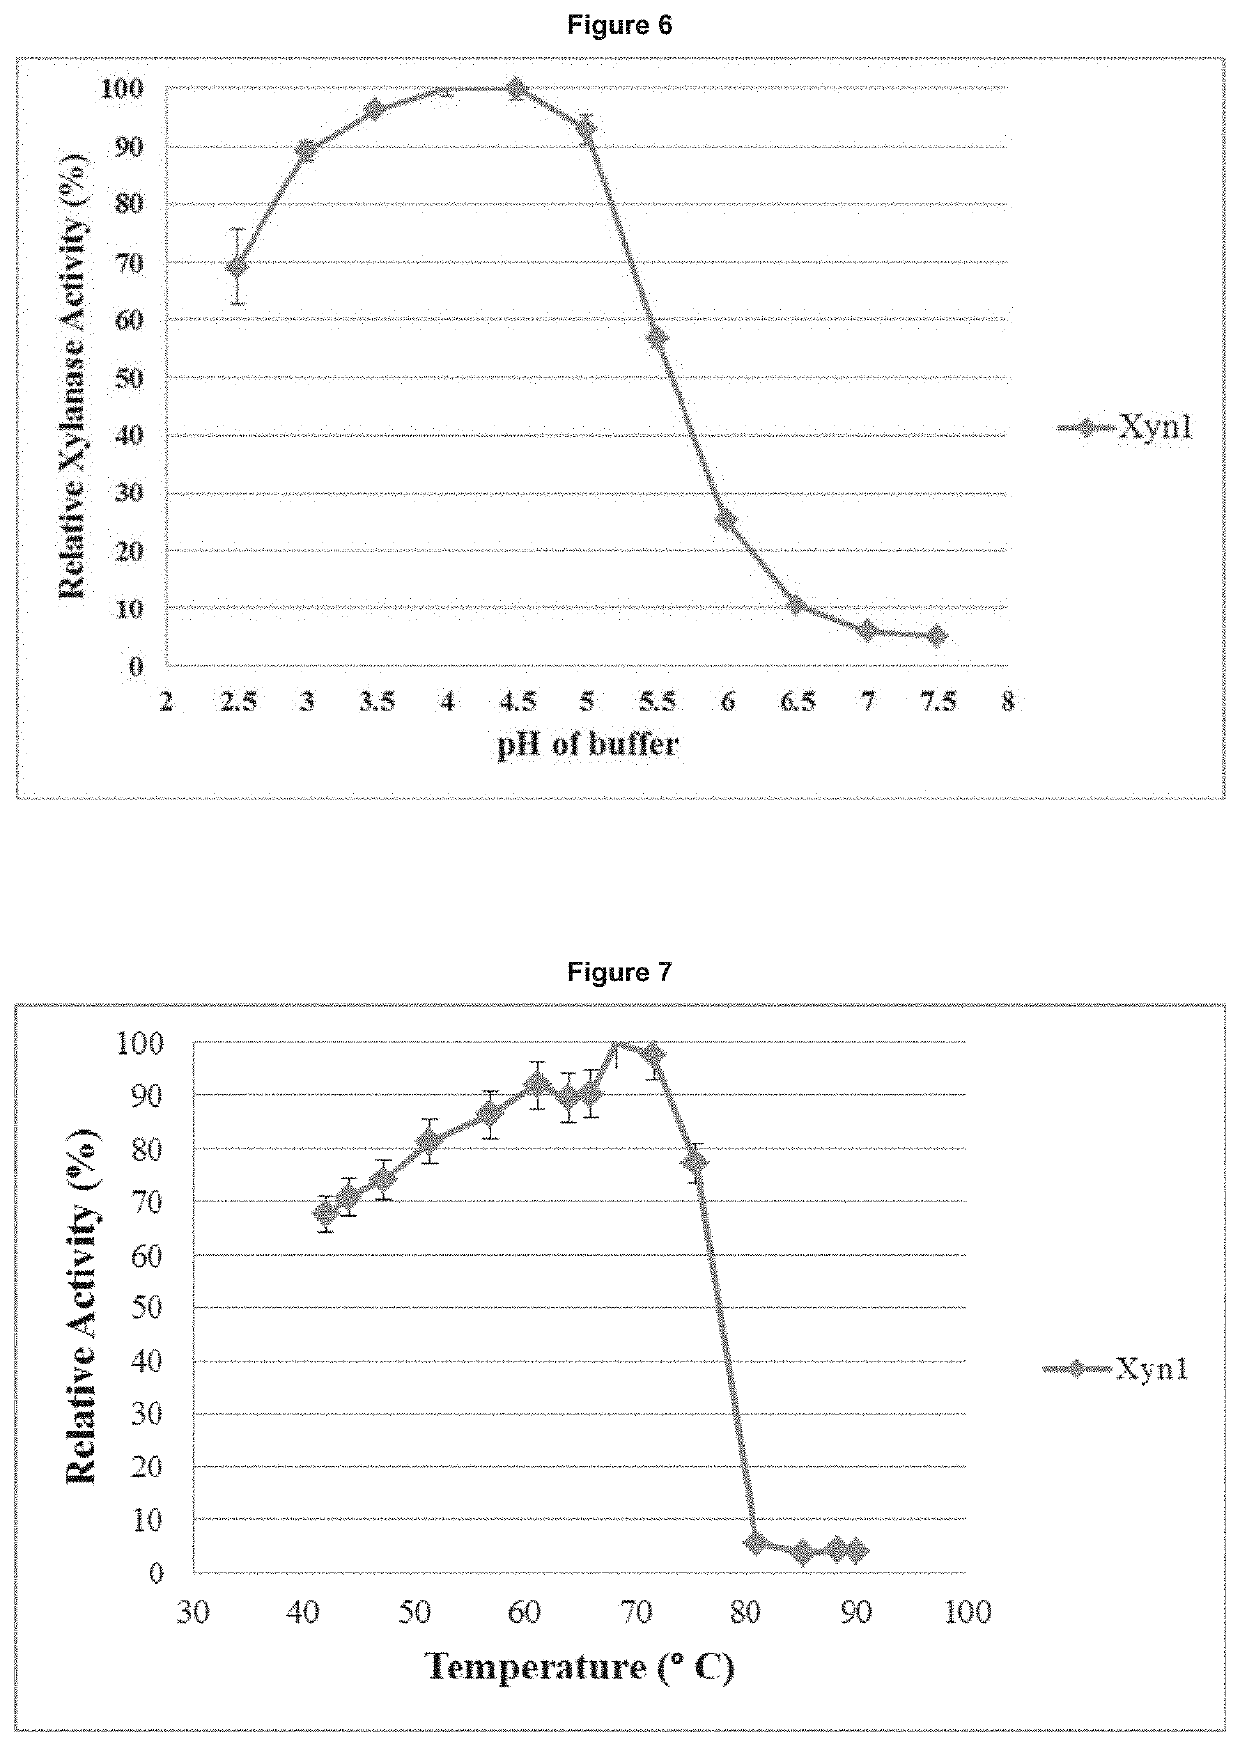
[0275]Activity versus pH profiles were obtained for the purified enzymes according to the methods of Kamble et al., 2012; Liao et al., 2015; and Miller, 1959; with some modifications. Each enzyme was assayed for activity in triplicate by the standard assay procedure as described herein. The pH values tested were pH 2.5, 3.0, 3.5, 4.0, 4.5, 5.0, 5.5 and 6.0 in 100 mM citrate buffer. The results were plotted as either percentage relative activity. The relative xylanase activity at the various pH values was determined as a percentage of the pH where optimum activity was observed. Percent relative activity verses pH was plotted to yield the pH profile for the enzymes (FIG. 6).
example 3
[0276]Determination of Temperature Versus Activity Profiles
[0277]Temperature versus activity profiles were obtained according to the modified methods of Miller, et al. 1959. The profiles were obtained by carrying out the xylanase assay as described herein in triplicate at different temperatures for both the pure and crude enzyme. Temperatures in the range of 45-90° C. were used. The relative activity at the different temperature values was calculated as a percentage of activity at the optimum temperature. Temperature values versus percentage relative activities were plotted to yield the temperature profile for the crude and purified xylanase. The results were plotted as either percentage relative activity or specific activity verses temperature values (FIG. 7).
PUM
| Property | Measurement | Unit |
|---|---|---|
| Temperature | aaaaa | aaaaa |
| Fraction | aaaaa | aaaaa |
| Fraction | aaaaa | aaaaa |
Abstract
Description
Claims
Application Information
 - R&D
- Intellectual Property
- Life Sciences
- Materials
- Tech Scout
- Unparalleled Data Quality
- Higher Quality Content
- 60% Fewer Hallucinations
Browse by: Latest US Patents, China's latest patents, Technical Efficacy Thesaurus, Application Domain, Technology Topic, Popular Technical Reports.
© 2025 PatSnap. All rights reserved.Legal|Privacy policy|Modern Slavery Act Transparency Statement|Sitemap|About US| Contact US: help@patsnap.com


