

Carbon nanotube based resonant-circuit sensor
a resonant-circuit sensor and carbon nanotube technology, applied in the direction of instruments, specific gravity measurement, mechanical means, etc., can solve the problem of expensive microfabrication techniques for forming sensors, and achieve the effect of fast response times
- Summary
- Abstract
- Description
- Claims
- Application Information
AI Technical Summary
Benefits of technology
Problems solved by technology
Method used
Image

Examples
example 1
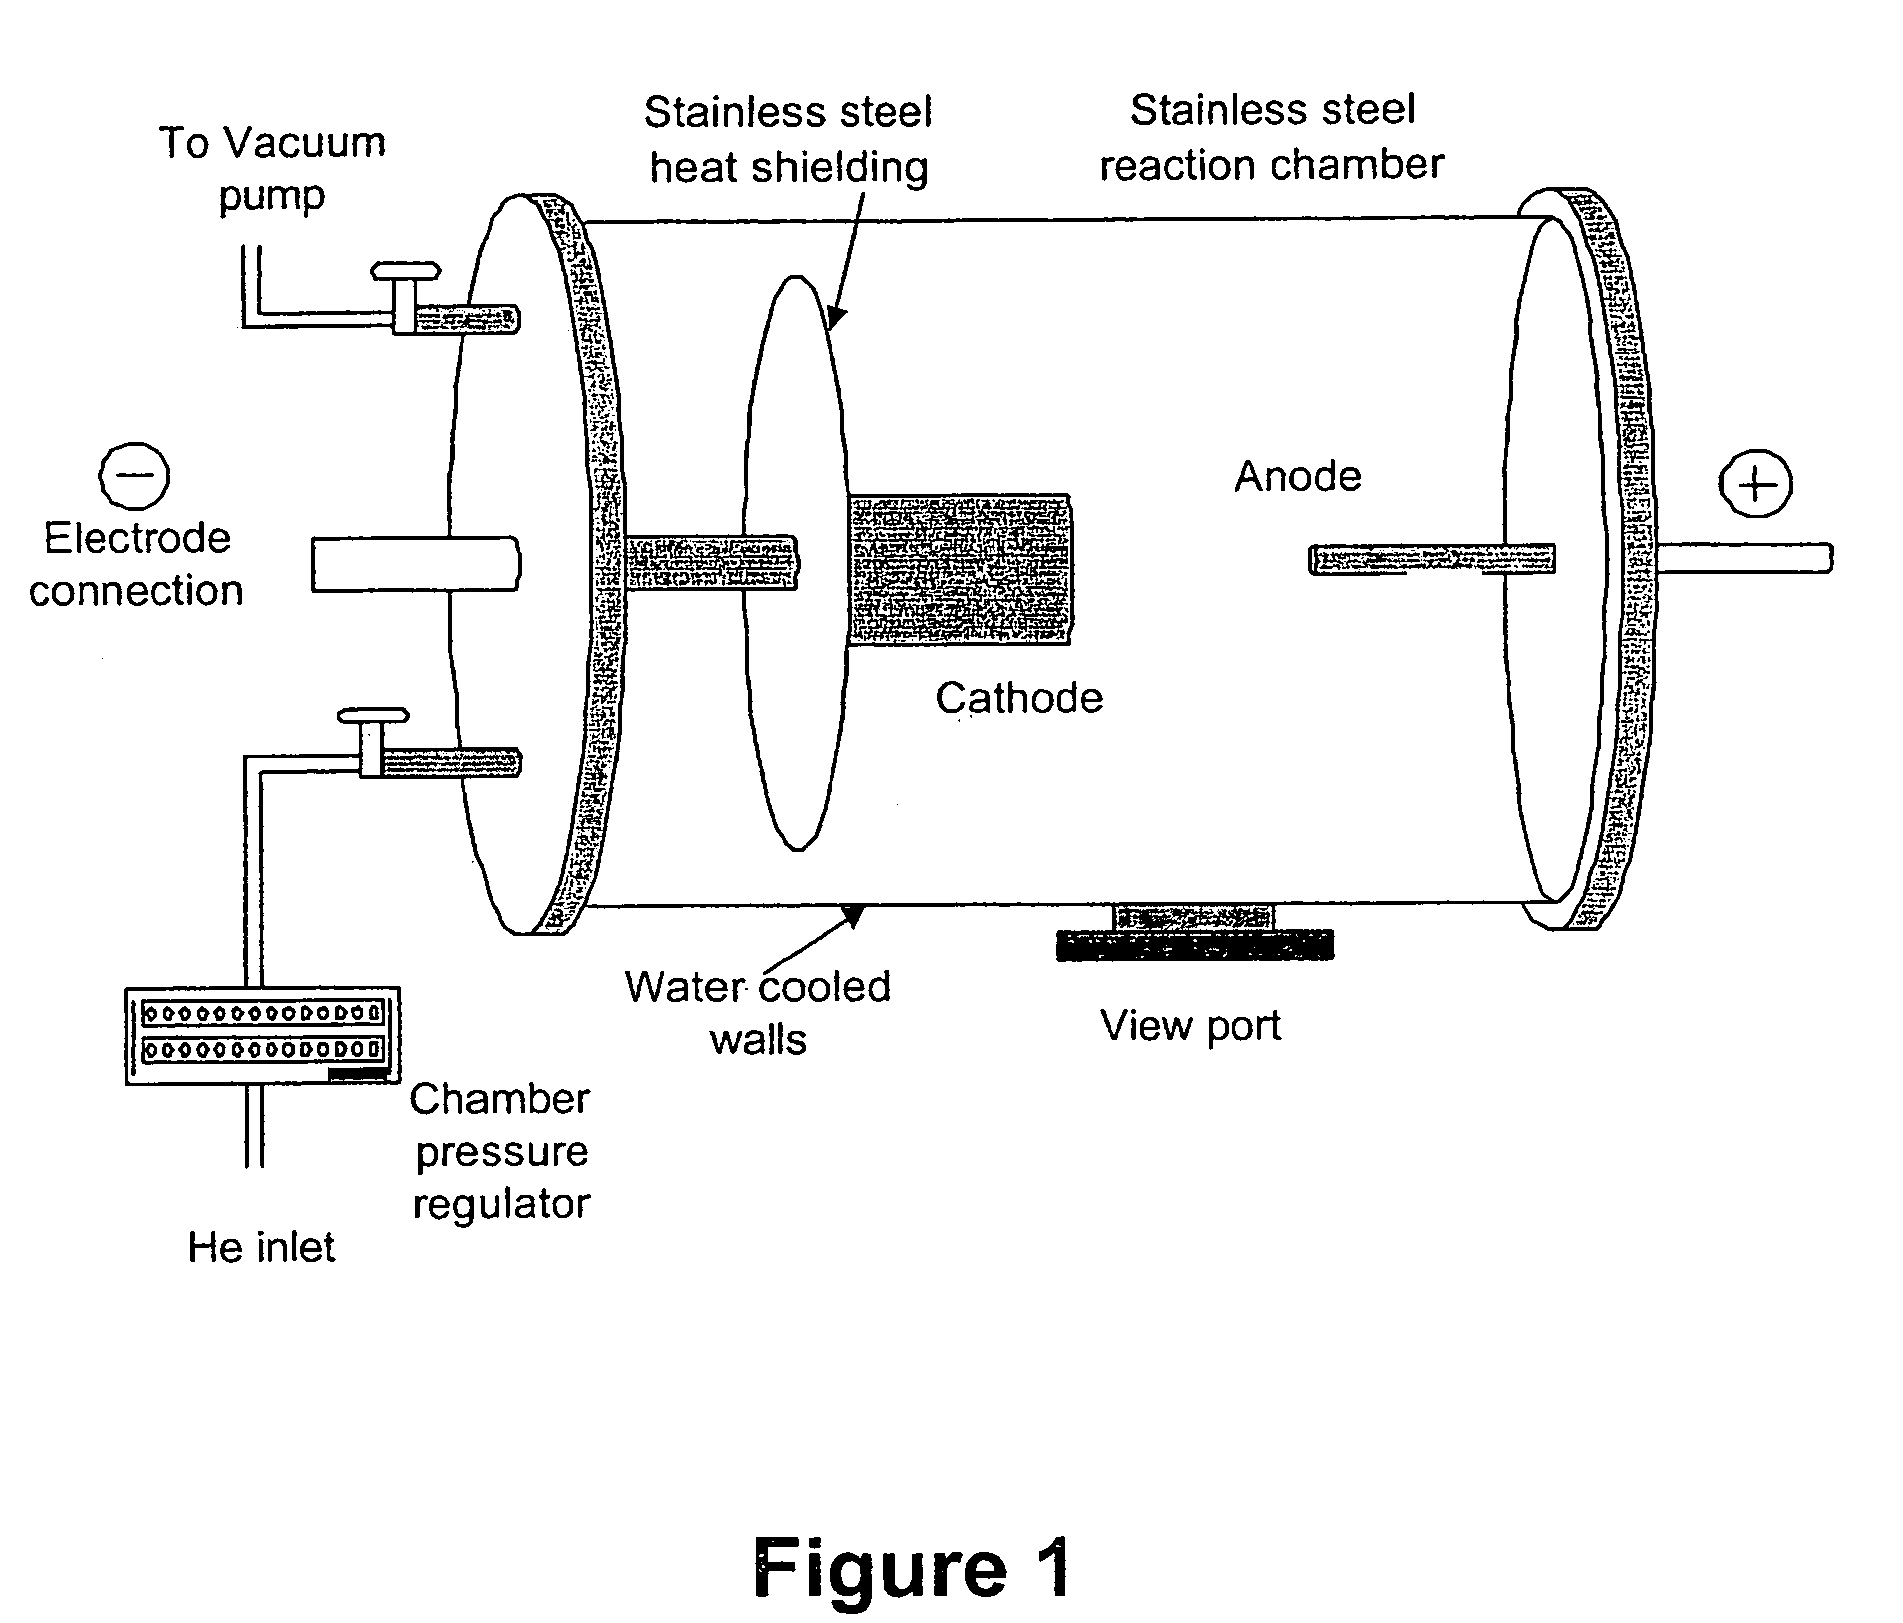
[0060]A circular disk resonator such as that illustrated in FIGS. 4A and 4B was formed. The circular disk resonator included a Duroid Board (Rogers R04003) that was milled to fabricate a circular disk resonator resonating at 4 GHz. The surface of the micro-strip disk was coated to a depth of about 2 μm with a layer including single-walled nanotubes formed according to an arc-discharge process as illustrated in FIG. 1. The SWNT-containing layer was coated on the micro-strip disk using a conductive epoxy (CW2400, Circuit Works) as the adhesive. This resonator sample was then placed in a testing chamber as illustrated in FIG. 6. The response of the sensor was monitored under different gas environments.
[0061]FIG. 9 shows the response of the resonator under helium. The solid line shows the response of the resonator in air. In air, the sensor displayed a resonant frequency of 3.887 GHz. The chamber was then pulled down to high vacuum (˜10−5 torr) and heated to ˜125° C. for about 12 hours ...
example 2
[0062]The response of the sensor of Example 1 was measured in oxygen. FIG. 10 shows the response of the resonator to oxygen. The first two curves are the same as the corresponding curves in FIG. 9. The third curve (circles) is the response of the sensor to oxygen. As can be seen, the resonant frequency of the resonator shifted from 3.8885 GHz in helium to 3.887 GHz in oxygen. This is very close to the resonant frequency value that was obtained in air. This strengthens the assumption that the electrical properties of pristine nanotubes are affected both by chemisorption and physisorption. This also reinforces the understanding that in as-prepared samples, the oxygen molecules have already interacted with the nanotubes and hence a similar shift was seen for air and oxygen gas exposures from the degassed value of resonant frequency.
[0063]Measurements were also carried out with argon and nitrogen and proportional shifts in the resonant frequency of the sensor circuit were observed, as c...
example 3
[0064]Experiments were conducted on the degassed SWNT sensor circuits of Examples 1 and 2 to monitor their response to the presence of polar gases. FIG. 8 shows the response of a SWNT-containing sensor to ammonia and carbon monoxide. The first curve (solid line) is the response of the sensor in air with a resonant frequency of 3.887 GHz. The second curve (squares) is the response of the sample after the nanotubes have been degassed. These are the same as the corresponding curves as shown in FIGS. 9 and 10. The third curve (circles) is the response of the sensor circuit in carbon monoxide. The resonant frequency has shifted to 3.885875 GHz showing a downshift of 3.375 GHz. This shift is more than that of oxygen, which strengthens the belief that polar gases have a more pronounced effect on the dielectric properties of nanotubes. This can be due to the marked difference in the dielectric constants of polar and non-polar gases.
[0065]The fourth curve (crosses) shows the response of the ...
PUM
| Property | Measurement | Unit |
|---|---|---|
| depth | aaaaa | aaaaa |
| temperature | aaaaa | aaaaa |
| resonant frequency | aaaaa | aaaaa |
Abstract
Description
Claims
Application Information