Method and apparatus for predicting the failure of a component

a technology of failure prediction and component, applied in the direction of instruments, nuclear elements, computation using denominational number representation, etc., can solve the problems of safety factors adding unnecessary redundancy, weight, cost, etc., and affecting the reliability of components

Active Publication Date: 2006-03-21
VEXTEC CORP
View PDF14 Cites 101 Cited by
  • Summary
  • Abstract
  • Description
  • Claims
  • Application Information

AI Technical Summary

Benefits of technology

[0035]FIG. 14 is a histogram of fatigue lives for 1000 small size bars tested at 90 ksi for Example 3;

Problems solved by technology

For example, one machine element may last many years, yet another element produced by the same manufacturer may fail in a few months.
But safety factors can add unnecessary redundancy, weight, and cost to a component because the true safe life of the component may be much greater than the predicted safe life.
Fatigue can occur in any device that has moving components.
Fatigue can also occur in cases where the movement is imperceptible as do, for example, bridge elements or railroad tracks.
Components also often fail in an insidious manner, giving no prior indication that damage has occurred.
In the case of an aircraft engine, for example, such fatigue failures can be catastrophic.
Failure analysis has revealed that actual component loadings are often well below the steady loads that can cause failure.
What distinguishes these failures is the fact that the loads have been applied a large number of times. Fatigue, more specifically fatigue crack initiation and growth, is therefore a damage mechanism that degrades the reliability and safe life of components subjected to repeated loads.
Designing for fatigue is difficult because it typically exhibits a large variation in its effect on similar components.
Thus, the considerable scatter in the fatigue reliability of components in operation may be substantially attributed to considerable scatter of component material fatigue behavior.
Traditional methods, however, fail to determine the probability of crack initiation or to describe crack growth of near-grain-sized cracks.
In many applications failure can occur before the fatigue damage reaches the long crack stage because the energy associated with the damage is very high although the damage is very small.
But these models do not account for the mechanisms of the microstructural parameters that regulate fatigue damage.
Since this major source of scatter (i.e. microstructural crack initiation, which includes both crack nucleation and small crack growth) is not included in these models, they are necessarily unsatisfactory because they cannot represent the heterogeneous material in which the damage processes occur.
Because traditional crack initiation models are empirical, they cannot represent conditions not included in the established database test program.
While current long crack growth propagation models are able to account for sequential variation in the component usage, it is not practical from a time and cost standpoint to include sequential variations in the applied stress under most test programs.
Additionally, these traditional models are unsatisfactory for predicting individual component failure because the vast majority of components by definition do not possess these unlikely worst case material properties.
Predictions made using such models are based upon the worst case material properties and are thus inaccurate.

Method used


Image

  • Method and apparatus for predicting the failure of a component
  • Method and apparatus for predicting the failure of a component
  • Method and apparatus for predicting the failure of a component

Examples


example 1

[0074]The following example applies the method of the present invention to a γ prime-strengthened nickel superalloy to derive a microstructure-based fatigue failure model and is illustrated by FIGS. 7 and 8. It also reflects the numbering and methods of FIGS. 3(a)–3(e) throughout. The example is applicable to the general class of nickel superalloys. The discrete microscopic structural elements of a material were identified 1 through literature search 4 and direct microscopic observations 5. Through literature search 4 it was determined that the alloy was face center cubic single phase with polycrystalline grains. For this example, no direct observations of specimen samples 5 were required. Information in the literature was used to estimate the statistics defining the geometry of the microstructure 6 as characterized 7 by the values in Table 1 for the grain diameter, slip orientation of surface grains, and slip orientation of interior grains.

[0075]

TABLE 1Characterization of the physi...

example 2

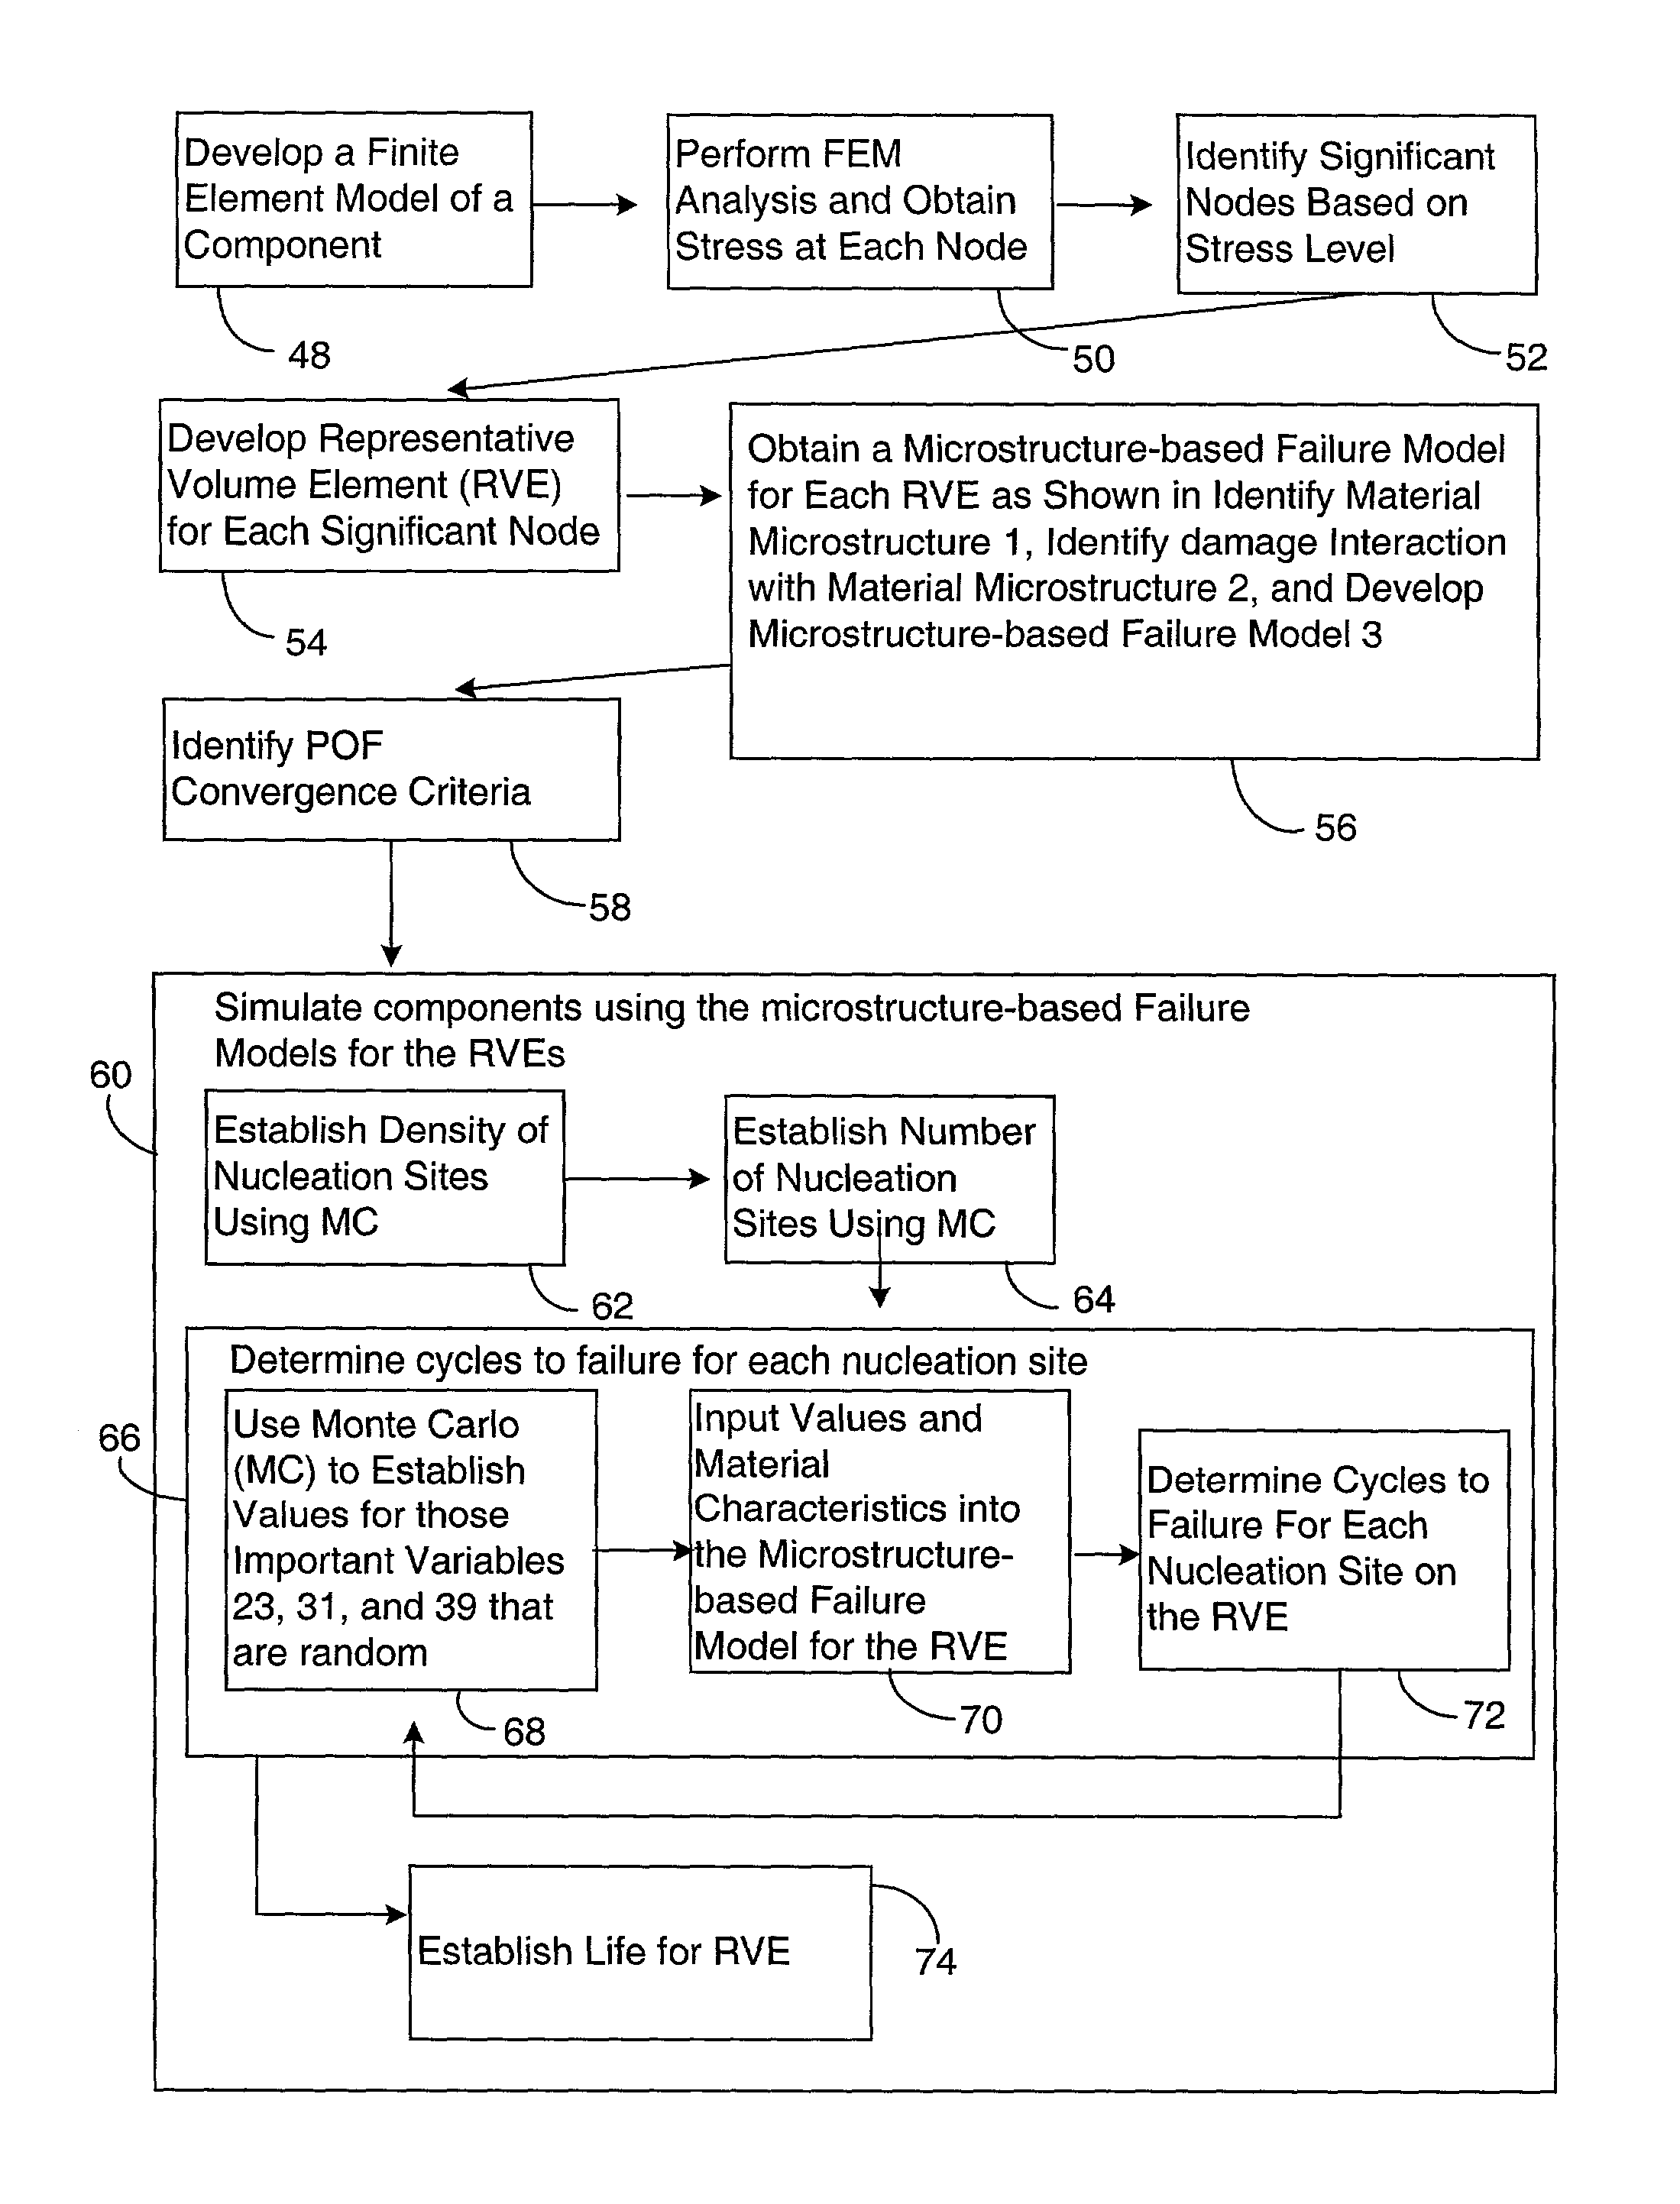
[0098]The following example applies a preferred embodiment of the method of the present invention to predicting fatigue failure of a bolt hole using probabilistic microstructure-based models using Finite Element Method (FEM) results. It reflects the numbering of FIGS. 3(a)–3(e) throughout and is further illustrated using FIGS. 9–13. This example illustrates the development of methods to model geometrically complex components with complex stress distributions and predict the failure of the component. The output from typical FEM analyses are used to find the elastic global stress at each node 50 of the FEM model. The macro-stress does not consider any microstructural interactions as opposed to the microstress that is the stress caused by the interaction of the microstructure. A representative volume (or surface area) element (RVE) is determined for each node 54. The RVE grid is different from the FEM grid. Actually, not all nodes of the FEM model need be considered. The RVE developmen...

example 3

[0113]The following example illustrates a preferred embodiment of the method of the invention that uses probabilistic microstructure-based models using FEM results to large RVEs. The example is further illustrated by FIGS. 10, 14, and 15. The probabilistic microstructure fatigue model evaluates the fatigue resistance of each nucleation site of the RVE. A large structure such as a bridge could easily have very large RVEs that could have more than 1010 nucleation sites. If, during the fatigue simulation, we wish to consider thousands of structures, the number of nucleation sites to consider becomes large and the computational time can become significant. In this example, we will extend the concept of the extreme value statistics to fatigue of large RVEs.

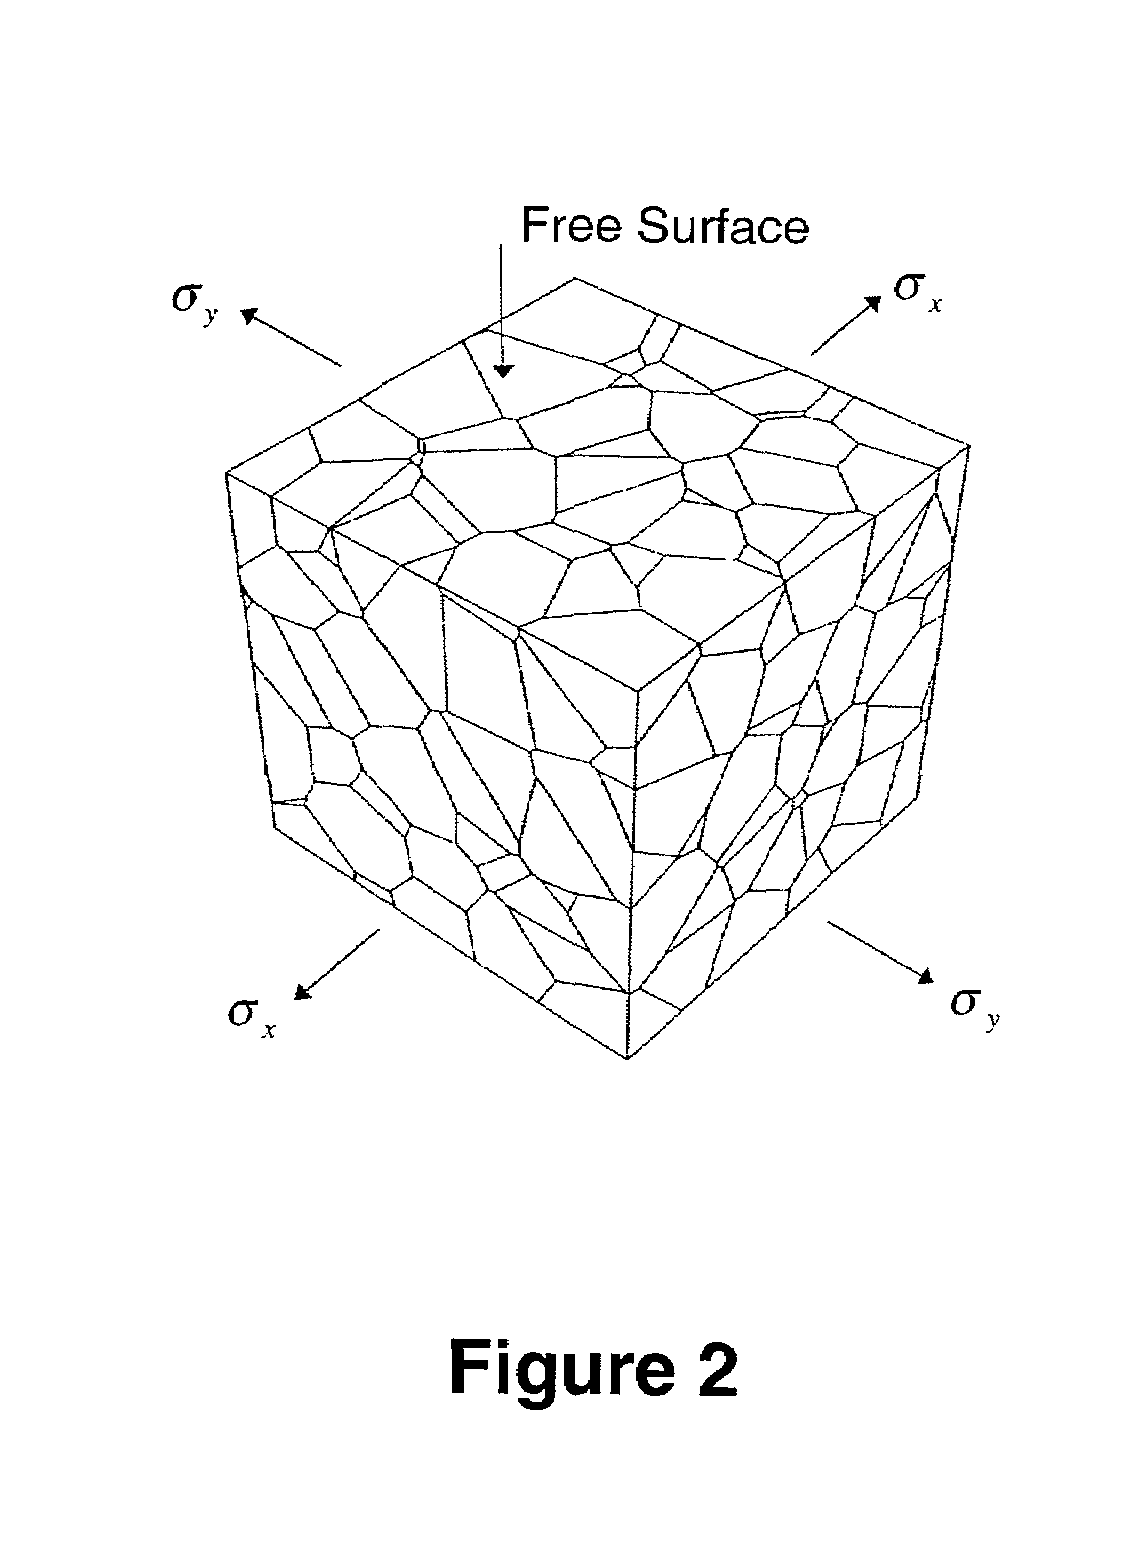
[0114]Consider a large RVE that has a fatigue response controlled by transgranular (non-defect) crack nucleation. The fatigue response of the structure is an extreme value problem because the grain that nucleates a crack and grows to f...


PUM


Abstract

The invention provides a method and apparatus for predicting the failure of a component using a probabilistic model of a material's microstructural-based response to fatigue. The method predicts the component failure by a computer simulation of multiple incarnations of real material behavior, or virtual prototyping. The virtual prototyping simulates the effects of characteristics that include grain size, grain orientation, micro-applied stress and micro-yield strength that are difficult to simulate with real specimens. The invention provides an apparatus for predicting the response of a component to fatigue using the method.

Description

[0001]The patent claims priority pursuant to 35 U.S.C. § 119(e)1 to provisional application 60 / 243,880 filed Oct. 26, 2000.[0002]This invention was made with Government support under F33615-00-C-5209 awarded by the United States Air Force. The Government has certain rights in this invention.BACKGROUND OF THE INVENTION[0003]1. Field of the Invention[0004]This invention relates to a method and apparatus for predicting failure of a component. More specifically it relates to a method and apparatus for predicting failure of a component using a microstructure-based fatigue model developed using probabilistic methods.[0005]2. Description of the Related Art[0006]Ever increasing economic demands require that components and structures have high reliability. It is usually the case that similar components experience large variations in their total life. For example, one machine element may last many years, yet another element produced by the same manufacturer may fail in a few months. Tradition...

Claims


Application Information

Patent Timeline
Patent Type & Authority Patents(United States)
IPC IPC(8): G06F7/48
CPCG06F17/5018G06F2217/10G06F30/23G06F2111/08
Inventor TRYON, III, ROBERT G.
Owner VEXTEC CORP
Why Eureka
Try Eureka