Method for optical measurements of tissue to determine disease state or concentration of an analyte

a tissue and optical measurement technology, applied in the field of apparatus and method for noninvasive diagnosis of disease state or noninvasive determination of concentrations of analytes in vivo, can solve the problems of different range, blindness, coma, and ultimately death of patients, and achieve the effect of reducing the risk of blindness, and reducing the number of patients

Inactive Publication Date: 2007-01-23
ABBOTT DIABETES CARE INC
View PDF41 Cites 208 Cited by
  • Summary
  • Abstract
  • Description
  • Claims
  • Application Information

AI Technical Summary

Problems solved by technology

These differences result in a difference in the scattering characteristics of the skin of diabetic subjects.
However, differences in crosslinking of collagen for diabetics may lead to a different range for the dimensional parameter “a” between the diabetic and the non-diabetic groups.
In its advanced stages, diabetes can cause blindness, coma, and ultimately death.
Thus, a deficiency in the LDF prior art is the lack of inclusion of temperature dependence of scattering in the classification and diagnosis of diabetes complications.
Although a variety of detection techniques have been disclosed in the art, there is still no commercially available device that provides reliable non-invasive measurements of blood glucose level.
As a result, current approaches to non-invasive metabolite testing, such as glucose monitoring, have not achieved wide acceptance.

Method used


Image

  • Method for optical measurements of tissue to determine disease state or concentration of an analyte
  • Method for optical measurements of tissue to determine disease state or concentration of an analyte
  • Method for optical measurements of tissue to determine disease state or concentration of an analyte

Examples


example 1

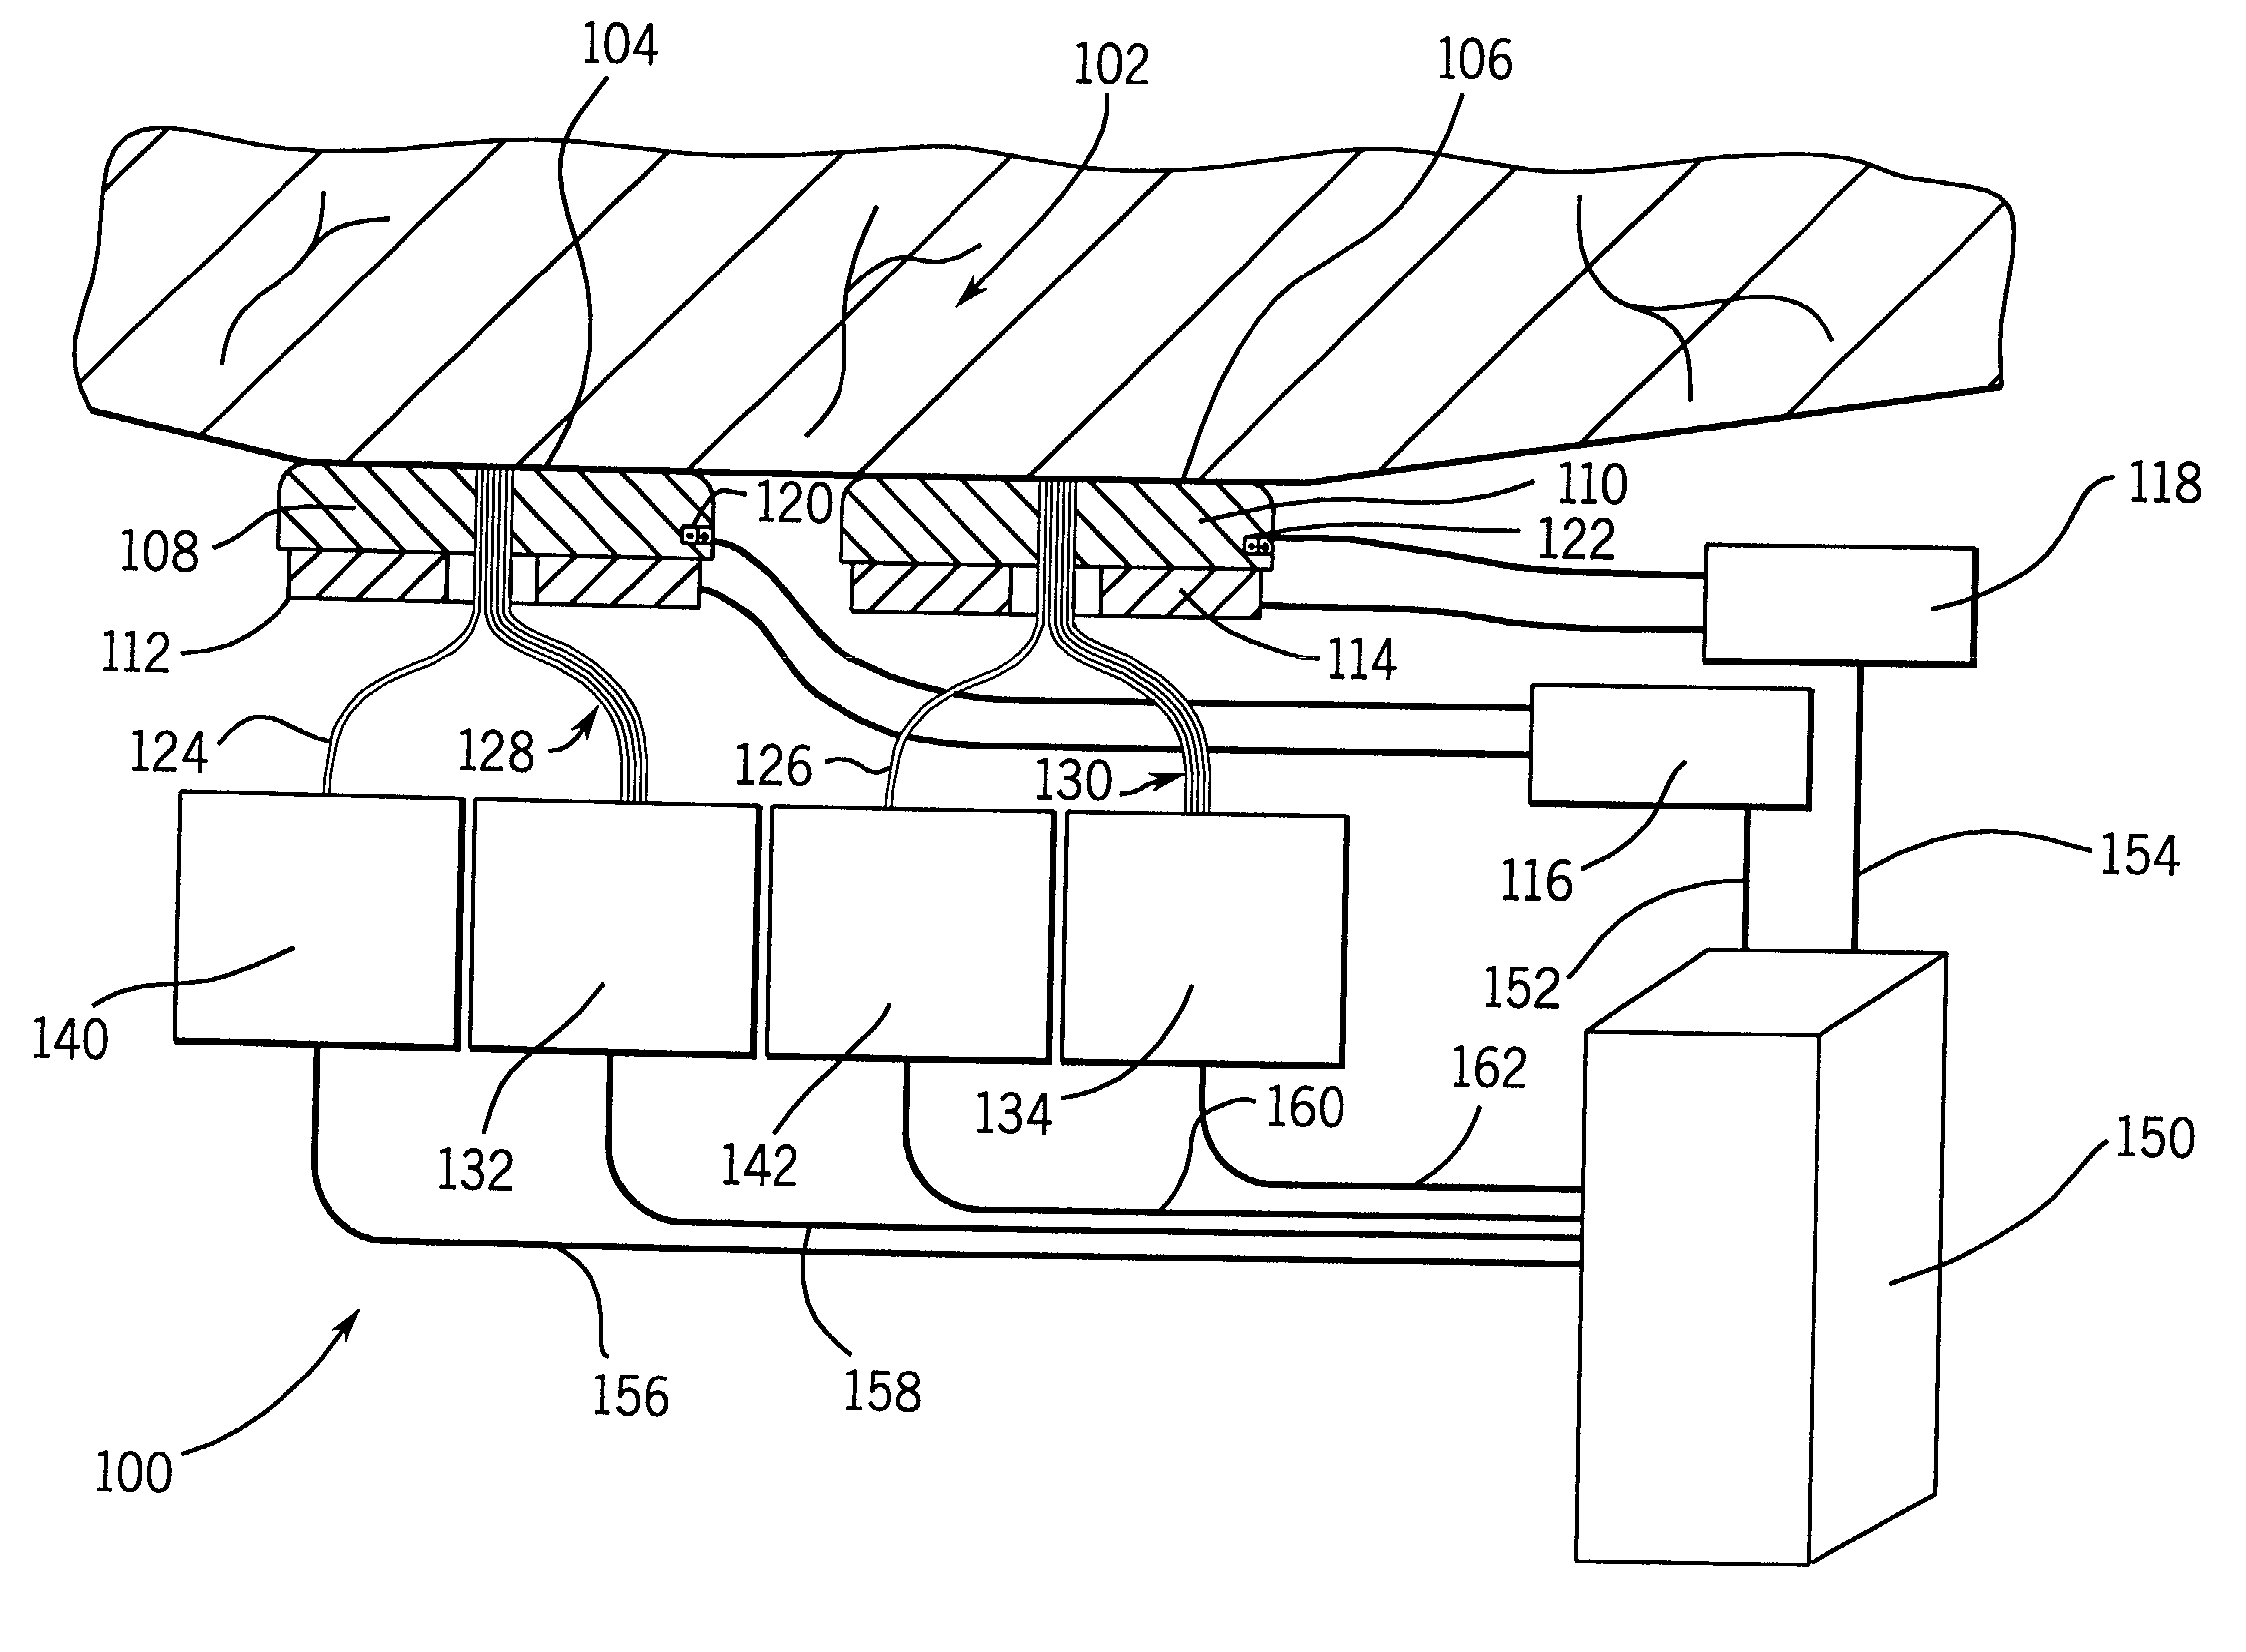
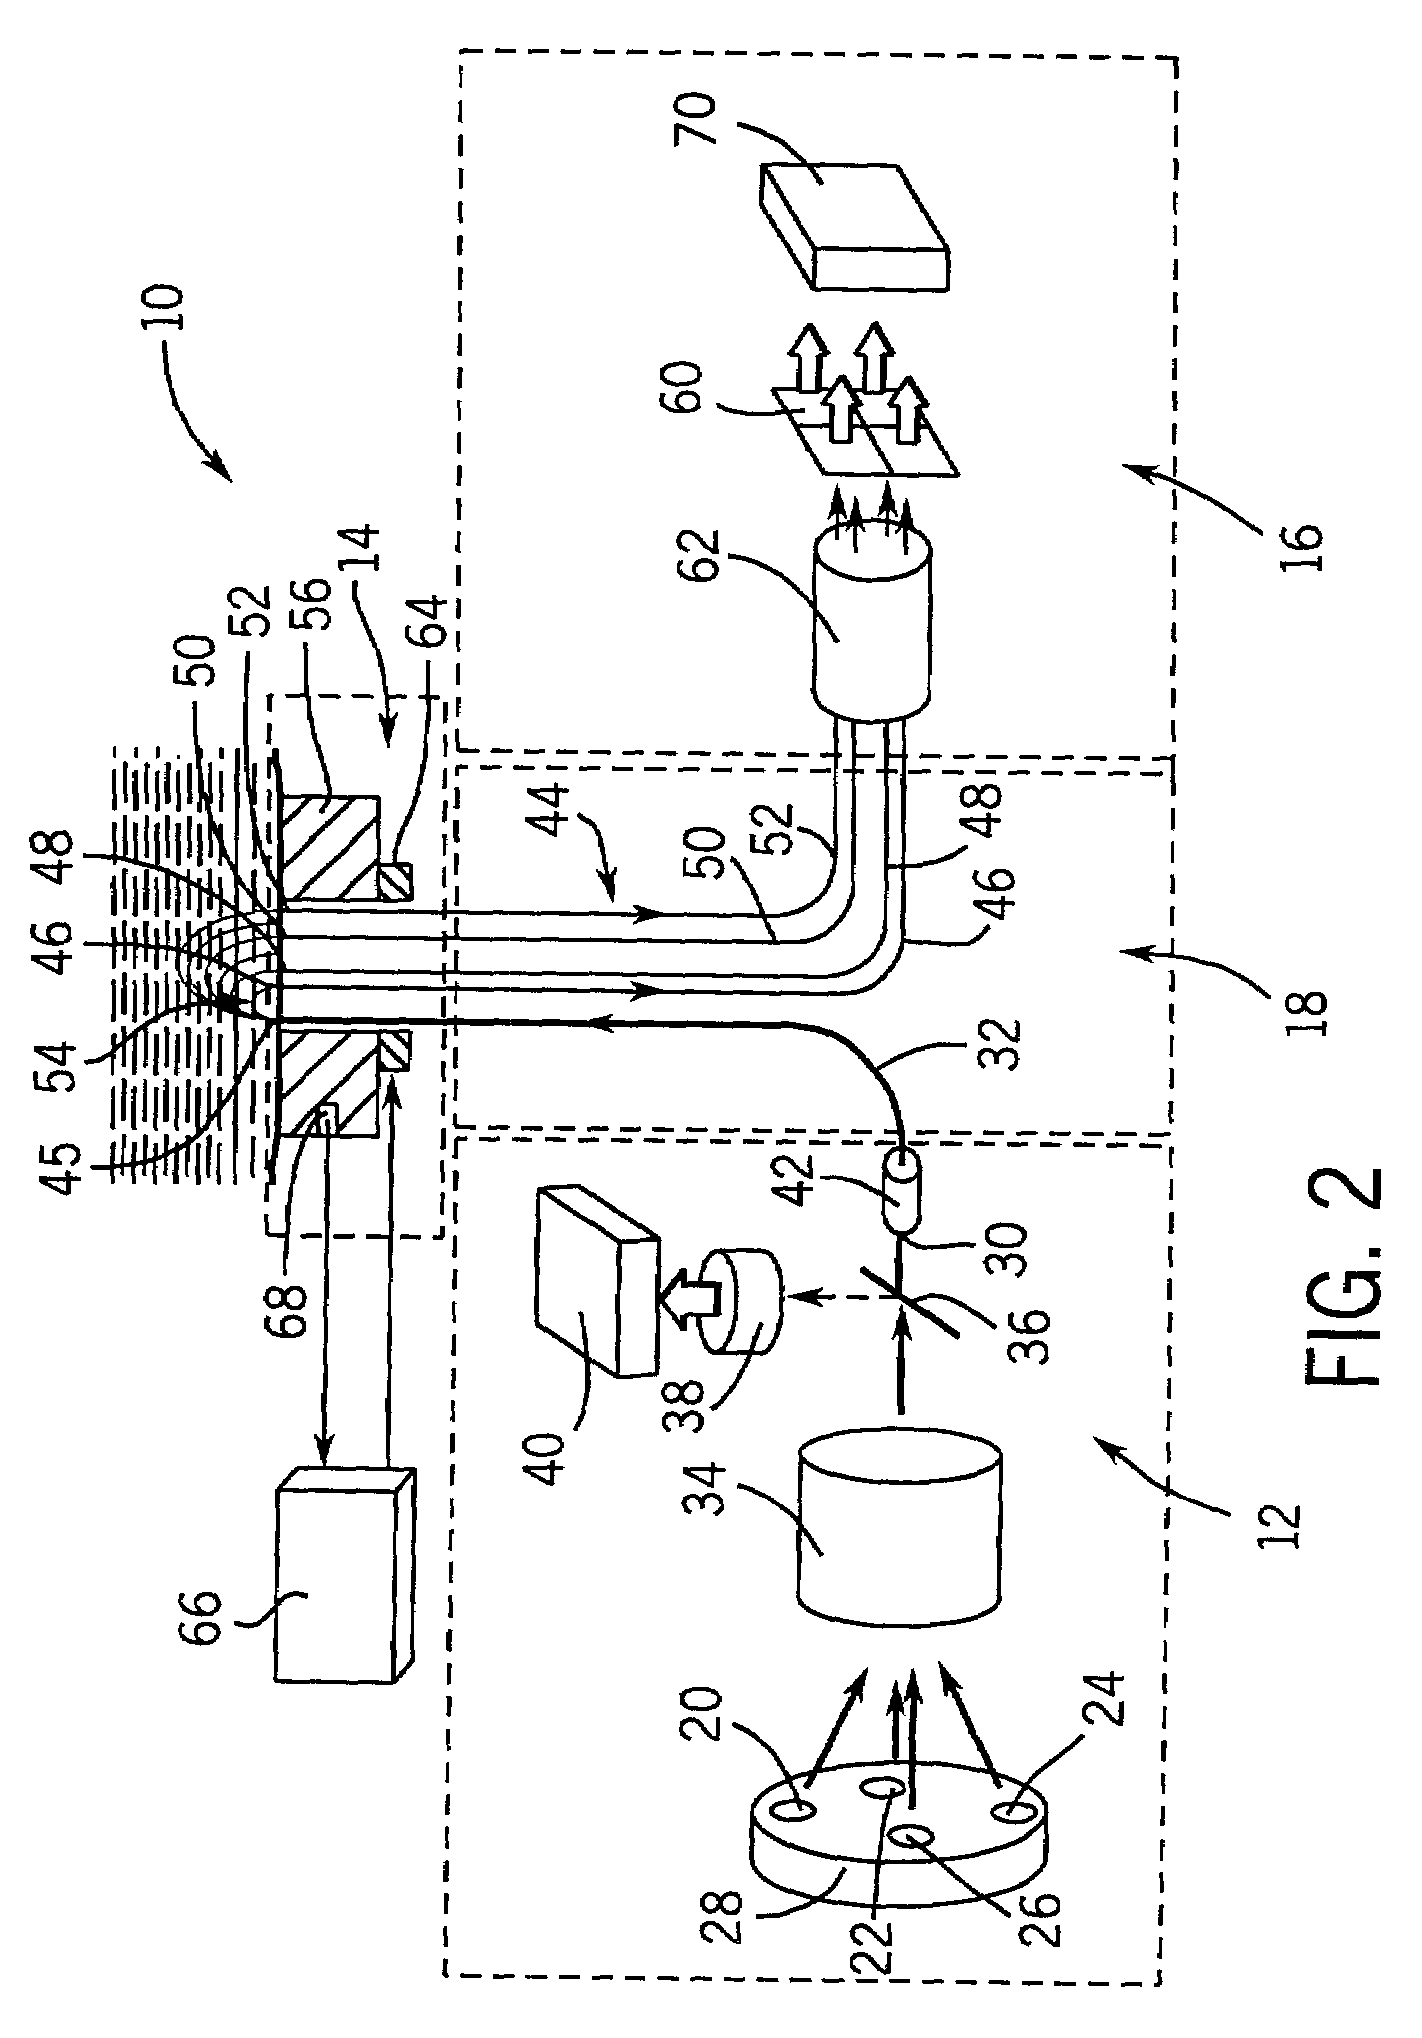
[0108]A device of the type shown in FIG. 2 was constructed. The device was capable of performing optical measurements at a single area on the surface of the skin at a given time. Thus, the device was required to be applied twice to the surface of the skin at two morphologically similar, adjacent, substantially non-overlapping areas on the skin.

[0109]The wavelengths of the LED's and the frequency at which each one was modulated are shown in Table 2.

[0110]

TABLE 2ModulationHalf band widthLED NumberWavelength (nm)frequency (Hz)(nm)16601024 15259081915393558525489045525

[0111]The distance from the center of each light collecting element 46, 48, 50, and 52 to the center of the illuminating element 32 defined the sampling distances r1, r3, r4, and r6 of this device, which are set forth in Table 3.

[0112]

TABLE 3Elementr1r3r4r6Sampling distance (mm)0.440.921.211.84

example 2

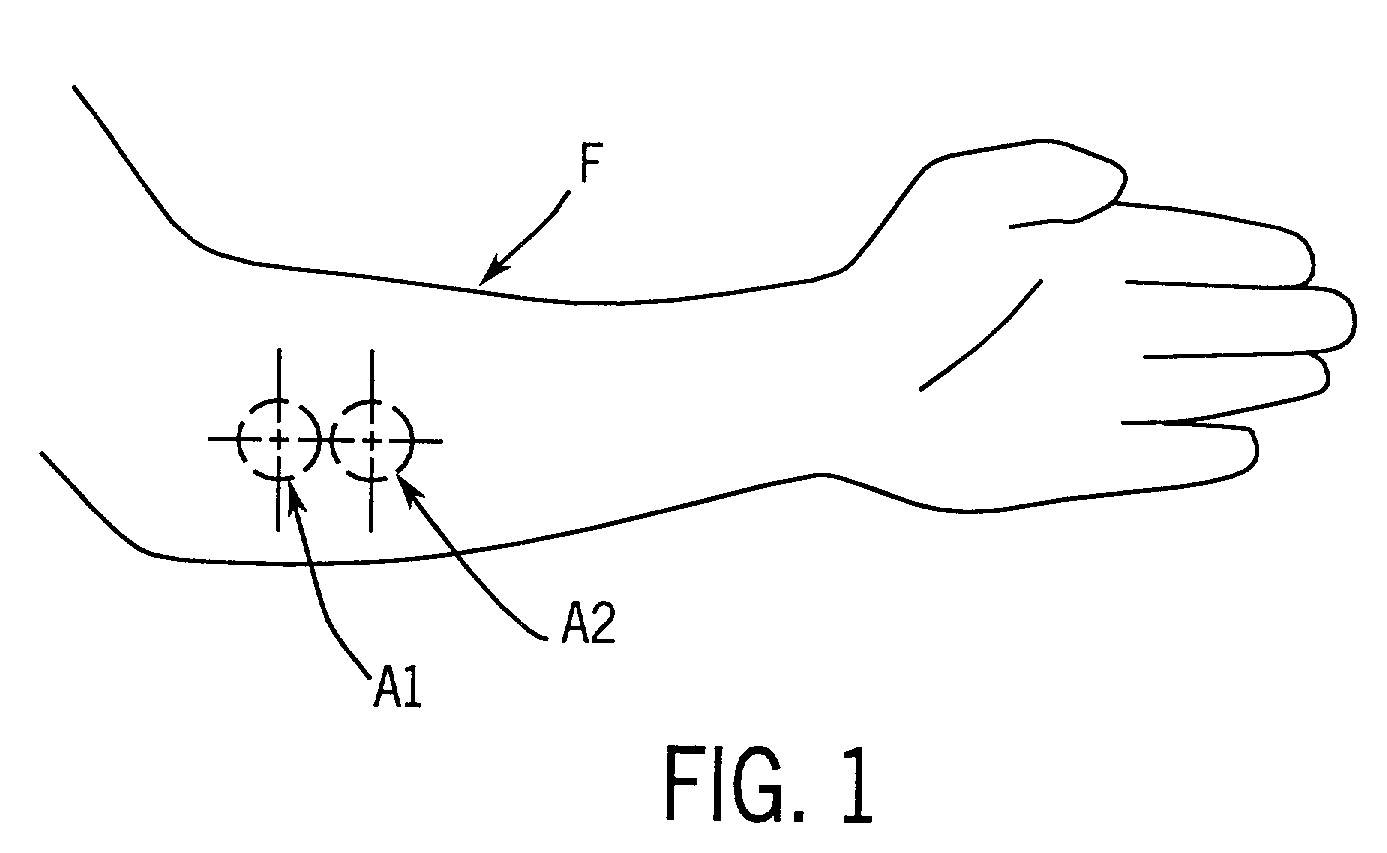
[0113]The device described in Example 1 was used in this example. Programmed temperature changes and the optical measurements were carried out at each of the two areas on the surface of the forearm as illustrated in FIG. 1. The body interface module 14 of the device 10 was mounted on a cradle (not shown) that was, in turn, mounted on the left arm of a standard clinical reclining chair (not shown). The subject sat in the chair so that the forearm of the subject rested on the cradle. The head of the optical device, which is located in the body interface module 14, was pressed against the dorsal side of the subject's forearm and the data were collected from the time the head of the optical device contacted the skin. Data were collected at the two area sequentially while each area was subjected to a different temperature program. Data from the two areas were used to create a calibration relationship. At one area of the skin, the temperature was maintained at 34° C. for 30 seconds. The t...

example 3

[0119]The procedure described in Example 2 was repeated in this example. In this example, one area on the surface of the forearm was maintained at a temperature of 38° C. for 30 seconds. The temperature of this area was then lowered to a temperature of 22° C. at the rate of 5.33° C. per minute. Optical readings were collected every five seconds for four minutes. A second area on the surface of the forearm was maintained at a temperature of 22° C. for 30 seconds. The temperature of this area was then raised to 38° C. at the rate of 5.33° C. per minute. Optical readings were collected every five seconds for four minutes.

[0120]The optical data was divided into two classes—the class of diabetics and the class of non-diabetics. A 2×2 table that related the subject's disease status to the optical signal was constructed. The subject's disease status was determined by a reference method wherein the subject had previously been diagnosed as either diabetic or non-diabetic. Four diabetics and ...


PUM

PropertyMeasurementUnit
wavelengthaaaaaaaaaa
temperaturesaaaaaaaaaa
wavelengthaaaaaaaaaa

Abstract

A method for collecting optical data at two morphologically similar, substantially non-overlapping, and preferably adjacent, areas on the surface of a tissue, while the temperature in each area is being maintained or modulated according to a temperature program. The optical data obtained are inserted into a mathematical relationship, e.g., an algorithm, that can be used to predict a disease state (such as the diabetes mellitus disease state) or the concentration of an analyte for indicating a physical condition (such as blood glucose level). This invention can be used to differentiate between disease status, such as, for example, diabetic and non-diabetic. The method involves the generation of a calibration (or training) set that utilizes the relationship between optical signals emanating from the skin under different thermal stimuli and disease status, e.g., diabetic status, established clinically. This calibration set can be used to predict the disease state of other subjects. Structural changes, as well as circulatory changes, due to a disease state are determined at two morphologically similar, but substantially non-overlapping areas on the surface of human tissue, e.g., the skin of a forearm, with each area being subjected to different temperature modulation programs. In addition to determination of a disease state, this invention can also be used to determine the concentration of an analyte in the tissues. This invention also provides an apparatus for the determination of a disease state, such as diabetes, or concentration of an analyte, such as blood glucose level, by the method of this invention.

Description

BACKGROUND OF THE INVENTION[0001]1. Field of the Invention[0002]This invention relates to an apparatus and method for the non-invasive diagnosis of a disease state or the non-invasive determination of concentrations of analytes in vivo.[0003]2. Discussion of the Art[0004]Diabetes mellitus is a chronic systemic disease in which the body either fails to produce or fails to respond to the hormone insulin, which regulates the metabolism of glucose. It is estimated that there are 16 million diabetics in the United States and 100 million diabetics worldwide. The growth rate in the number of diabetics is estimated at 11.5% annually. The number of diabetics is estimated to be as high as 154 million worldwide by the year 2000 (H. King, R. E. Aubert, and W. H. Herman, “Global burden of diabetes, 1995–2025 prevalence, numerical estimates and projections” Diabetes Care 1998;21:1414), and to exceed 200 million worldwide by the year 2010. A large number of diabetics remain undiagnosed. A method f...

Claims


Application Information

Patent Timeline
Patent Type & Authority Patents(United States)
IPC IPC(8): A61B5/00G01N21/35A61B5/145A61B5/1455
CPCA61B5/14532A61B5/1495A61B5/1455A61B5/7264
Inventor KHALIL, OMAR S.YEH, SHU-JENKANTOR, STANISLAWHANNA, CHARLES F.SHAIN, ERIC B.
Owner ABBOTT DIABETES CARE INC
Why Eureka
Try Eureka