Imaging of light scattering tissues with fluorescent contrast agents
a tissue and contrast agent technology, applied in the field of spectroscopic imaging of heterogeneous light scattering tissue, can solve the problems of limiting the availability of mri diagnostics, unable to provide a viable spatial imaging procedure, and unable to obtain meaningful relational measurements of fluorescence characteristics from random procedures, etc., to achieve the effect of improving imaging
- Summary
- Abstract
- Description
- Claims
- Application Information
AI Technical Summary
Benefits of technology
Problems solved by technology
Method used
Image
Examples
example 1
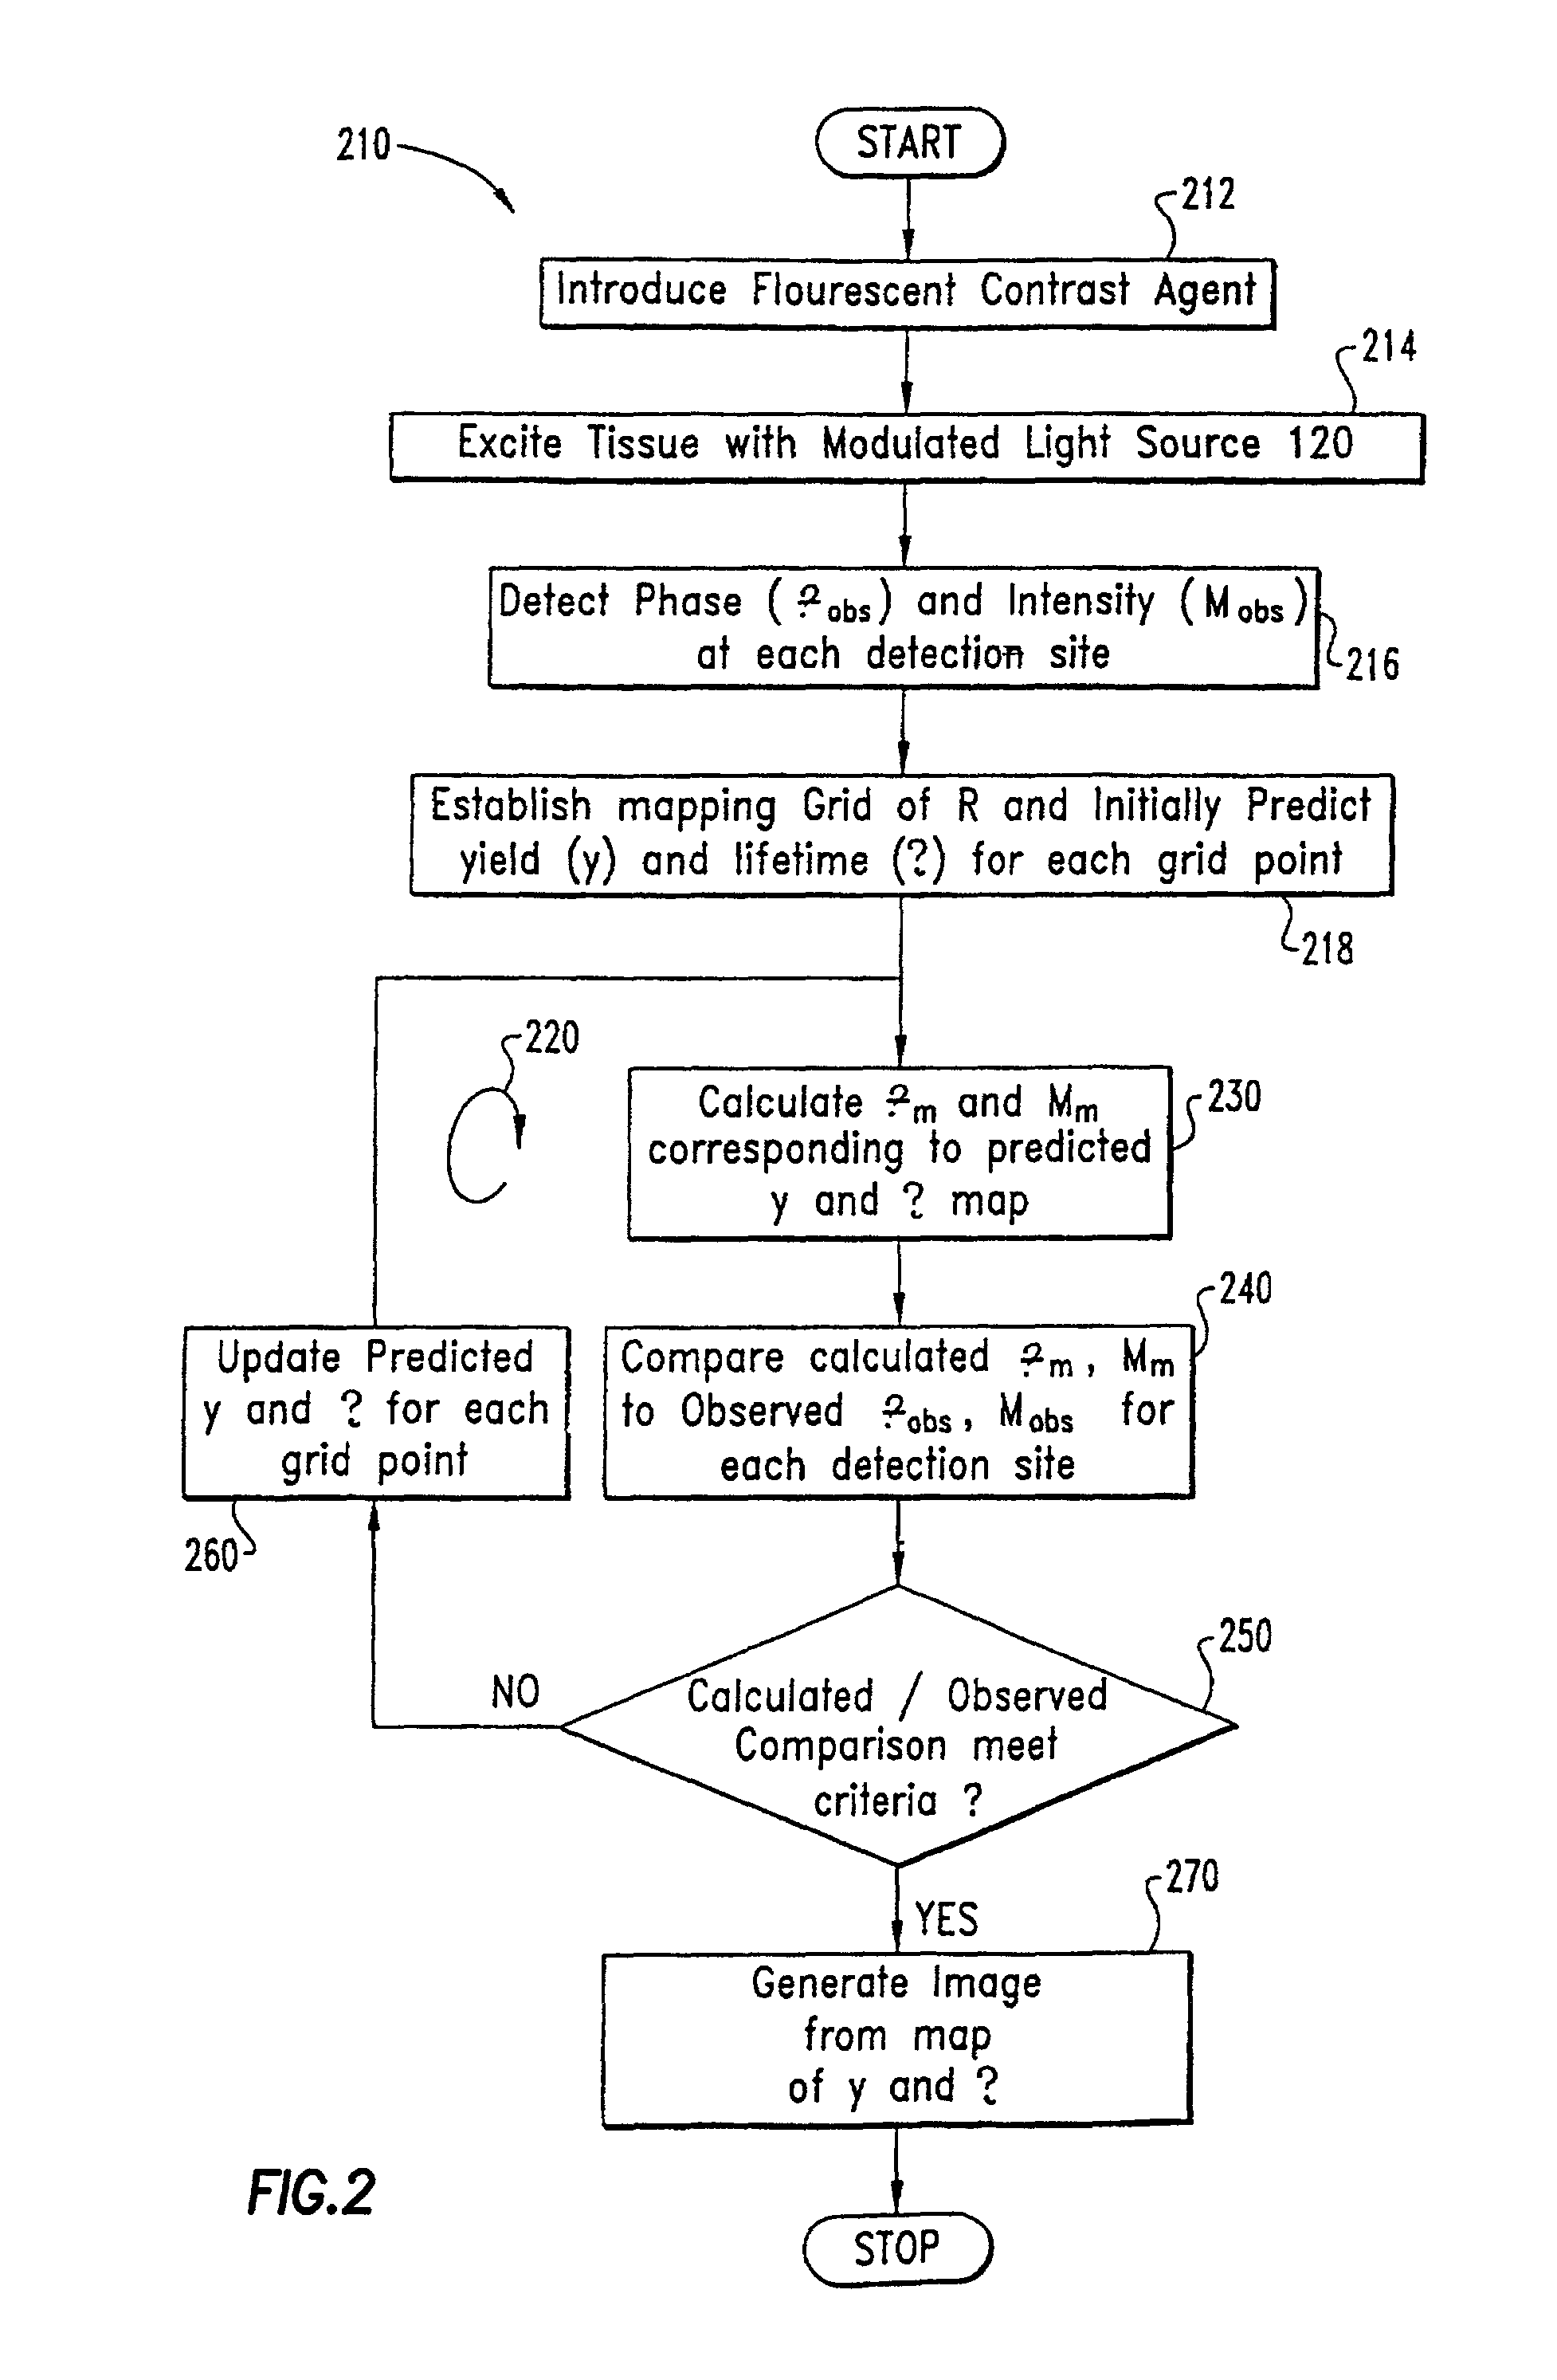
[0089]Example 1 reconstructs fluorescent yield and lifetime with no absorption due to non-fluorescing chromophores. To simulate the experimental data for this example, the fluorescent yield, (ημax→m)j, for the background and the heterogeneity 302 were chosen as 1×10⁻⁵ mm−1 and 1×10⁻³ mm−1 respectively and the fluorescence lifetime, (τ)j, for the background and the heterogeneity 302 chosen as 10 ns and 1 ns respectively. During the execution of loop 220, no a priori knowledge of either the heterogeneity 302 location or the background-fluorescence properties was assumed and a uniform guess of 1×10⁻⁵ mm−1 and 10 ns was given for the fluorescence yield, (ημax→m)j, and lifetime, (τ)j, respectively. Convergence was achieved in less than 50 iterations of Loop 220 (computational time on a SunSparc10: 2 hours) for a two dimensional 17×17 grid. The average values of ημax→m and τ in the grid points which occupy the simulated object converge within 50 iterations to ημax→m=0.93×10⁻³ mm−1 and τ=1...
example 2
[0092]Example 2 reconstructs fluorescent yield and lifetime with a simulated chromophore absorption configured to mimic tissue. The same hidden heterogeneity as well as optical parameters and simulation equipment were used as described in Example 1 except that a uniform background chromophore absorption coefficient, μax→ of 1×10⁻³ mm−1 was used to generate the simulated experimental data. While excitation light propagation was not employed for image reconstruction, we considered this optical property known to estimate the best possible performance for inverse image reconstruction under physiological conditions. The two-dimensional reconstructed spatial map of the fluorescence yield, (ημax→m)j[mm−1], and lifetime, (τ)j[ns], are shown in FIGS. 12 and 13, respectively. As shown in Table 3, the mean value of location of the object according to our criterion based on ημax→m occurred as position (59.4, 58.3) consistent with the conditions used to simulate the experimental data. The dimens...
example 3
[0093]Example 3 simulated two hidden heterogeneities in the tissue phantom (not shown in FIG. 3). In this case, the same optical parameters were used as described in example 1 except that the fluorescence yield ημax→m for the objects 1 and 2 was chosen as 1×10⁻³ mm−1 and 2×10⁻³ mm−1 respectively and lifetime τ for the heterogeneities chosen as 1 ns and 2 ns, respectively.
[0094]A 33×33 grid was employed instead of a 17×17 grid. An image corresponding to the mapping of yield is depicted in FIG. 14.
PUM
 Abstract
Description
Claims
Application Information
 - R&D
- Intellectual Property
- Life Sciences
- Materials
- Tech Scout
- Unparalleled Data Quality
- Higher Quality Content
- 60% Fewer Hallucinations
Browse by: Latest US Patents, China's latest patents, Technical Efficacy Thesaurus, Application Domain, Technology Topic, Popular Technical Reports.
© 2025 PatSnap. All rights reserved.Legal|Privacy policy|Modern Slavery Act Transparency Statement|Sitemap|About US| Contact US: help@patsnap.com


