Method of sample control and calibration adjustment for use with a noninvasive analyzer

a non-invasive, calibration adjustment technology, applied in the field of methods, can solve the problems of increasing the difficulty of monitoring, reducing the accuracy of sample probe placement, and reducing the ability to maintain calibration performan

Inactive Publication Date: 2008-06-03
GLT ACQUISITION
View PDF70 Cites 79 Cited by
  • Summary
  • Abstract
  • Description
  • Claims
  • Application Information

AI Technical Summary

Benefits of technology

[0065]A method and apparatus for easing the use of an optically based noninvasive analyzer is presented. More particularly, a simplified algorithm is used that removes the daily requirement of collecting and using a noninvasive spectrum to update a calibration model. In another embodiment, a guide is used to substantially reduce variation in sample probe placement in relation to a skin tissue sampling site, resulting in the ability to maintain calibration performance with the use of a reference analyte concentration, with or without the use of a reference spectrum collected nearby in time.

Problems solved by technology

Diabetes is a chronic disease that results in improper production and utilization of insulin, a hormone that facilitates glucose uptake into cells.
Diabetes is a leading cause of death and disability worldwide.
However, current monitoring techniques discourage regular use due to the inconvenient and painful nature of drawing blood through the skin prior to analysis.
Often this set of conditions changes to the extent that the original model no longer functions adequately.
In addition to instrumentation and environmental impacts, changes in the sample affect the model.
In noninvasive determination of glucose concentration in the body, another key issue with sampling is that the sample is alive and dynamic in nature.
However, variations in the physiological state and fluid distribution of tissue profoundly affect the optical properties of tissue layers and compartments over a relatively short period of time.
This approach avoids modeling the differences between patients and therefore cannot be generalized to more individuals.
This approach also fails to address the prevalent short-term problem related to physiologically induced variation and no means of compensating for variation related to the dynamic water shifts of fluid compartments is reported.
To date, this extensive calibration and testing protocol has met with limited success.
This general class of techniques is found to be limiting in terms of noninvasive glucose concentration analyzer requirements.
This technique does not reduce the spectroscopic variation of the calibration set.
However, this method does not address the key problem of short term physiological and chemical changes related to the dynamic nature of the tissue nor the intra-patient variation related to the heterogeneity of the tissue sample.
Collection of the reference spectrum is time consuming, requires some expertise on the part of the user, requires data collection software, and requires a microprocessor or other computing means to implement into the calibration.
In addition, the acquired sample spectrum to be used as a reference spectrum contains data collection errors and has spectroscopic attributes not accounted for in the original model.
Incorporation of the reference spectrum of the individual into the model thereby results in a significant potential source of error in the resulting calibration that directly translates into errors in subsequent glucose concentration predictions.
In a noninvasive glucose determination, this results in an erroneous glucose concentration being reported that is used as an adjunct method for directing insulin therapy.
Further, no suggestion is made for easing the use of a bioanalyzer such as a near-IR based noninvasive glucose analyzer through the use of a guide to reduce the need for mean centering related techniques based upon spectral references.
Finally, to date no FDA device has been approved for the utilization by an individual or a medical professional for noninvasive glucose concentration determination.
Further, factor analysis based multivariate models result in abstract features.
Calibration maintenance is a costly and time-consuming process that requires some technical skill.

Method used


Image

  • Method of sample control and calibration adjustment for use with a noninvasive analyzer
  • Method of sample control and calibration adjustment for use with a noninvasive analyzer
  • Method of sample control and calibration adjustment for use with a noninvasive analyzer

Examples


example

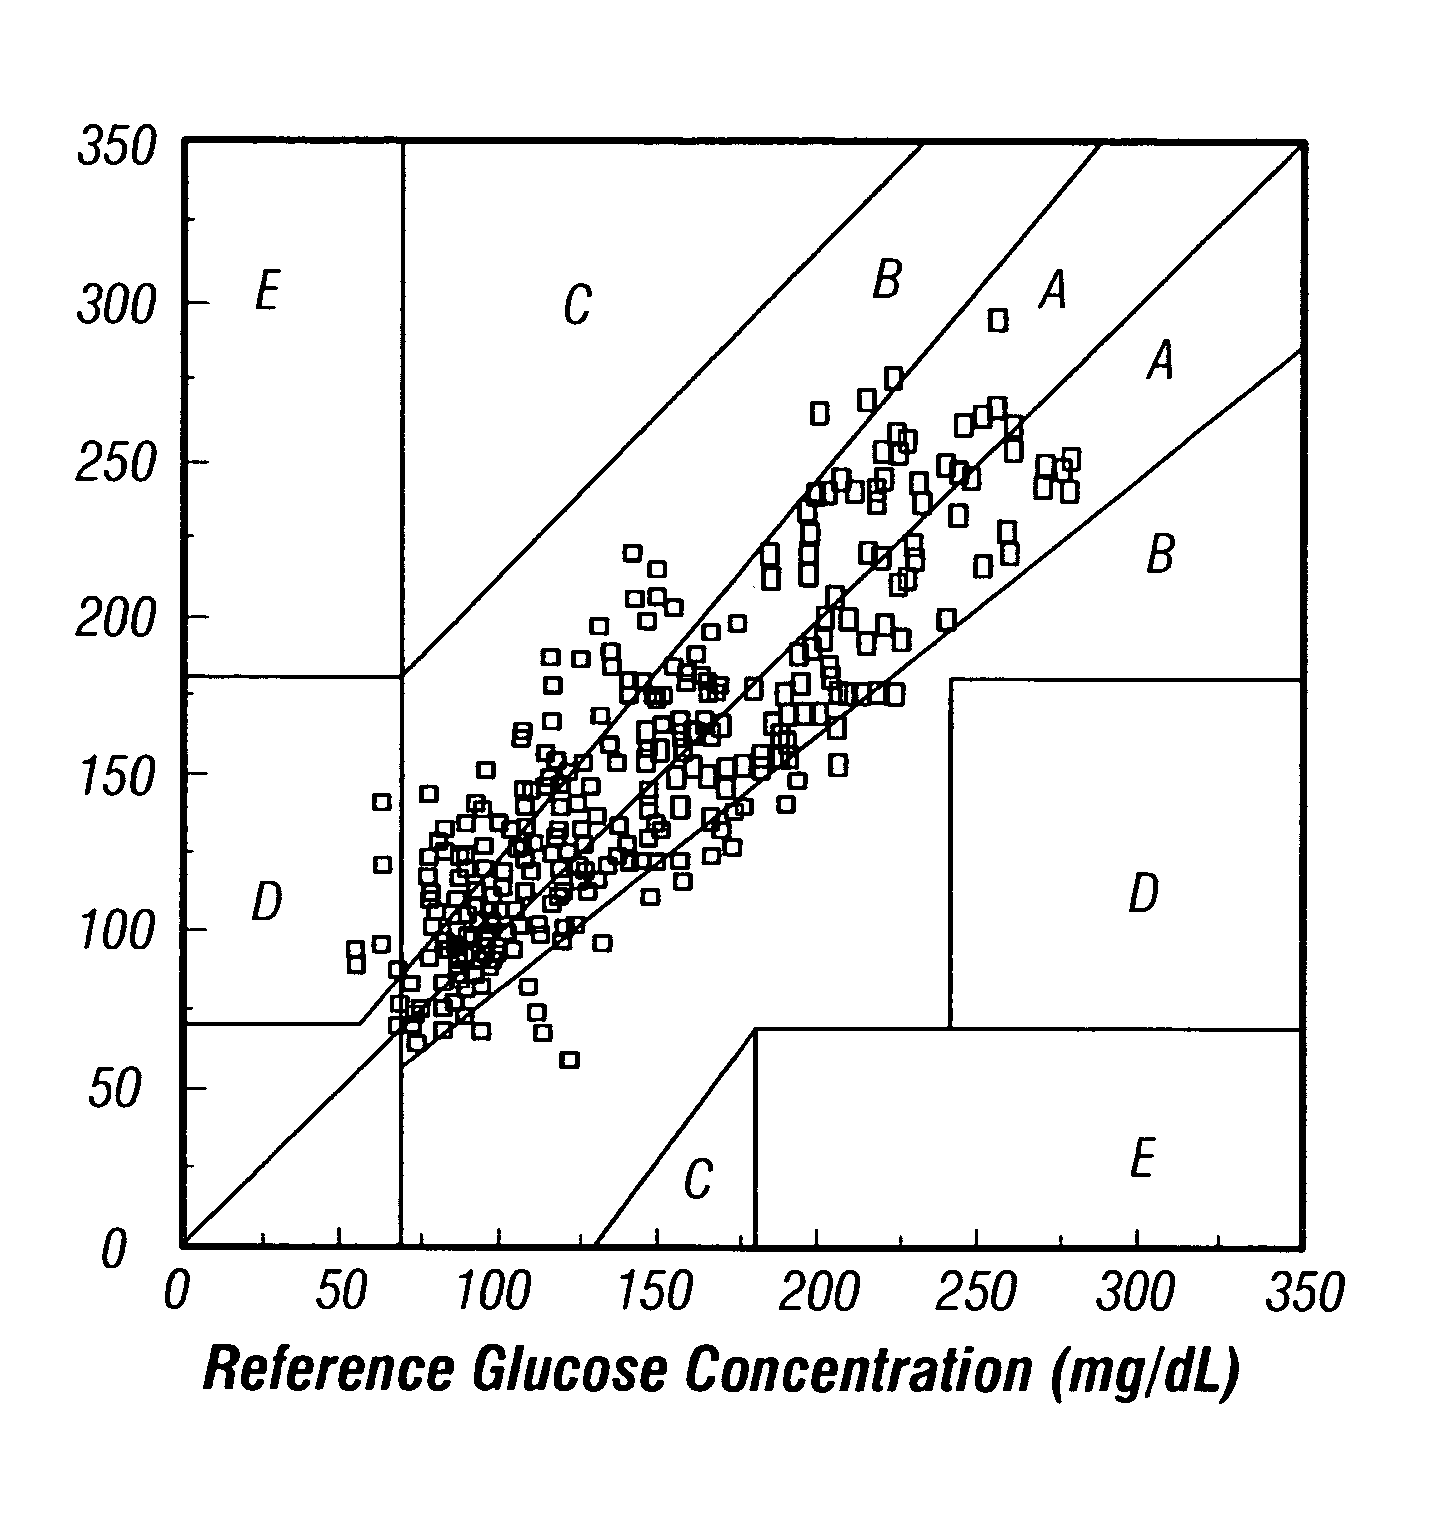
[0104]An example data set of noninvasive glucose concentration prediction is presented in FIG. 6. These representative data are processed using the preferred model correction technique described above that uses only a direct glucose reference concentration and does not use a noninvasive (or related) reference spectrum. The instrumentation used to collect the calibration data includes three identically configured near-IR based analyzers configured with a tungsten halogen source, excitation guiding optics, a bandpass filter, collection guiding optics, a slit, a grating, an array detector, and associated electronics. A guide is placed onto each subject at the beginning of a given day for all measurements taken in the calibration and subsequent prediction measurements. All subjects underwent one or more glucose profiles over a period of at least one day. The calibration is built with a total of eight subjects, using the calibration instruments to collect 241 samples over a period of two...


PUM


Abstract

A method and apparatus for easing the use of an optically based noninvasive analyzer is presented. More particularly, a simplified algorithm is used that removes the daily requirement of collecting and using a noninvasive spectrum to update a calibration model. In another embodiment, a guide is used to substantially reduce variation in sample probe placement in relation to a skin tissue sampling site, resulting in the ability to maintain calibration performance with the use of a reference analyte concentration, with or without the use of a reference spectrum collected nearby in time.

Description

CROSS REFERENCE TO RELATED APPLICATIONS[0001]This application is:[0002]a continuation-in-part of U.S. patent application Ser. No. 10 / 170,921, filed on Jun. 12, 2002 now U.S. Pat. No. 7,206,623, which is a continuation-in-part of U.S. patent application Ser. No. 09 / 563,782, filed on May 2, 2000, now U.S. Pat. No. 6,415,167;[0003]a continuation-in-part of U.S. patent application Ser. No. 10 / 384,023, filed on Mar. 7, 2003 now U.S. Pat. No. 7,010,336, which is a continuation-in-part of U.S. patent application Ser. No. 09 / 630,201, filed on Aug. 1, 2000 now U.S. Pat. No. 6,871,169, which is a continuation-in-part of U.S. patent application Ser. No. 09 / 610,789, filed on Jul. 6, 2000 now abandoned; and[0004]claims benefit of U.S. provisional patent application Ser. No. 60 / 472,613, filed on May 21, 2003.[0005]All of the foregoing applications are incorporated herein in their entirety by this reference thereto.BACKGROUND OF THE INVENTION[0006]1. Field of the Invention[0007]The invention relat...

Claims


Application Information

Patent Timeline
Patent Type & Authority Patents(United States)
IPC IPC(8): A61B5/1455A61B5/00G02B
CPCA61B5/14532A61B5/1455A61B5/1495G01N21/274G01N21/359
Inventor RUCHTI, TIMOTHY L.HAZEN, KEVIN H.BLANK, THOMAS B.
Owner GLT ACQUISITION
Why Eureka
Try Eureka