Method for coherence-filtering of acoustic array signal

a coherence filtering and array signal technology, applied in the field of filtering signal data, can solve the problems of interference with formation signals, affecting the coherence of acoustic array signals, and often contaminated acoustic signals that travel along the formation, so as to achieve enhanced coherence, suppress non-coherent signals in data, and poor signal-to-noise ratio

Active Publication Date: 2010-02-09
BAKER HUGHES INC
View PDF6 Cites 19 Cited by
  • Summary
  • Abstract
  • Description
  • Claims
  • Application Information

AI Technical Summary

Benefits of technology

[0009]The present method disclosed herein involves a method of waveform processing technique utilizing signal coherence of the array data for processing signals having poor signal-to-noise ratio. Raw waveform data is first transformed into f-k (frequency-wavenumber) domain. A coherence function is then calculated and convolved with the data in the f-k domain, which effectively suppresses non-coherent signals in the data. For the remaining coherent data, the unwanted part is muted and the wanted part is retained and inverse-transformed to yield the coherence-filtered array waveform data. After this processing, small signals that are hidden in the original data are extracted with much enhanced coherence. Subsequent processing of the data yields reliable information about formation acoustic property.

Problems solved by technology

Often the data received and recorded by such arrays can include unwanted signals that intermingle with the desired data and distort the final recordings thereby providing skewed results.
In acoustic logging through an earth formation, acoustic signals that travel along the formation are often contaminated by other acoustic waves that travel along a different path.
For example, in the logging-while-drilling measurement, acoustic waves may travel long the tool body (drill collar) and significantly interfere with the formation signals.
In cased hole logging, acoustic waves transmission along the casing may become significant if the casing is poorly bonded with cement.
Moreover, this wave transmission may become overwhelmingly large if the casing is detached from cement (i.e., the free-pipe situation).
In the latter situation, processing acoustic signals to obtain formation properties is extremely difficult because the formation signals are almost in discernible in the presence of overwhelming casing waves.
However, the measured data are often abandoned when casing is poorly bonded or detached because of the interference caused by the waves passing through the casing.
This method often fails because the formation signals, although they theoretically exist, are small compared to the large casing ringing signals and are thus difficult to distinguish from noises in the data.
However, due to the amplitude difference between the formation and casing signals, the enhanced resolution is not of much help in resolving the low-coherence formation signal with a poor signal-to-noise ratio.
However, as stated in Varelo et al (2003), the method does not work well when the casing and formation signals overlap in time.

Method used


Image

  • Method for coherence-filtering of acoustic array signal
  • Method for coherence-filtering of acoustic array signal
  • Method for coherence-filtering of acoustic array signal

Examples


example 1

A Real Data Example to Demonstrate the Coherence-Filtering Procedure

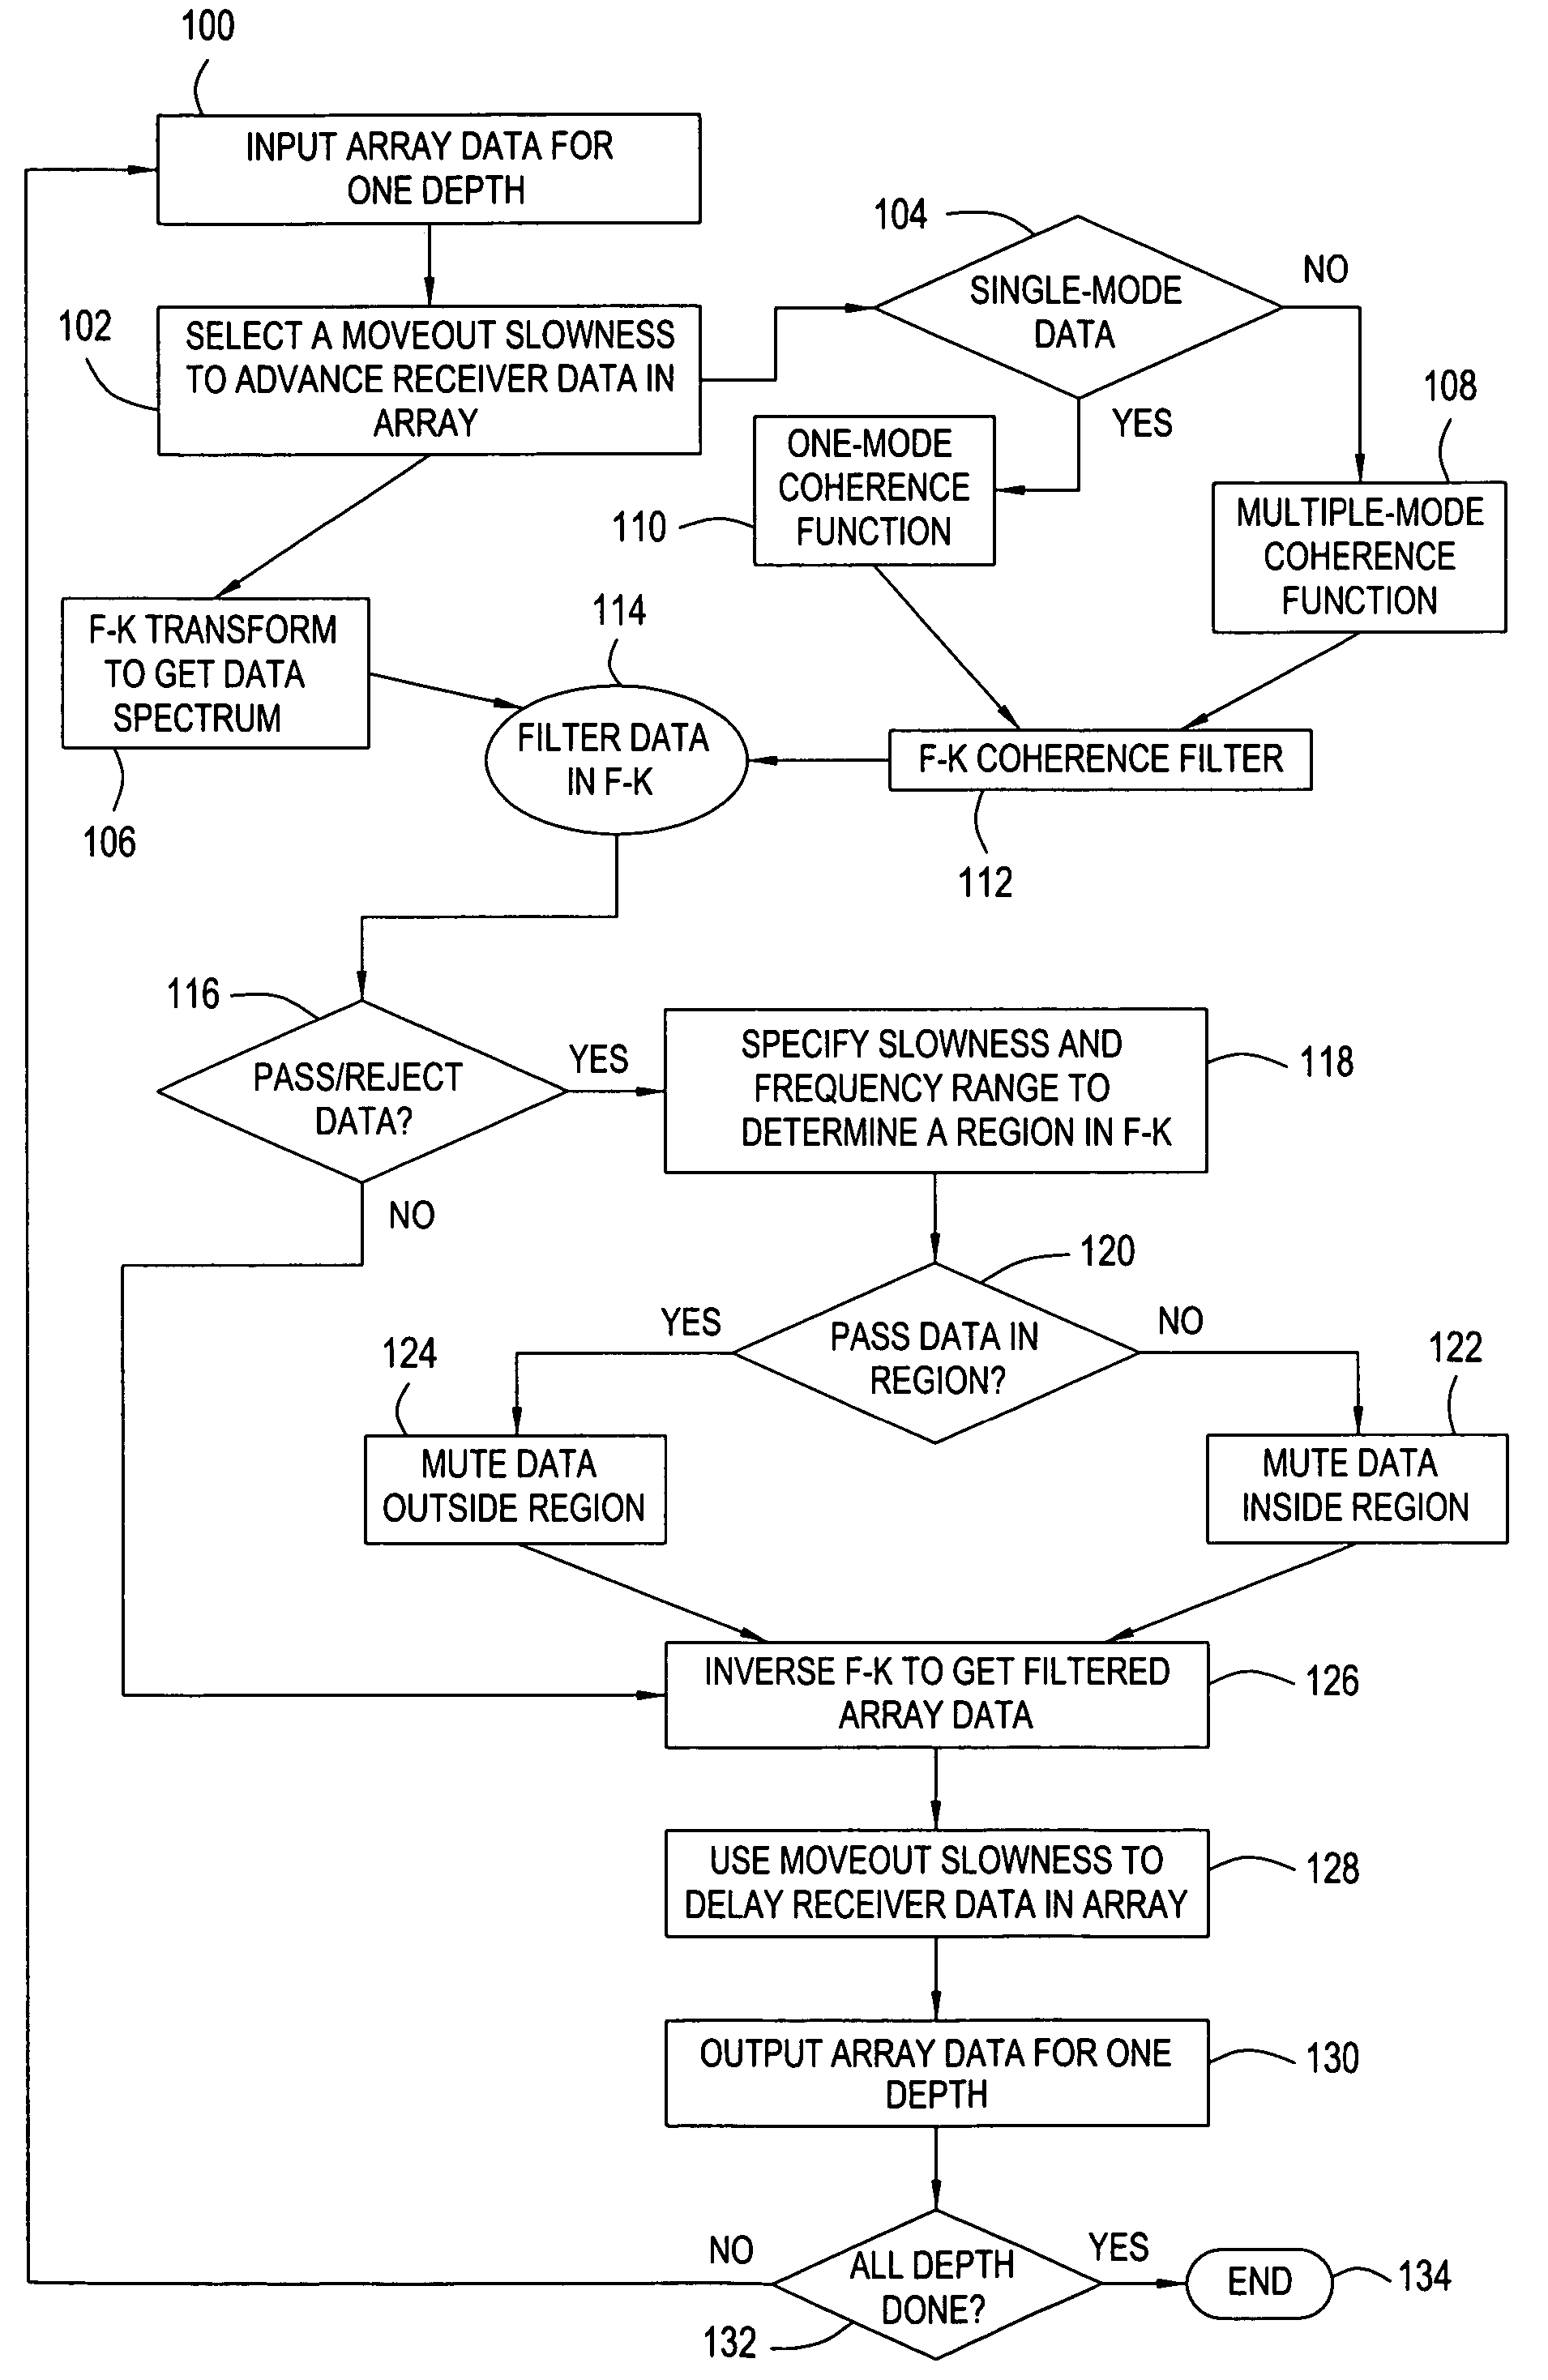
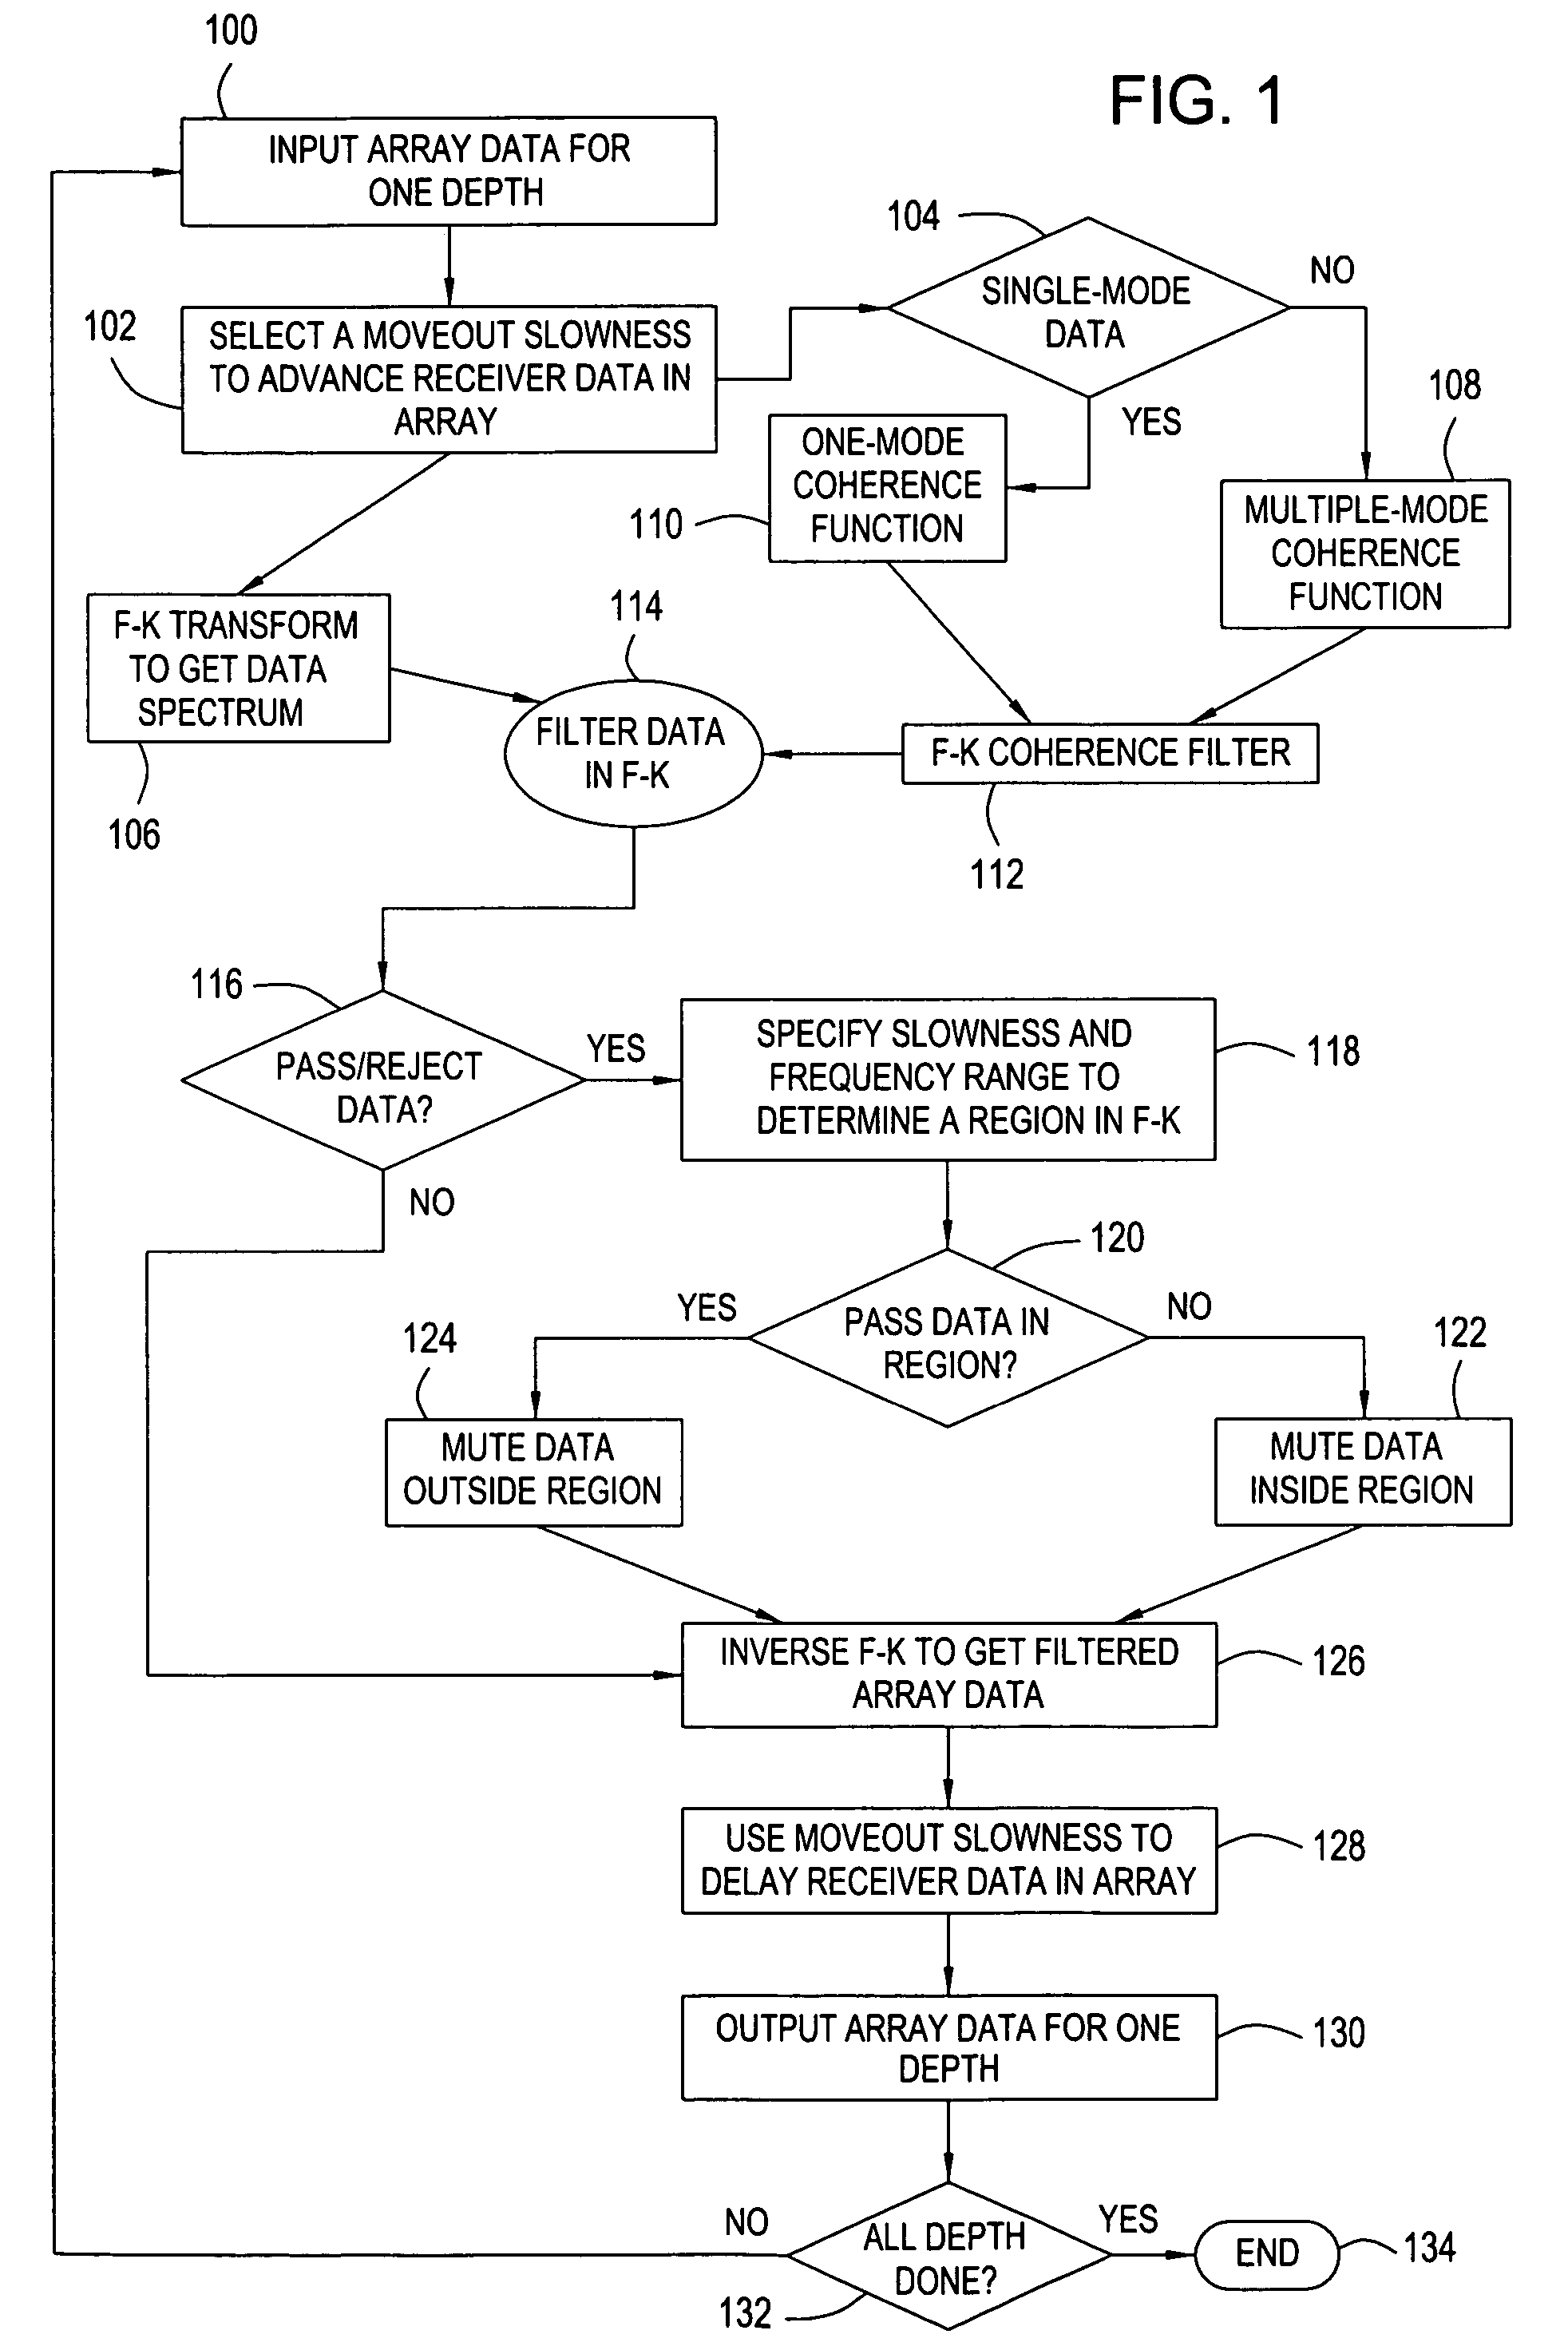
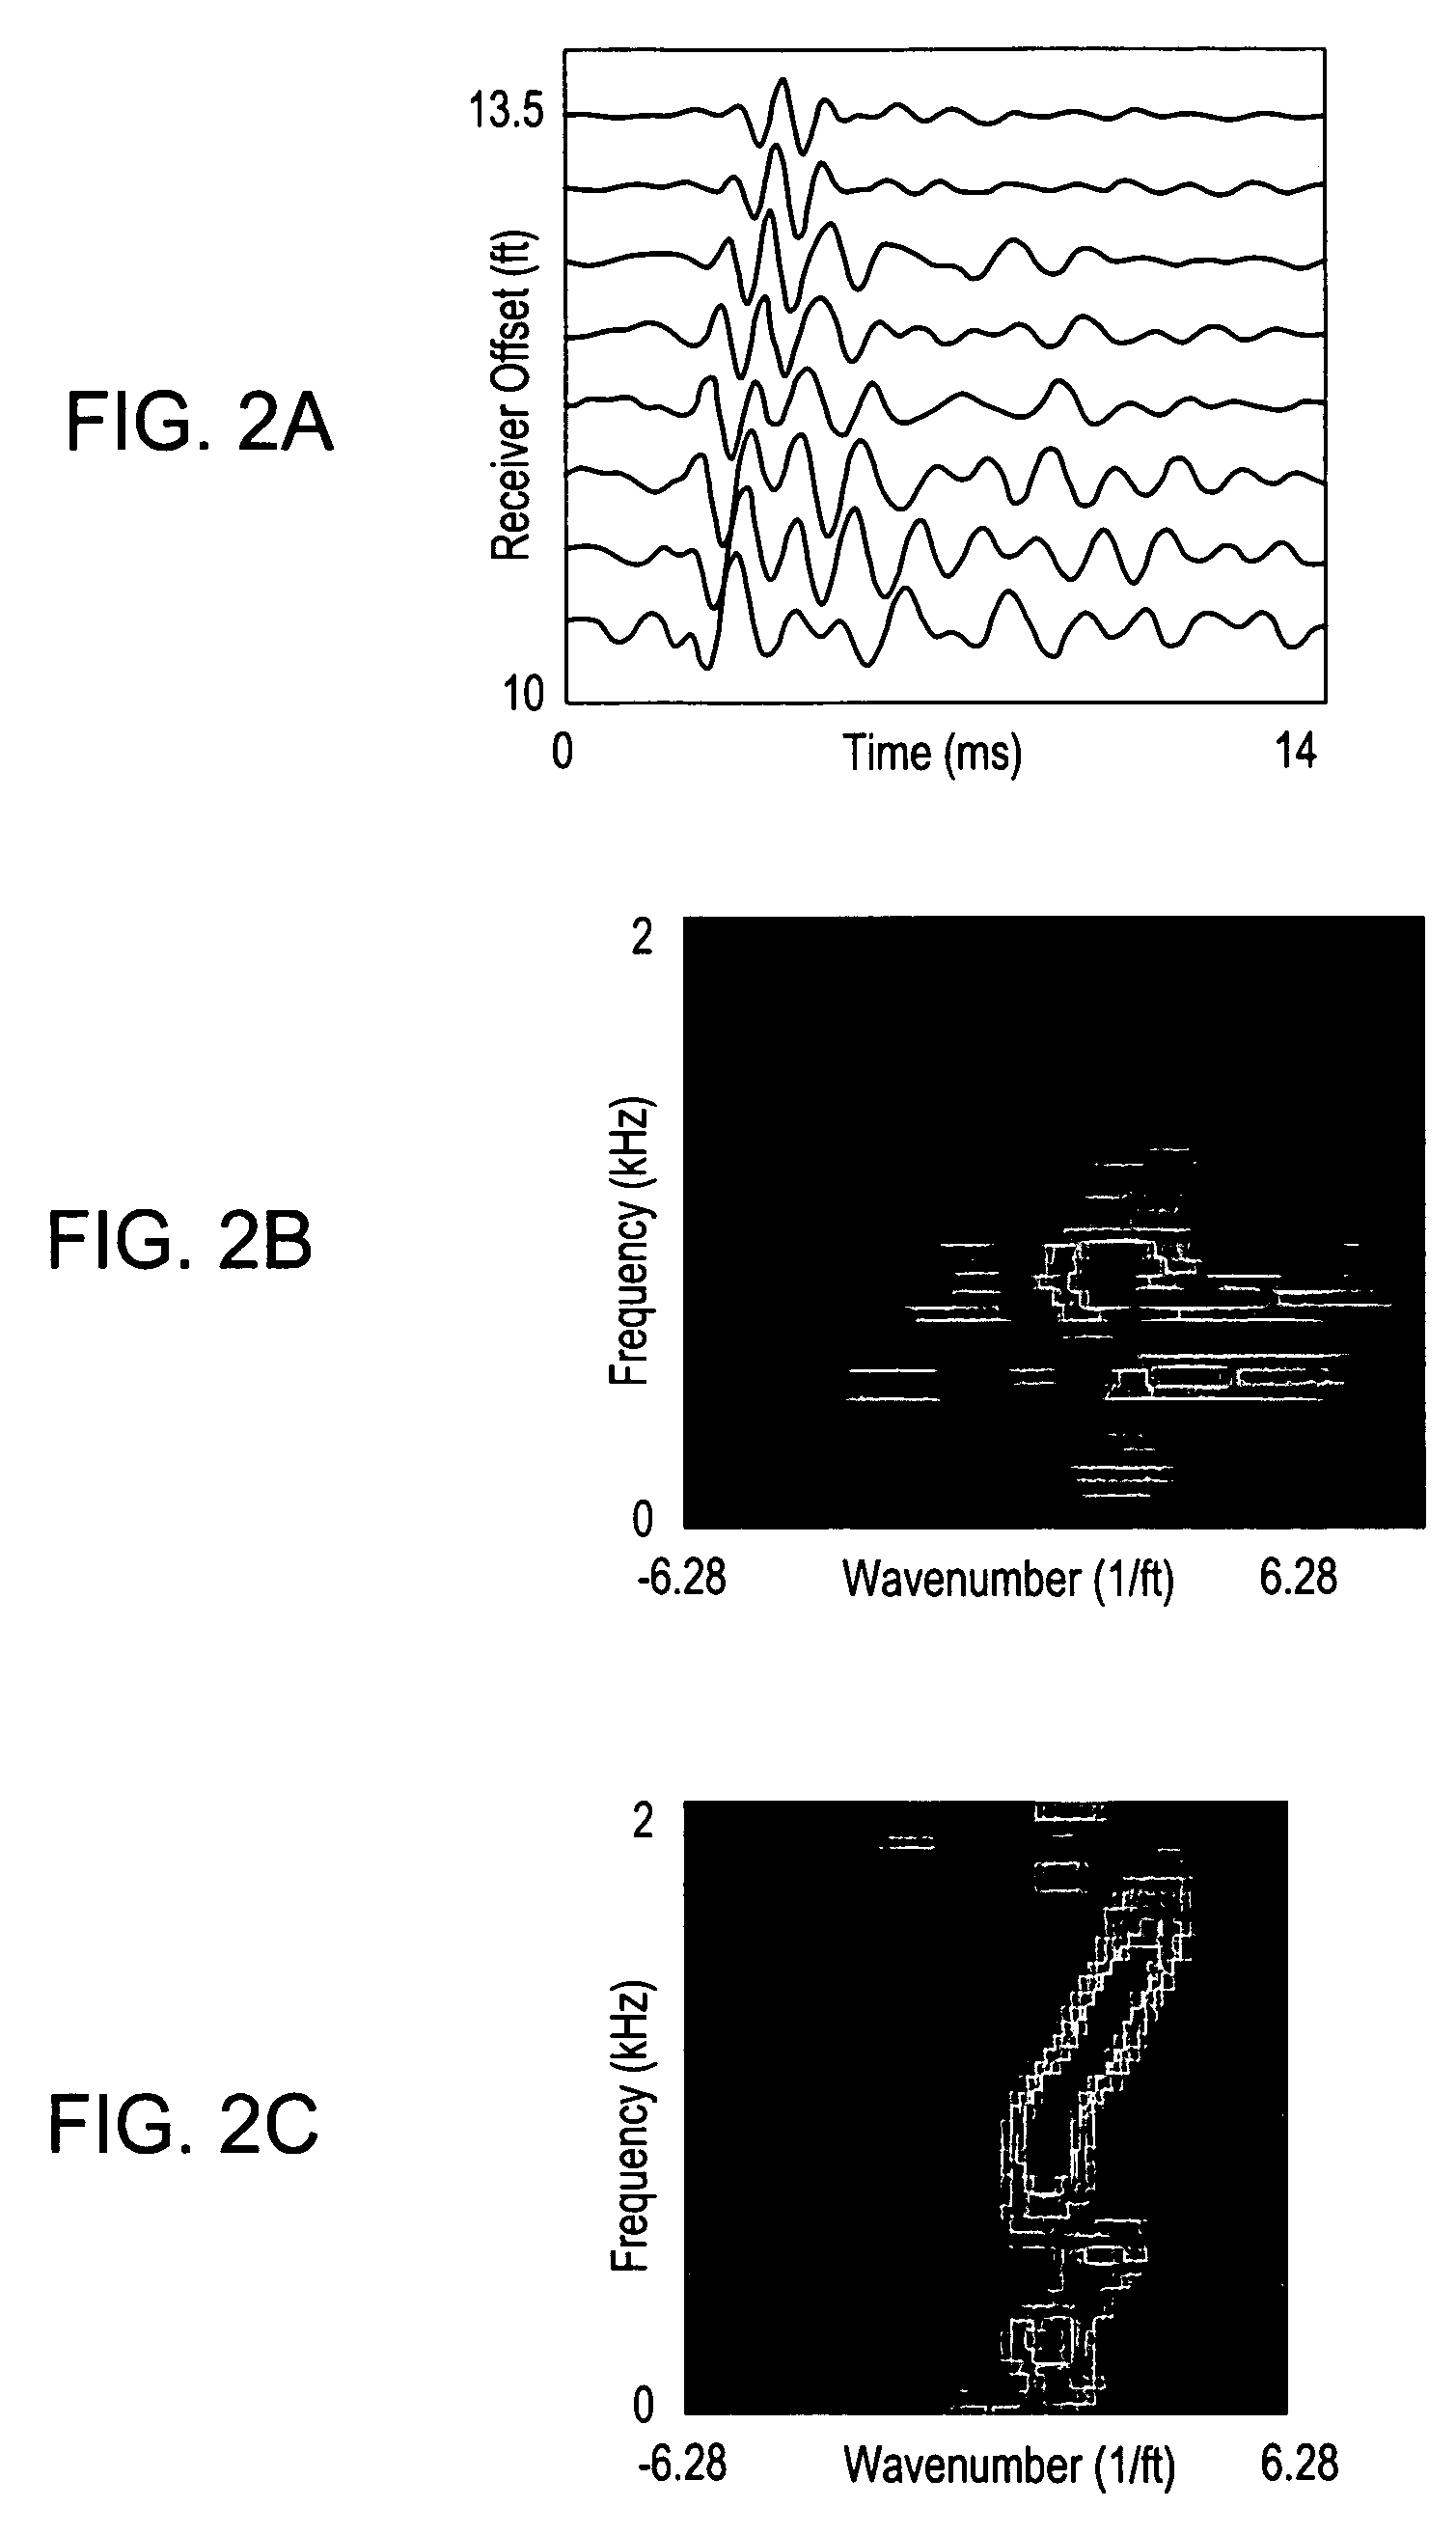
[0055]FIGS. 2a-2e demonstrate the coherence filtering procedure using a field dipole data example. Here the data were recorded by a wireline dipole acoustic logging tool. The tool consists of a dipole transmitter and an array of receivers that are located about 10 ft above the transmitter and aligned longitudinally along the tool. FIG. 2a is a graphical depiction of raw low-frequency dipole array acoustic data recorded by an array of equally spaced acoustic receivers. This data can also be referred to as received data or a received signal. The ordinate represents time and the abscissa represents the distance between the dipole source transmitter and the receivers. Significant noise contamination can be seen from the wave reverberations in the raw data of the near receivers.

[0056]The corresponding f-k spectrum is shown in FIG. 2b where several closely clustered events are exhibited. Since the aliasing effect does not...

example 2

Extracting Formation P Wave from Free Pipe (Synthetic) Acoustic Data

[0057]FIG. 3 uses simulated array acoustic data to demonstrate the ability of coherence filtering to extract formation signals through an unbonded casing. This is a free pipe situation with a 0.25-cm thick fluid annulus behind the casing. FIG. 3a illustrates a free-pipe model used to create the array acoustic data and FIG. 3b contains the corresponding modeled data. As with FIG. 2a, the data of FIG. 3b is in the time domain, with the ordinate in time units and the abscissa in distance units. The data shows strong ringing casing waves with almost no discernible formation arrivals. A direct semblance calculation was performed on the data of FIG. 3b and plotted in FIG. 3c. The plot of FIG. 3c on the data (right) shows a dominant casing peak (slowness=57 μs / ft) and a weak formation arrival (slowness=102 μs / ft) with a low semblance / coherent value. FIG. 3d illustrates the coherence-filtered formation signal f-k spectrum f...

example 3

Application to Cased-Hole Acoustic Data to Extract Formation P-Wave Slowness

[0059]FIG. 4 uses a field data example to demonstrate the ability of the coherence-filtering technique to extract formation slowness from cased hole acoustic data, even in the free-pipe situation. The acoustic data, shown in the Raw Data track, include several scenarios: good cement bond (middle), poor cement bond (lower), and poor bond / free pipe (upper). The data in the upper free-pipe sections are dominated by casing signals, resulting in inability to pick formation slowness from the semblance correlogram, which is shown in the Correlogram (raw data) track. As seen in the Filtered Data track, coherence filtering the data suppresses the casing signals and enhances the formation wave coherence. The enhanced coherence enables picking the formation slowness with high confidence even in the free pipe situation (Correlogram (filtered data)).


PUM


Abstract

A method waveform processing technique utilizing signal coherence of the array data for processing signals having poor signal-to-noise ratio. Raw waveform data is first transformed into f-k (frequency-wavenumber) domain. A coherence function is then calculated and convolved with the data in the f-k domain, which effectively suppresses non-coherent signals in the data. For the remaining coherent data, the unwanted part is muted and the wanted part is retained and inverse-transformed to yield the coherence-filtered array waveform data. After this processing, small signals that are hidden in the original data are extracted with much enhanced coherence. Subsequent processing of the data yields reliable information about formation acoustic property.

Description

RELATED APPLICATIONS[0001]This application claims priority from U.S. Provisional Application No. 60 / 690,880, filed Jun. 15, 2005, the full disclosure of which is hereby incorporated by reference herein.BACKGROUND OF THE INVENTION[0002]1. Field of the Invention[0003]The present invention relates to a method and system of filtering signal data. More specifically, the present invention relates to a method and system for analyzing signal data collected by an array of receivers, determining the coherence function of the received data, and filtering the received raw data with the coherence function.[0004]2. Description of Related Art[0005]Data collection arrays, i.e. a collection of more than one single position point data recorders, are used in the collection of a myriad of data. Examples of array collected data include radar, seismic, acoustic, sonar, radio waves, to name but a few. Often the data received and recorded by such arrays can include unwanted signals that intermingle with th...

Claims


Application Information

Patent Timeline
Patent Type & Authority Patents(United States)
IPC IPC(8): G01V1/36
CPCG01V1/364G01V2210/20
Inventor TANG, XIAO MING
Owner BAKER HUGHES INC
Why Eureka
Try Eureka