Method for coherence-filtering of acoustic array signal
a coherence filtering and array signal technology, applied in the field of filtering signal data, can solve the problems of interference with formation signals, affecting the coherence of acoustic array signals, and often contaminated acoustic signals that travel along the formation, so as to achieve enhanced coherence, suppress non-coherent signals in data, and poor signal-to-noise ratio
- Summary
- Abstract
- Description
- Claims
- Application Information
AI Technical Summary
Benefits of technology
Problems solved by technology
Method used
Image
Examples
example 1
A Real Data Example to Demonstrate the Coherence—Filtering Procedure
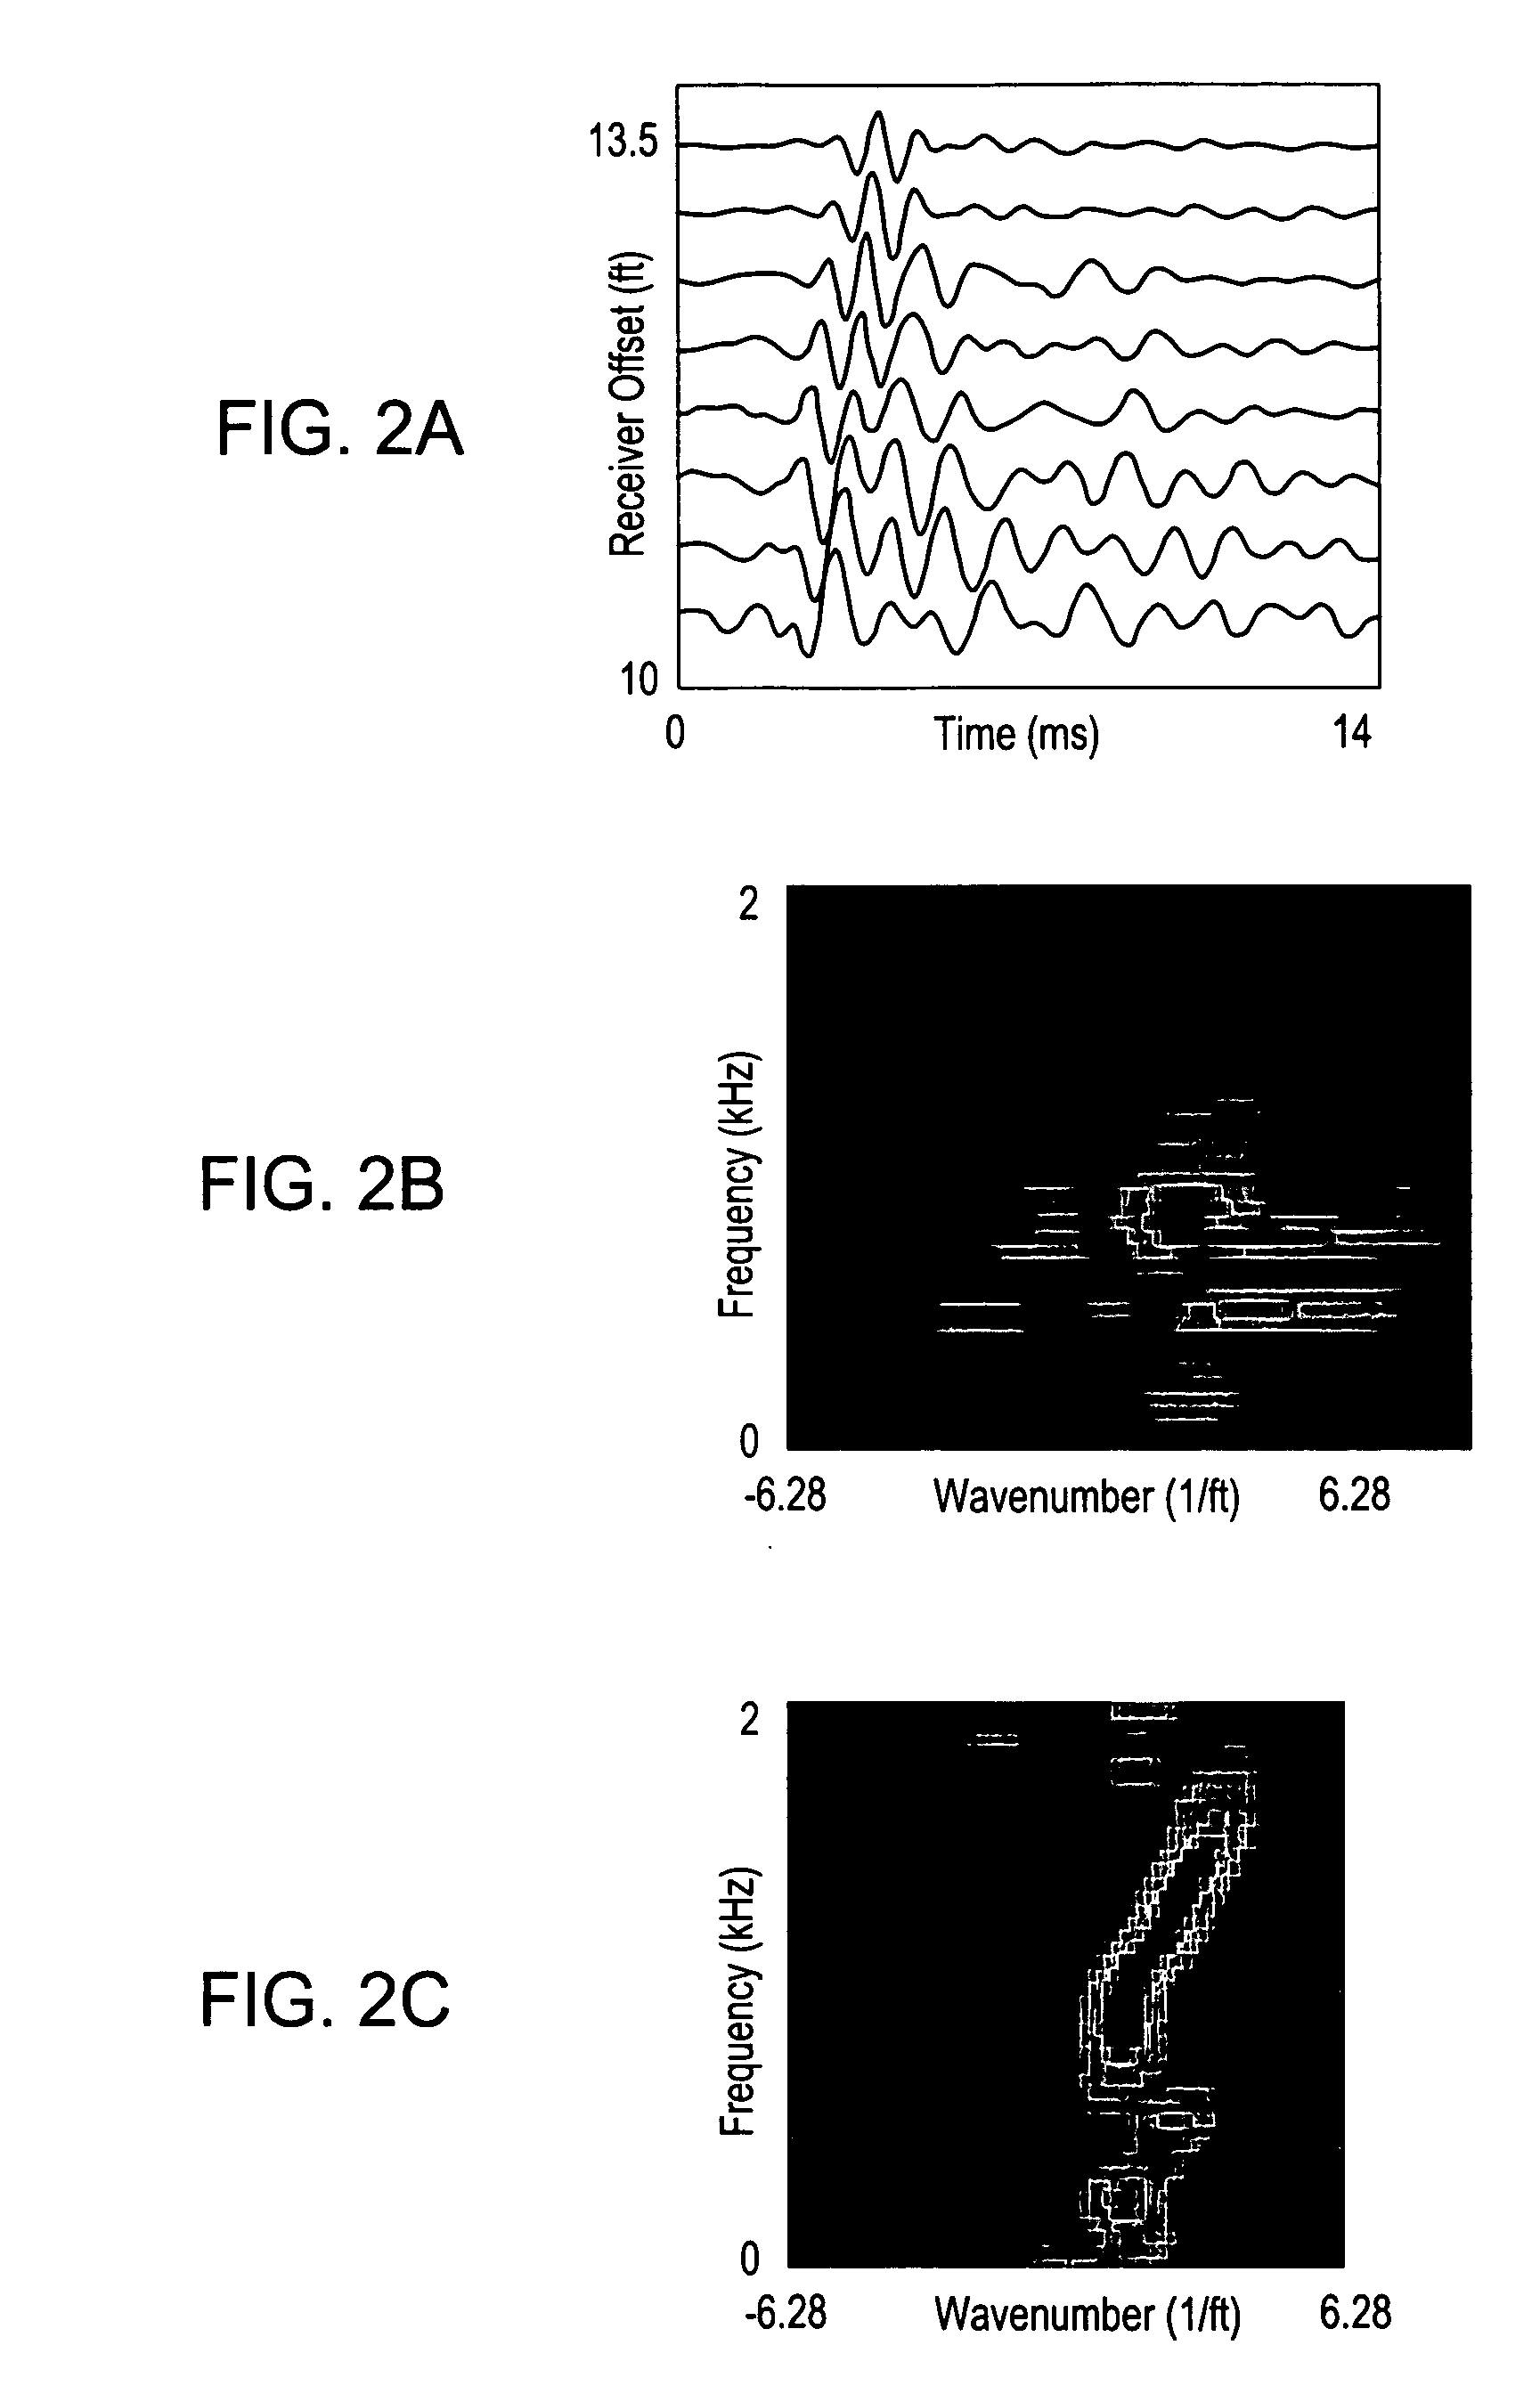
[0048]FIGS. 2a-2e demonstrate the coherence filtering procedure using a field dipole data example. Here the data were recorded by a wireline dipole acoustic logging tool. The tool consists of a dipole transmitter and an array of receivers that are located about 10 ft above the transmitter and aligned longitudinally along the tool. FIG. 2a is a graphical depiction of raw low-frequency dipole array acoustic data recorded by an array of equally spaced acoustic receivers. This data can also be referred to as received data or a received signal. The ordinate represents time and the abscissa represents the distance between the dipole source transmitter and the receivers. Significant noise contamination can be seen from the wave reverberations in the raw data of the near receivers.
[0049] The corresponding f-k spectrum is shown in FIG. 2b where several closely clustered events are exhibited. Since the aliasing effect does ...
example 2
Extracting Formation P Wave from Free Pipe (Synthetic) Acoustic Data
[0050]FIG. 3 uses simulated array acoustic data to demonstrate the ability of coherence filtering to extract formation signals through an unbonded casing. This is a free pipe situation with a 0.25-cm thick fluid annulus behind the casing. FIG. 3a illustrates a free-pipe model used to create the array acoustic data and FIG. 3b contains the corresponding modeled data. As with FIG. 2a, the data of FIG. 3b is in the time domain, with the ordinate in time units and the abscissa in distance units. The data shows strong ringing casing waves with almost no discernible formation arrivals. A direct semblance calculation was performed on the data of FIG. 3b and plotted in FIG. 3c. The plot of FIG. 3c on the data (right) shows a dominant casing peak (slowness=57 μs / ft) and a weak formation arrival (slowness=102 μs / ft) with a low semblance / coherent value. FIG. 3d illustrates the coherence-filtered formation signal f-k spectrum ...
example 3
Application to Cased-Hole Acoustic Data to Extract Formation P-Wave Slowness
[0052]FIG. 4 uses a field data example to demonstrate the ability of the coherence-filtering technique to extract formation slowness from cased hole acoustic data, even in the free-pipe situation. The acoustic data, shown in the Raw Data track, include several scenarios: good cement bond (middle), poor cement bond (lower), and poor bond / free pipe (upper). The data in the upper free-pipe sections are dominated by casing signals, resulting in inability to pick formation slowness from the semblance correlogram, which is shown in the Correlogram (raw data) track. As seen in the Filtered Data track, coherence filtering the data suppresses the casing signals and enhances the formation wave coherence. The enhanced coherence enables picking the formation slowness with high confidence even in the free pipe situation (Correlogram (filtered data)).
PUM
 Abstract
Description
Claims
Application Information
 - R&D
- Intellectual Property
- Life Sciences
- Materials
- Tech Scout
- Unparalleled Data Quality
- Higher Quality Content
- 60% Fewer Hallucinations
Browse by: Latest US Patents, China's latest patents, Technical Efficacy Thesaurus, Application Domain, Technology Topic, Popular Technical Reports.
© 2025 PatSnap. All rights reserved.Legal|Privacy policy|Modern Slavery Act Transparency Statement|Sitemap|About US| Contact US: help@patsnap.com


