
Method of wastewater flow measurement, system analysis, and improvement

a wastewater and system analysis technology, applied in the direction of mechanical measuring arrangements, instruments, machines/engines, etc., can solve the problems of potential safety risks, difficult to obtain parameters with any certainty, and inability to install meters on site, so as to reduce the cost of wastewater treatment and reduce the amount of rainwater

Active Publication Date: 2013-05-21
EASTECH FLOW CONTROLS
View PDF26 Cites 9 Cited by
  • Summary
  • Abstract
  • Description
  • Claims
  • Application Information

AI Technical Summary

Benefits of technology

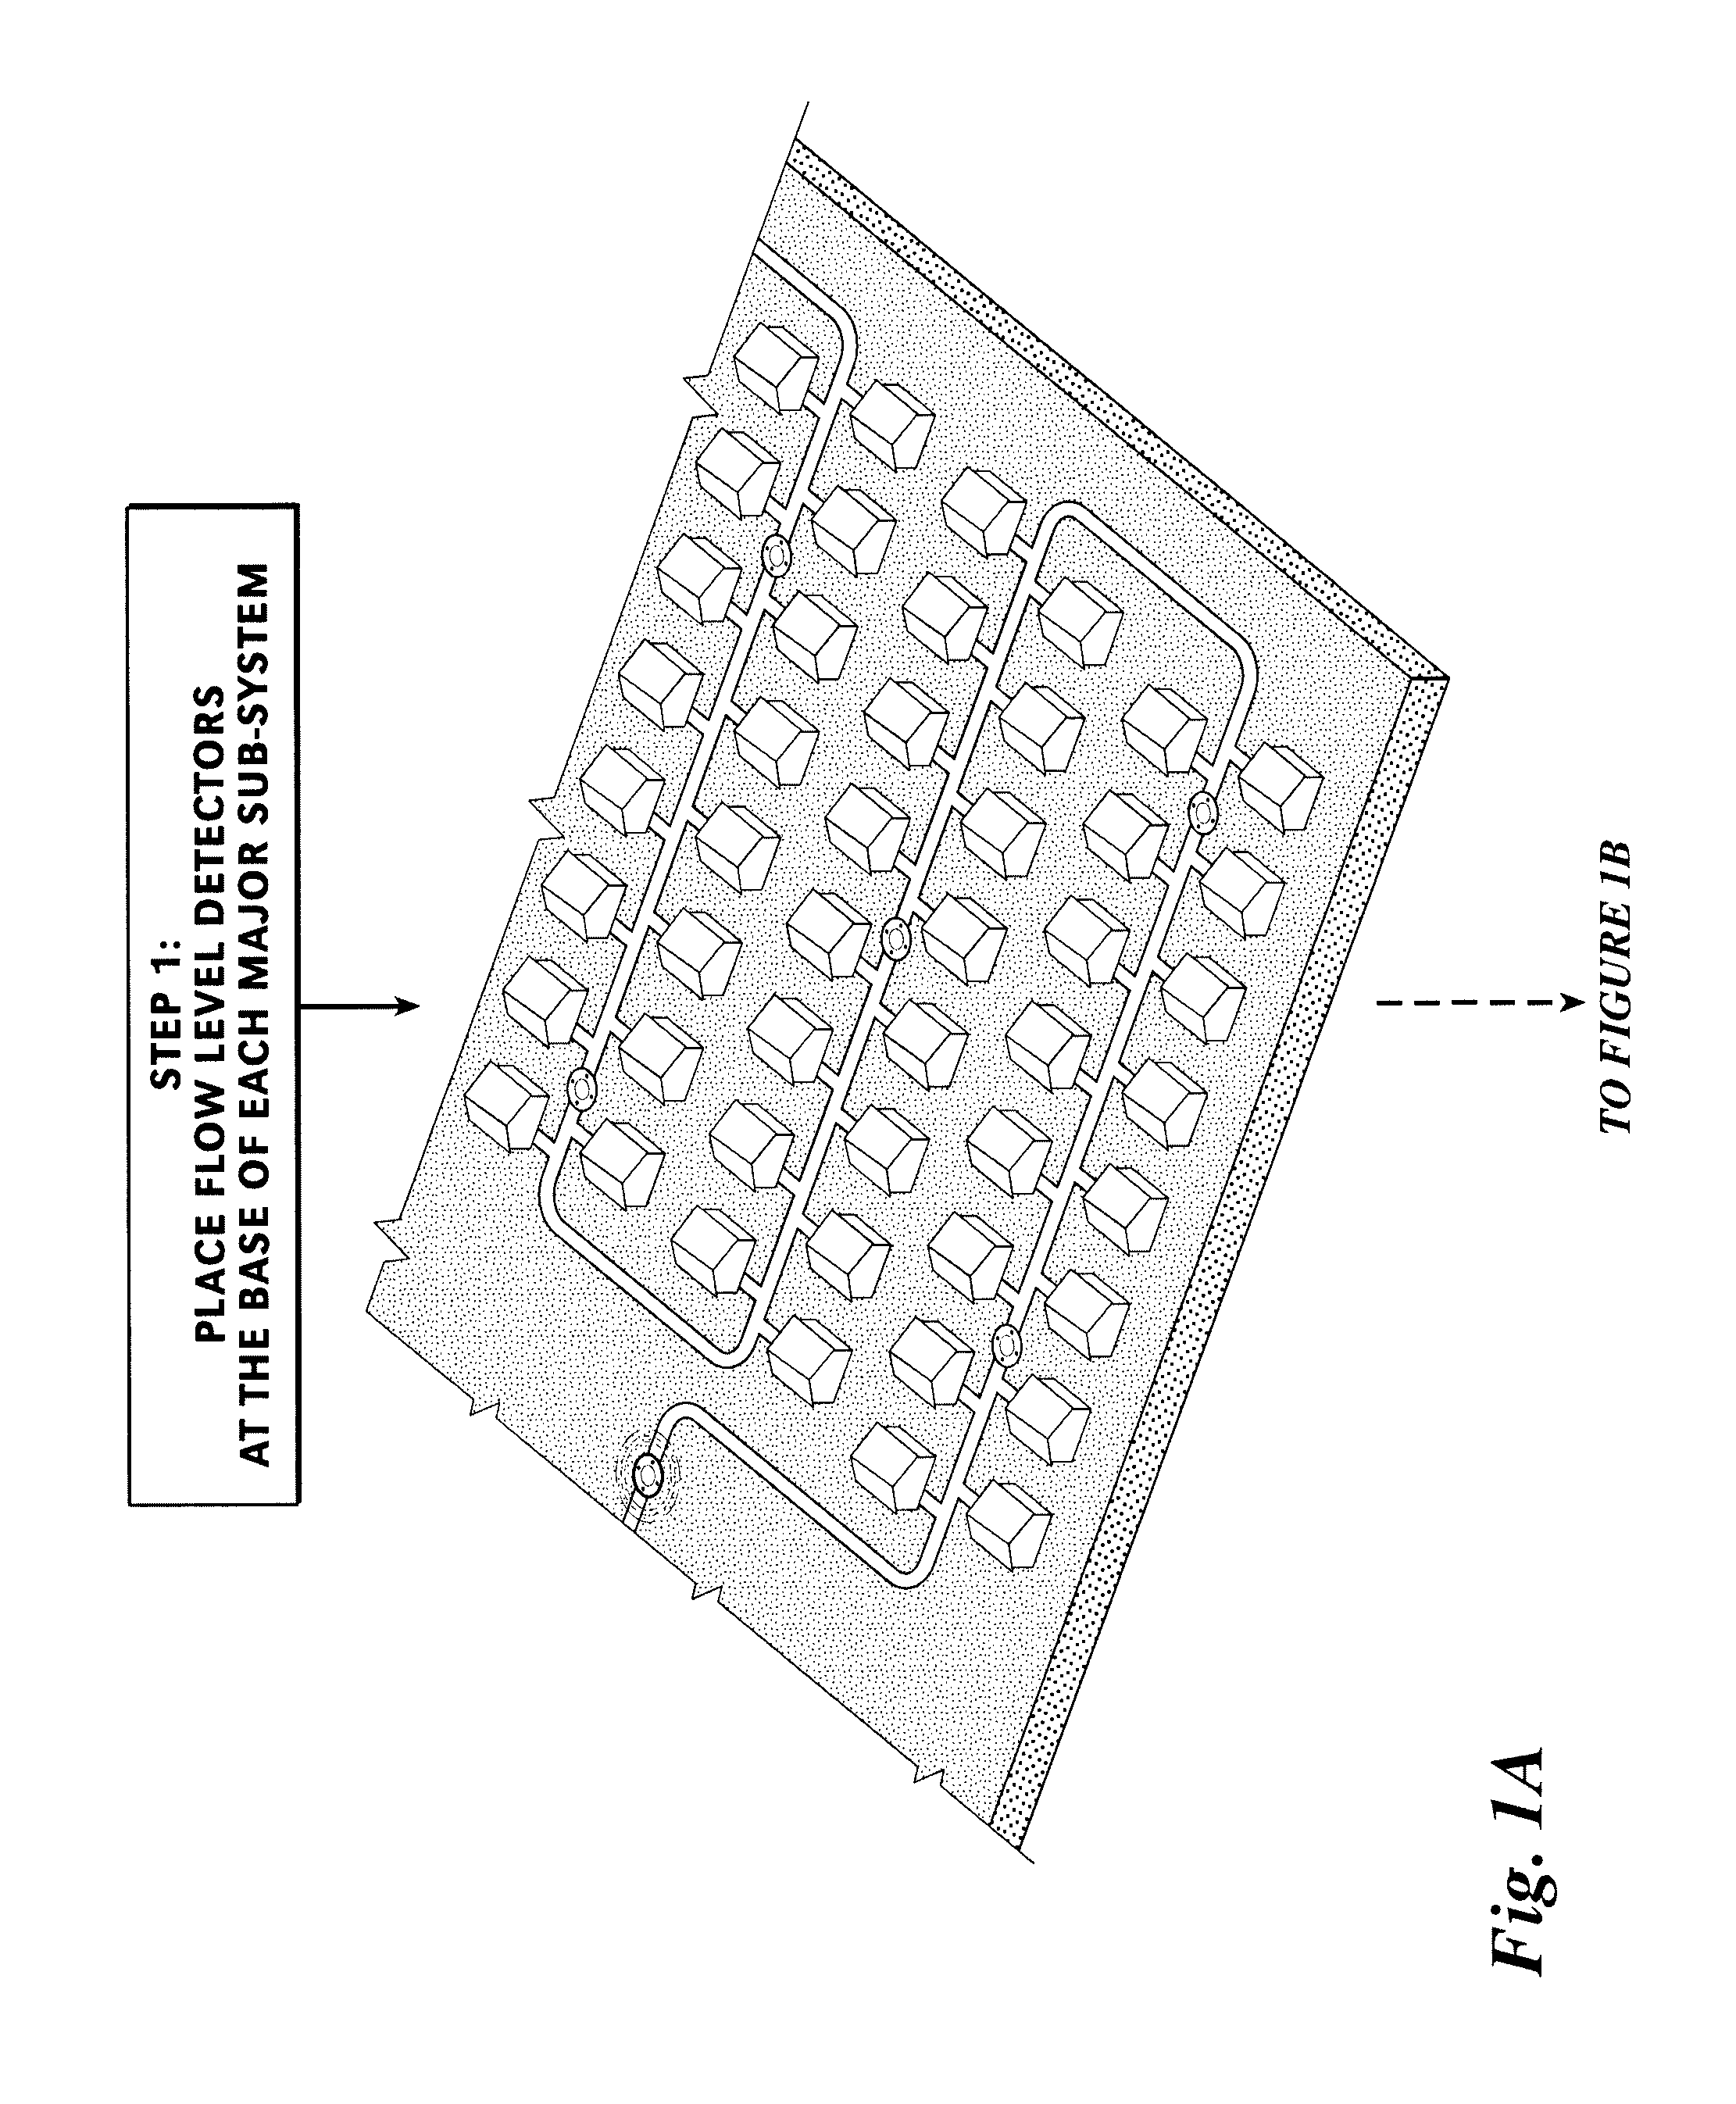
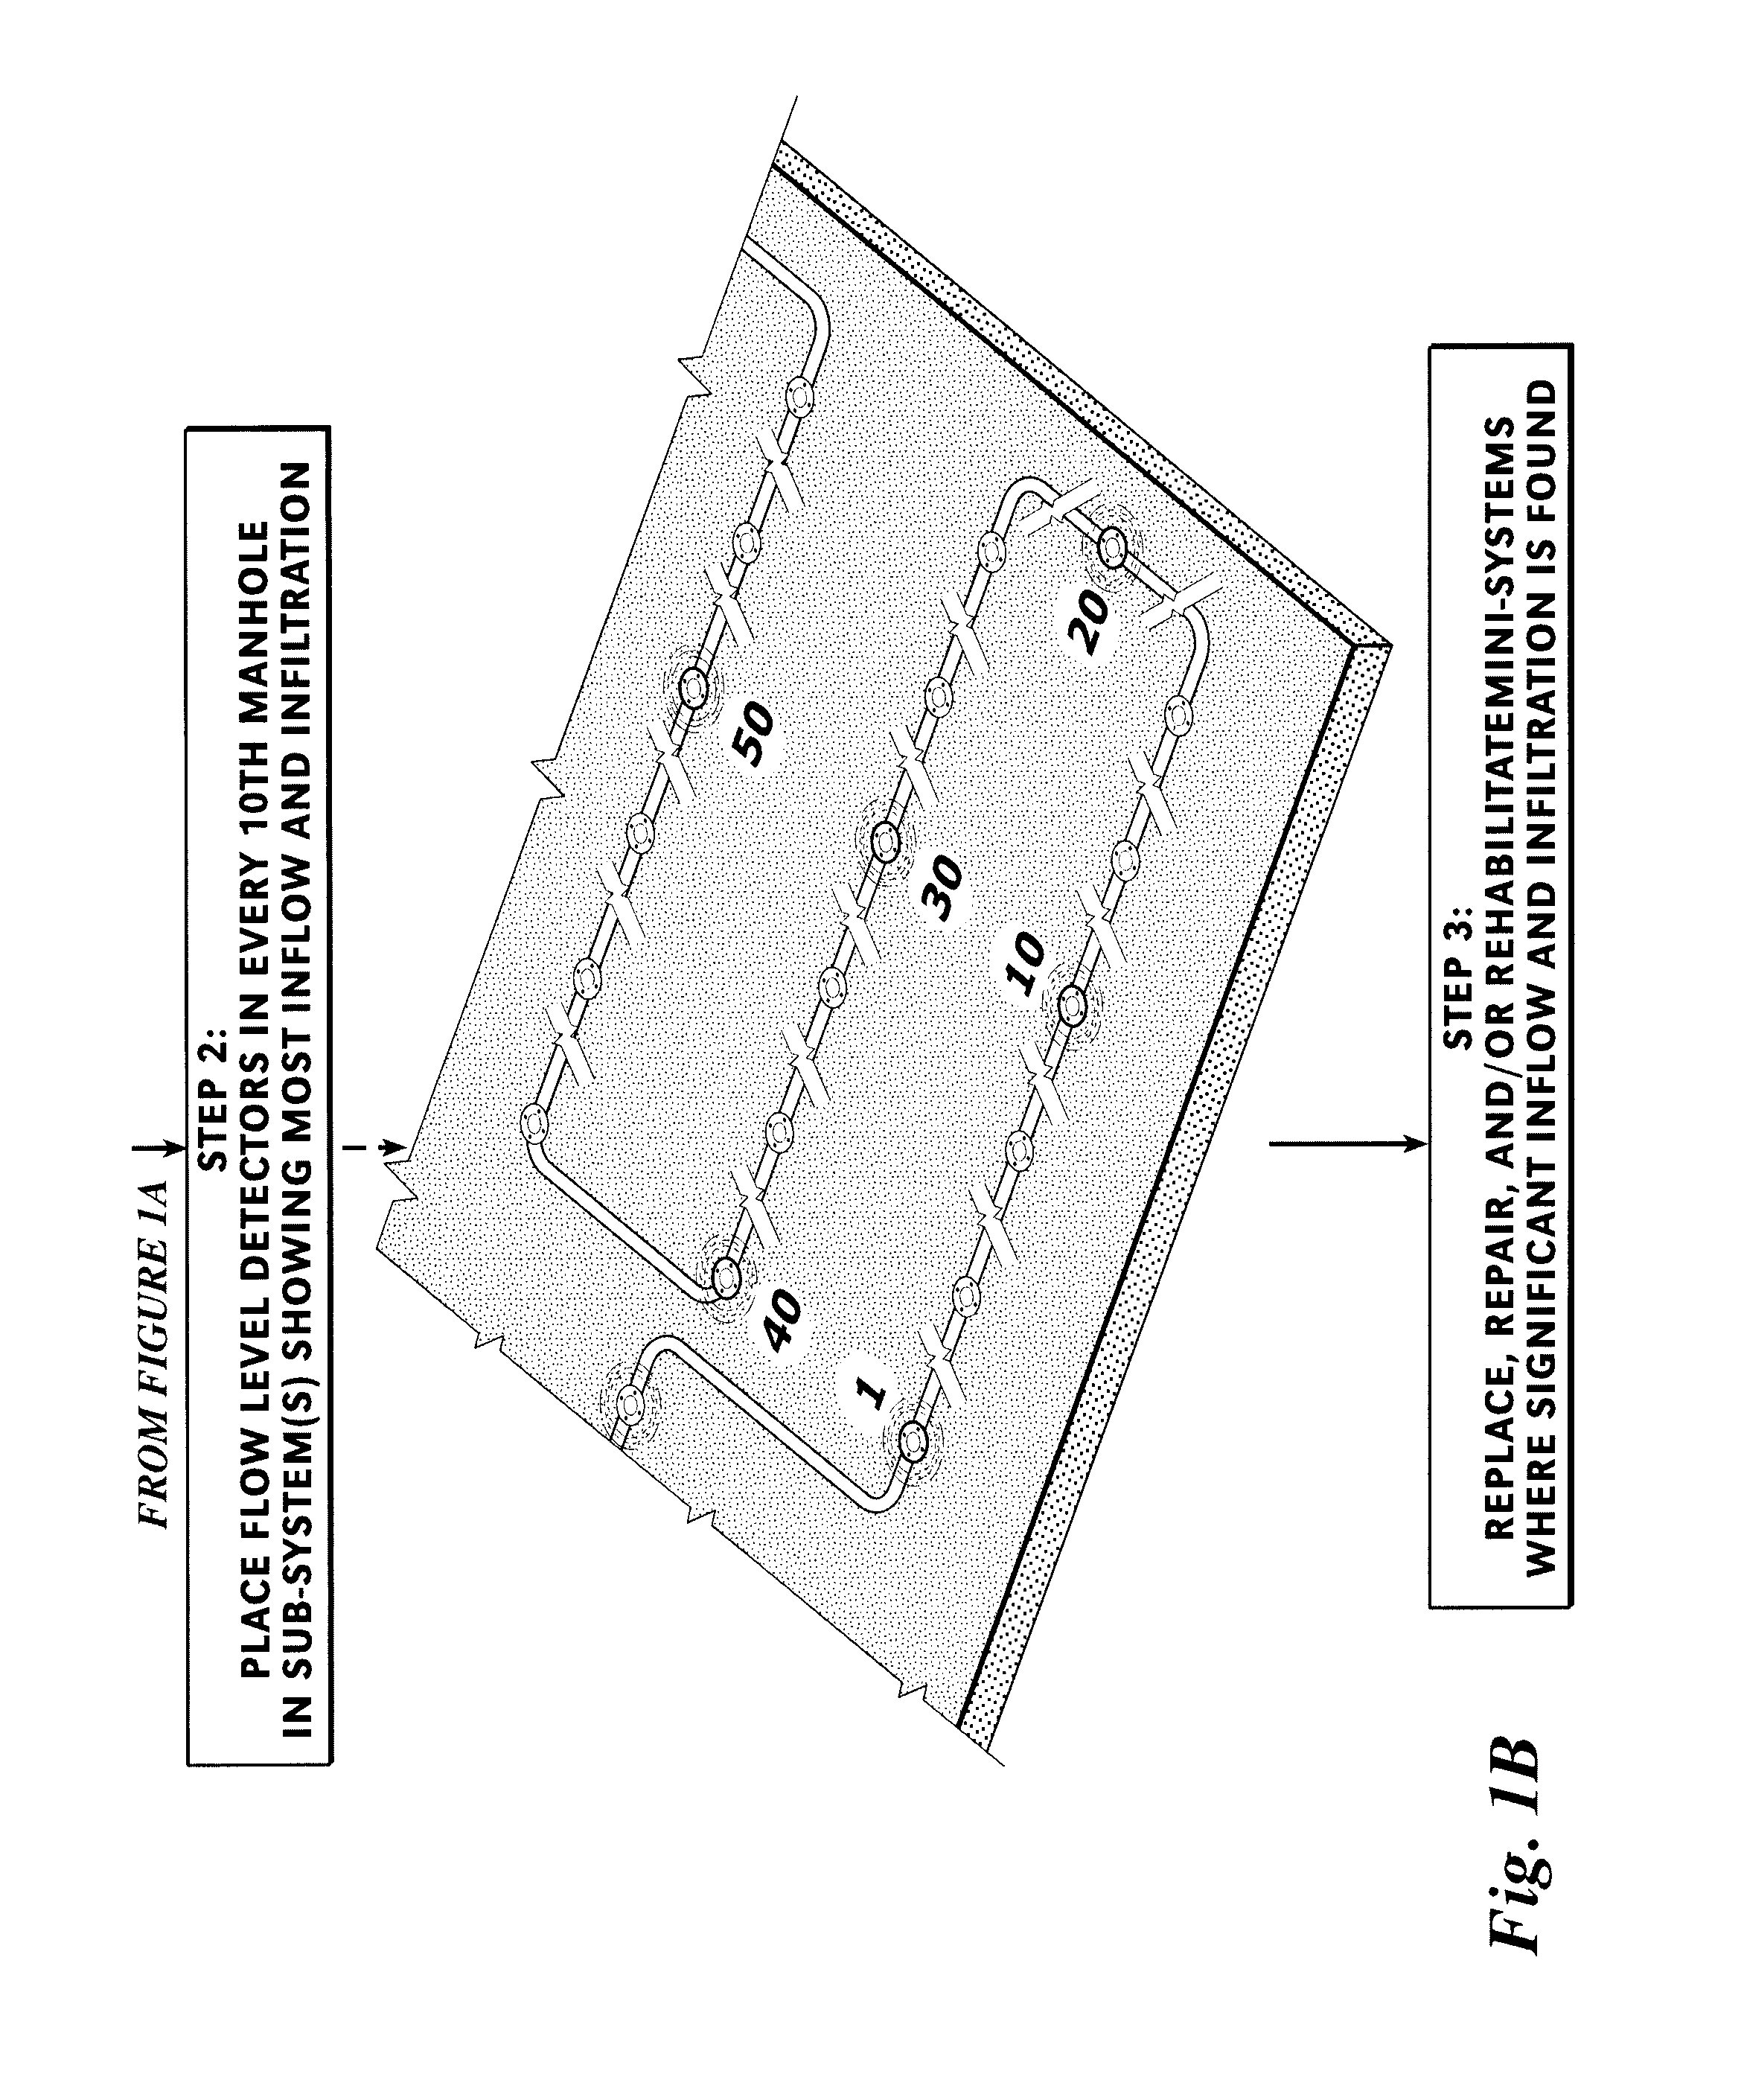
The invention is a method for reducing wastewater treatment charges in municipalities by detecting and locating millions of additional gallons of ground and storm water that enter the collection system due to inflow and infiltration. This method identifies and facilitates improvements and repairs for reducing treatment costs by millions of dollars. The method uses a unique ability to detect and locate these inflows and infiltration by measuring the difference in wastewater flows between dry and wet weather conditions. The method also involves dividing the wastewater collection grid into subsystems and using the difference in flow depth levels between dry and wet weather conditions to determine the cross-sectional area of flow for each subsystem. The highest ranking subsystems are then identified based on their volume and cost contributions to the wastewater collection grid. The method can be easily implemented and can help reduce wastewater treatment charges by millions of dollars for municipalities.

Problems solved by technology

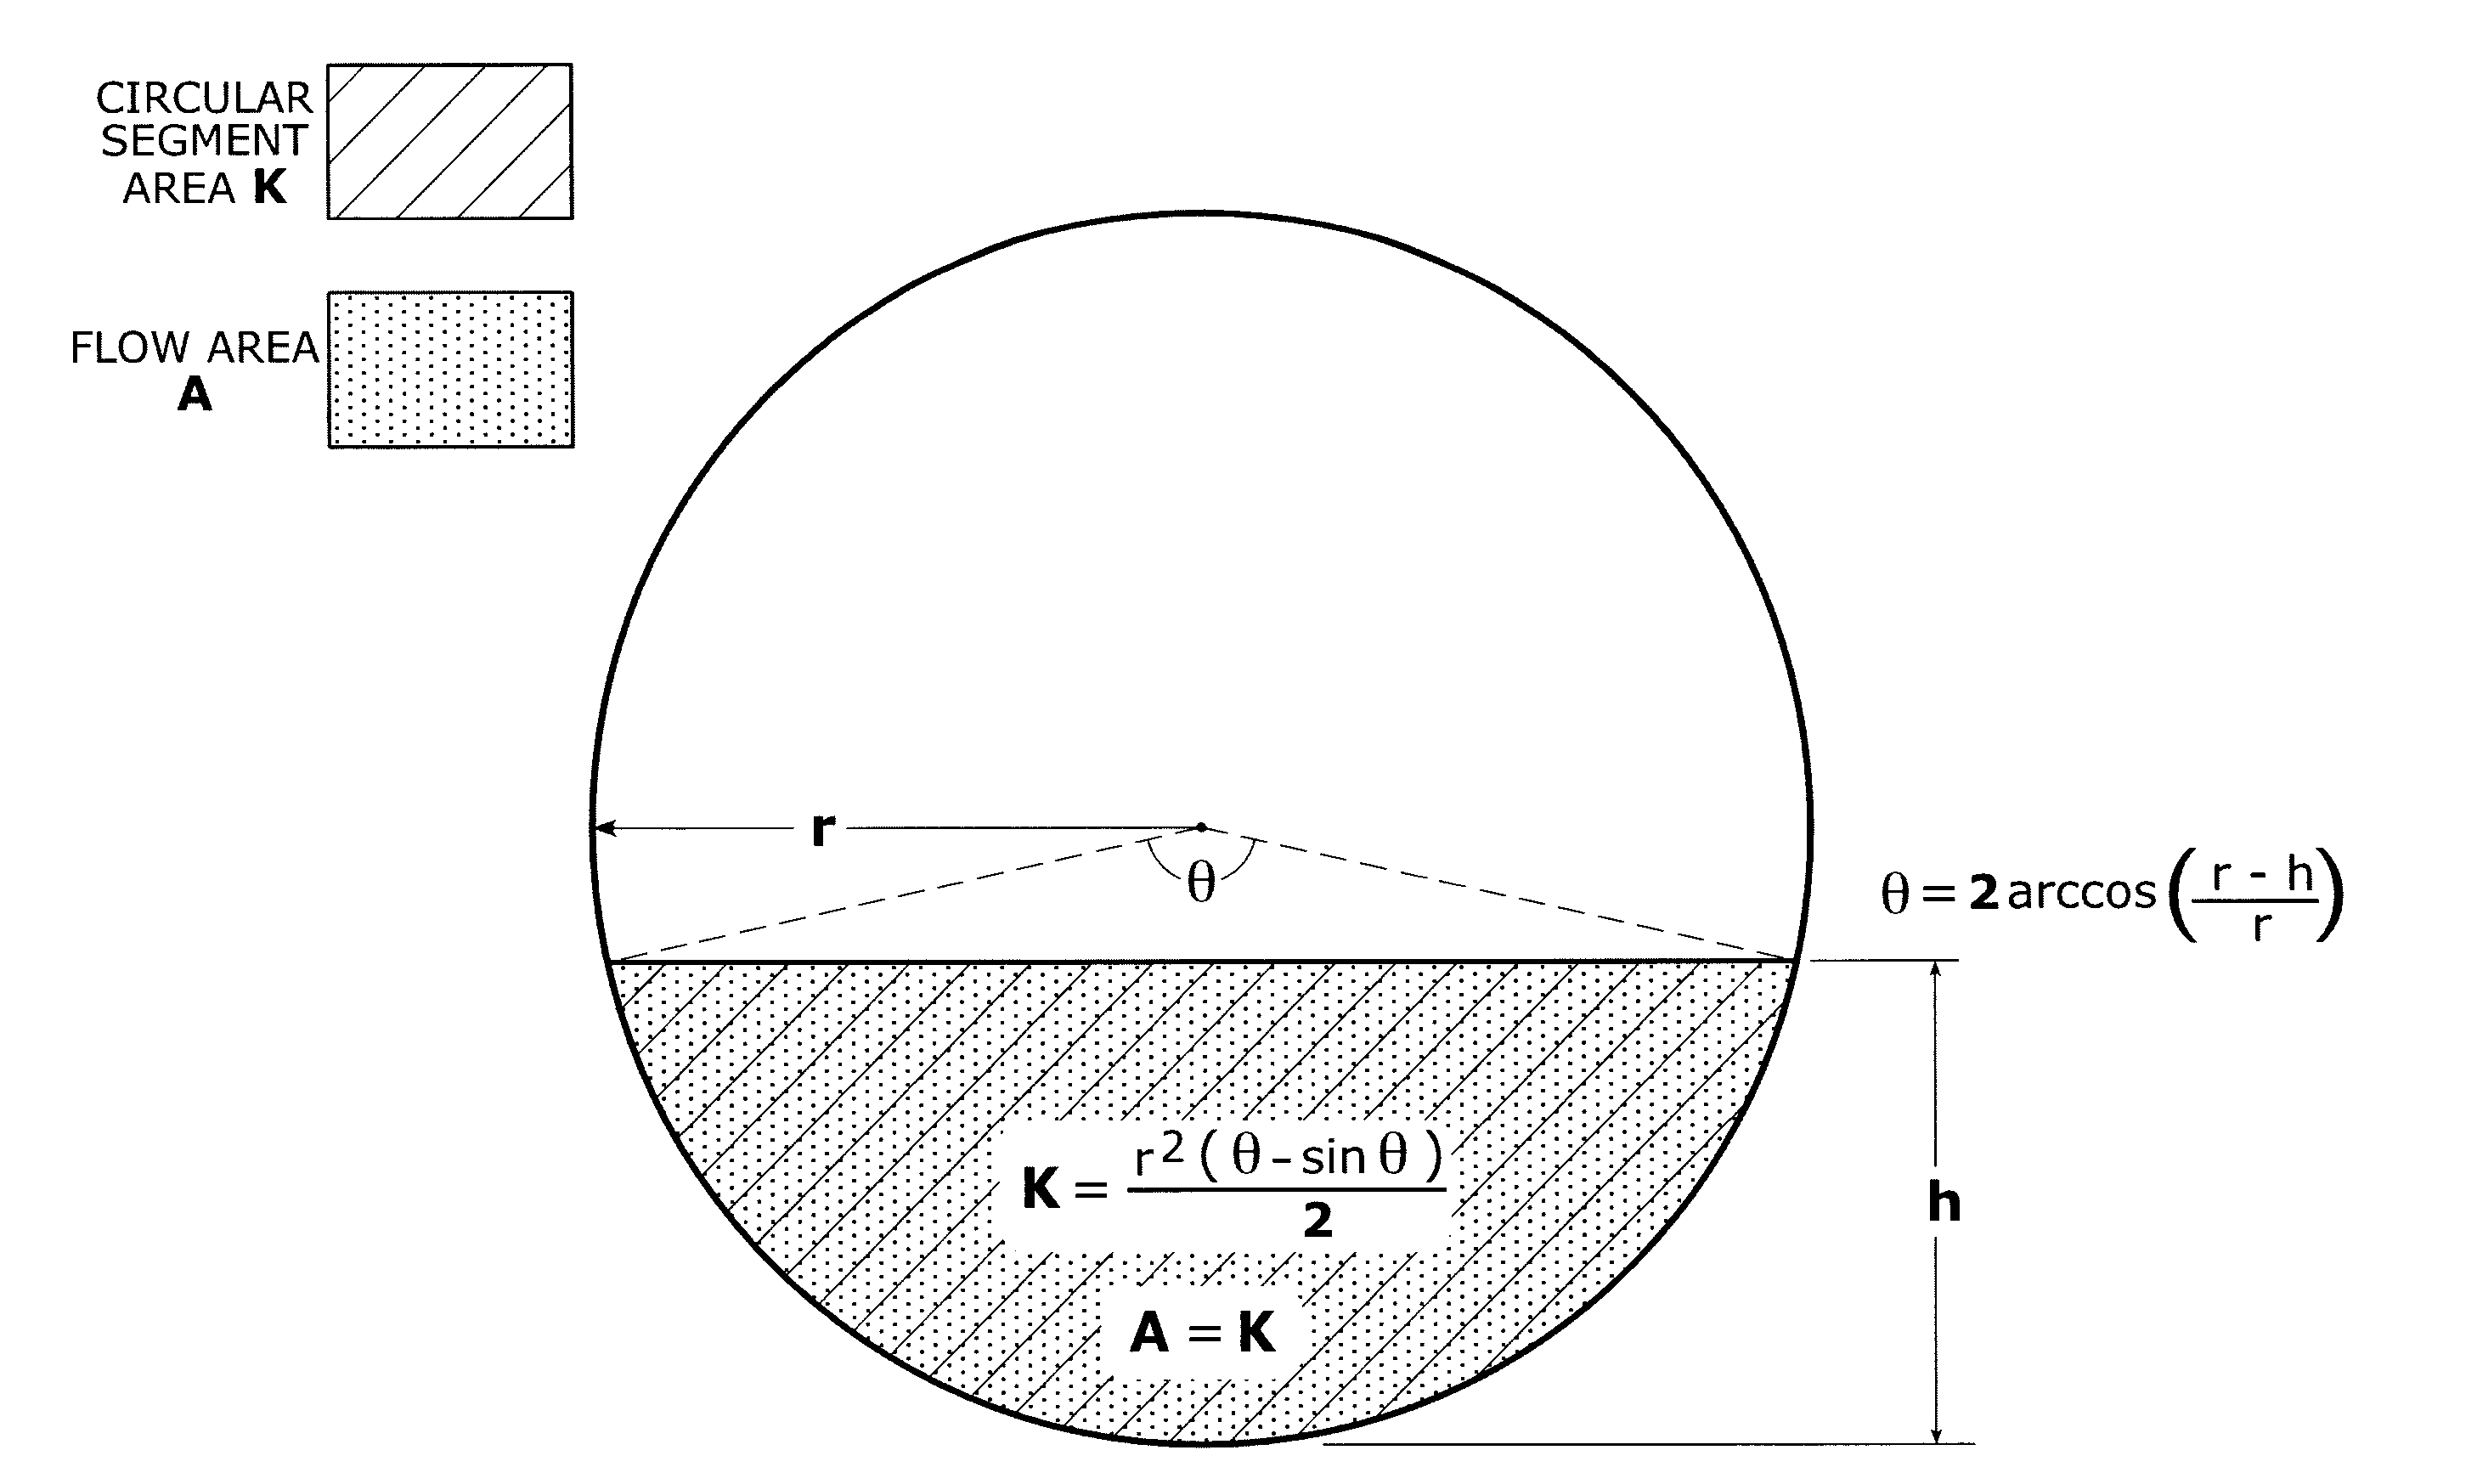
These parameters may be difficult to obtain with any certainty or may require stopping flow, which may not be practical for meter site installation.
Unfortunately, heretofore during meter installation, it has typically been required to go into a confined space area to get measurements required for accurate flow calculation.
This created a potential safety risk and required special equipment and permits.

Method used


Image

  • Method of wastewater flow measurement, system analysis, and improvement
  • Method of wastewater flow measurement, system analysis, and improvement
  • Method of wastewater flow measurement, system analysis, and improvement

Examples


example i

[0040]

TABLE 1Report 1Inflow and Infiltration (I&I) Contribution AnalysisDELTA QSUBSYSTEM 1-8(APR. 1-JUN. 30)CALCULATIONAv. Dry Avg. Dry + Δ Q Avg. Sewer Pipe Day level Wet Day Change inSub-LengthDiameter (% Full Level (%Volume system(Ft.)(In.)Pipe)Full Pipe) Due to I&I120,0001225%33%1.67219,0001025%31%1.52322,000825%27%1.21421,0001225%27%1.14520,0001527%29%1.15624,0001828%30%1.16718,0001030%43%1.95820,000825%26%1.10

[0041]As can be ascertained from Report 1, 50% of the total inflow and infiltration is contributed by subsystems 1 and 7.

[0042]

TABLE 2Report 2Inflow and Infiltration (I&I) Contribution AnalysisSUBSYSTEM 1-8VOLUME &Av. Esti-Av. Dry +(APR. 1-JUN. 30)COST mated Dry Wet Day Avg. Avg. CALCULATIONDay Volume Volume (Qw = Cost / DayCost / YearSub-Residents (Qd) (Gal-Qd * ΔQ)Due to Due to systemServed1 lons / Day)(Gallons / Day)I&I ($)2I&I ($)21112078,800131,000$202$74,0002105073,000110,000$144$53,000391064,00077,000 $50$18,0004112183,00095,000 $46$17,0005140098,000113,000 $58$21,00061680...

example ii

[0046]

TABLE 4COMPARATIVE COST ANALYSIS SHOWING PROJECTED COSTS OF THE INVENTIVE FLOW STUDY METHOD VERSUS THE CONVENTIONAL METHODInventive Flow Conventional Flow Study Study Method(Doppler Portable Meters)Five I & I Detection $13,500Five Portable Flow $22,500Modules w / Flow Meters w / Flow Analysis Software Analysis SoftwareInstallation (5 units)  $750Installation (5 units) $5,000Non-Confined SpaceConfined Space EntryYearly Maintenance    $0Yearly Maintenance$48,000Contract (5 Units)($800 / Unit / Month)TOTAL COST$14,250TOTAL COST$75,000TOTAL FIRST YEAR SAVINGS$61,250TOTAL SAVINGS PER YEAR GOING FORWARD$52,250

[0047]The unique ability of the inventive method for cost-effectively locating inflow and infiltration creates the potential for ultimately reducing a municipality's wastewater treatment charges by hundreds of thousands of dollars.

example iii

[0048]

TABLE 5COST-EFFECTIVE ANALYSIS FOR REHABILITATION OF HIGHEST RANK GRID SEGMENTSSegment50%(manholeSewerPipeRemovableCosttoLengthDiam.I&I (Avg.SavingsRankingmanhole)(Ft.)(In.)Delta Q5Gal / Day)Per Year6113-151,000121.8220,000$28,324217-201,150121.5414,000$19,82635-71,100121.128,000$11,329428-30950101.075,100 $7,420POTENTIAL TOTAL COST SAVINGS OVER 10 YEARS (10 × $66,900) $669,0005Delta Q represents the average change in wastewater volume due to the effects of inflow and infiltration.6Cost Savings Per year is based upon a wastewater treatment rate of $3.88 / 1000 Gallons.


PUM


Abstract

A method of reducing rainwater and / or groundwater inflow and infiltration into a wastewater treatment collection grid. The method preferably involves the steps of (a) dividing the grid into a plurality of major subsystems, (b) determining flow depth levels in each major subsystem under dry and wet conditions, (c) using these wet weather and dry weather flow depth measurements to determine a volume flow ratio for wet versus dry conditions, (d) using these flow ratios to identify the particular major subsystem(s) in which the greatest amount of inflow or infiltration is occurring, and then (e) further dividing the highest ranking major subsystem(s) into smaller subsystems in which the same dry and wet weather level measurement and ranking analysis is preferably conducted to further isolate problem locations for surveillance, maintenance, and / or repair.

Description

[0001]This application claims the benefit of U.S. Provisional Patent Application Ser. No. 61 / 251,004, filed on Oct. 13, 2009, the disclosure of which is incorporated herein by reference as if fully set out at this point.FIELD OF THE INVENTION[0002]The present invention relates to methods of wastewater flow measurement, system analysis, and improvement.BACKGROUND OF THE INVENTION[0003]From 2004 to 2009, the average U.S. national wastewater treatment rate increased by 28%. There are approximately 18,500 municipalities in the United States producing 40 billion gallons of wastewater per day at a taxpayer cost of $150,000,000 or $55 billion dollars annually. A study by the Association of Metropolitan Sewage Agencies indicates that 25% of this 40 billion gallons per day, or $14 billion annually, is due to inflow and infiltration of ground and storm water, the cause of which is directly linked to an aging and faulty sewer infrastructure.[0004]For calculation of flow in an open channel that...

Claims


Application Information

Patent Timeline
Patent Type & Authority Patents(United States)
IPC IPC(8): G01F1/00G01F7/00G01F23/00
CPCE03F7/00E03F2201/20
Inventor SINCLAIR, FRANKLINWILLIAMS, DAVID D.
Owner EASTECH FLOW CONTROLS
Learn More