Detection device
a detection device and detection technology, applied in the direction of optical radiation measurement, instruments, spectrometry/spectrophotometry/monochromators, etc., to achieve the effect of improving detection accuracy
- Summary
- Abstract
- Description
- Claims
- Application Information
AI Technical Summary
Benefits of technology
Problems solved by technology
Method used
Image

Examples
first experimental example
4.1. First Experimental Example
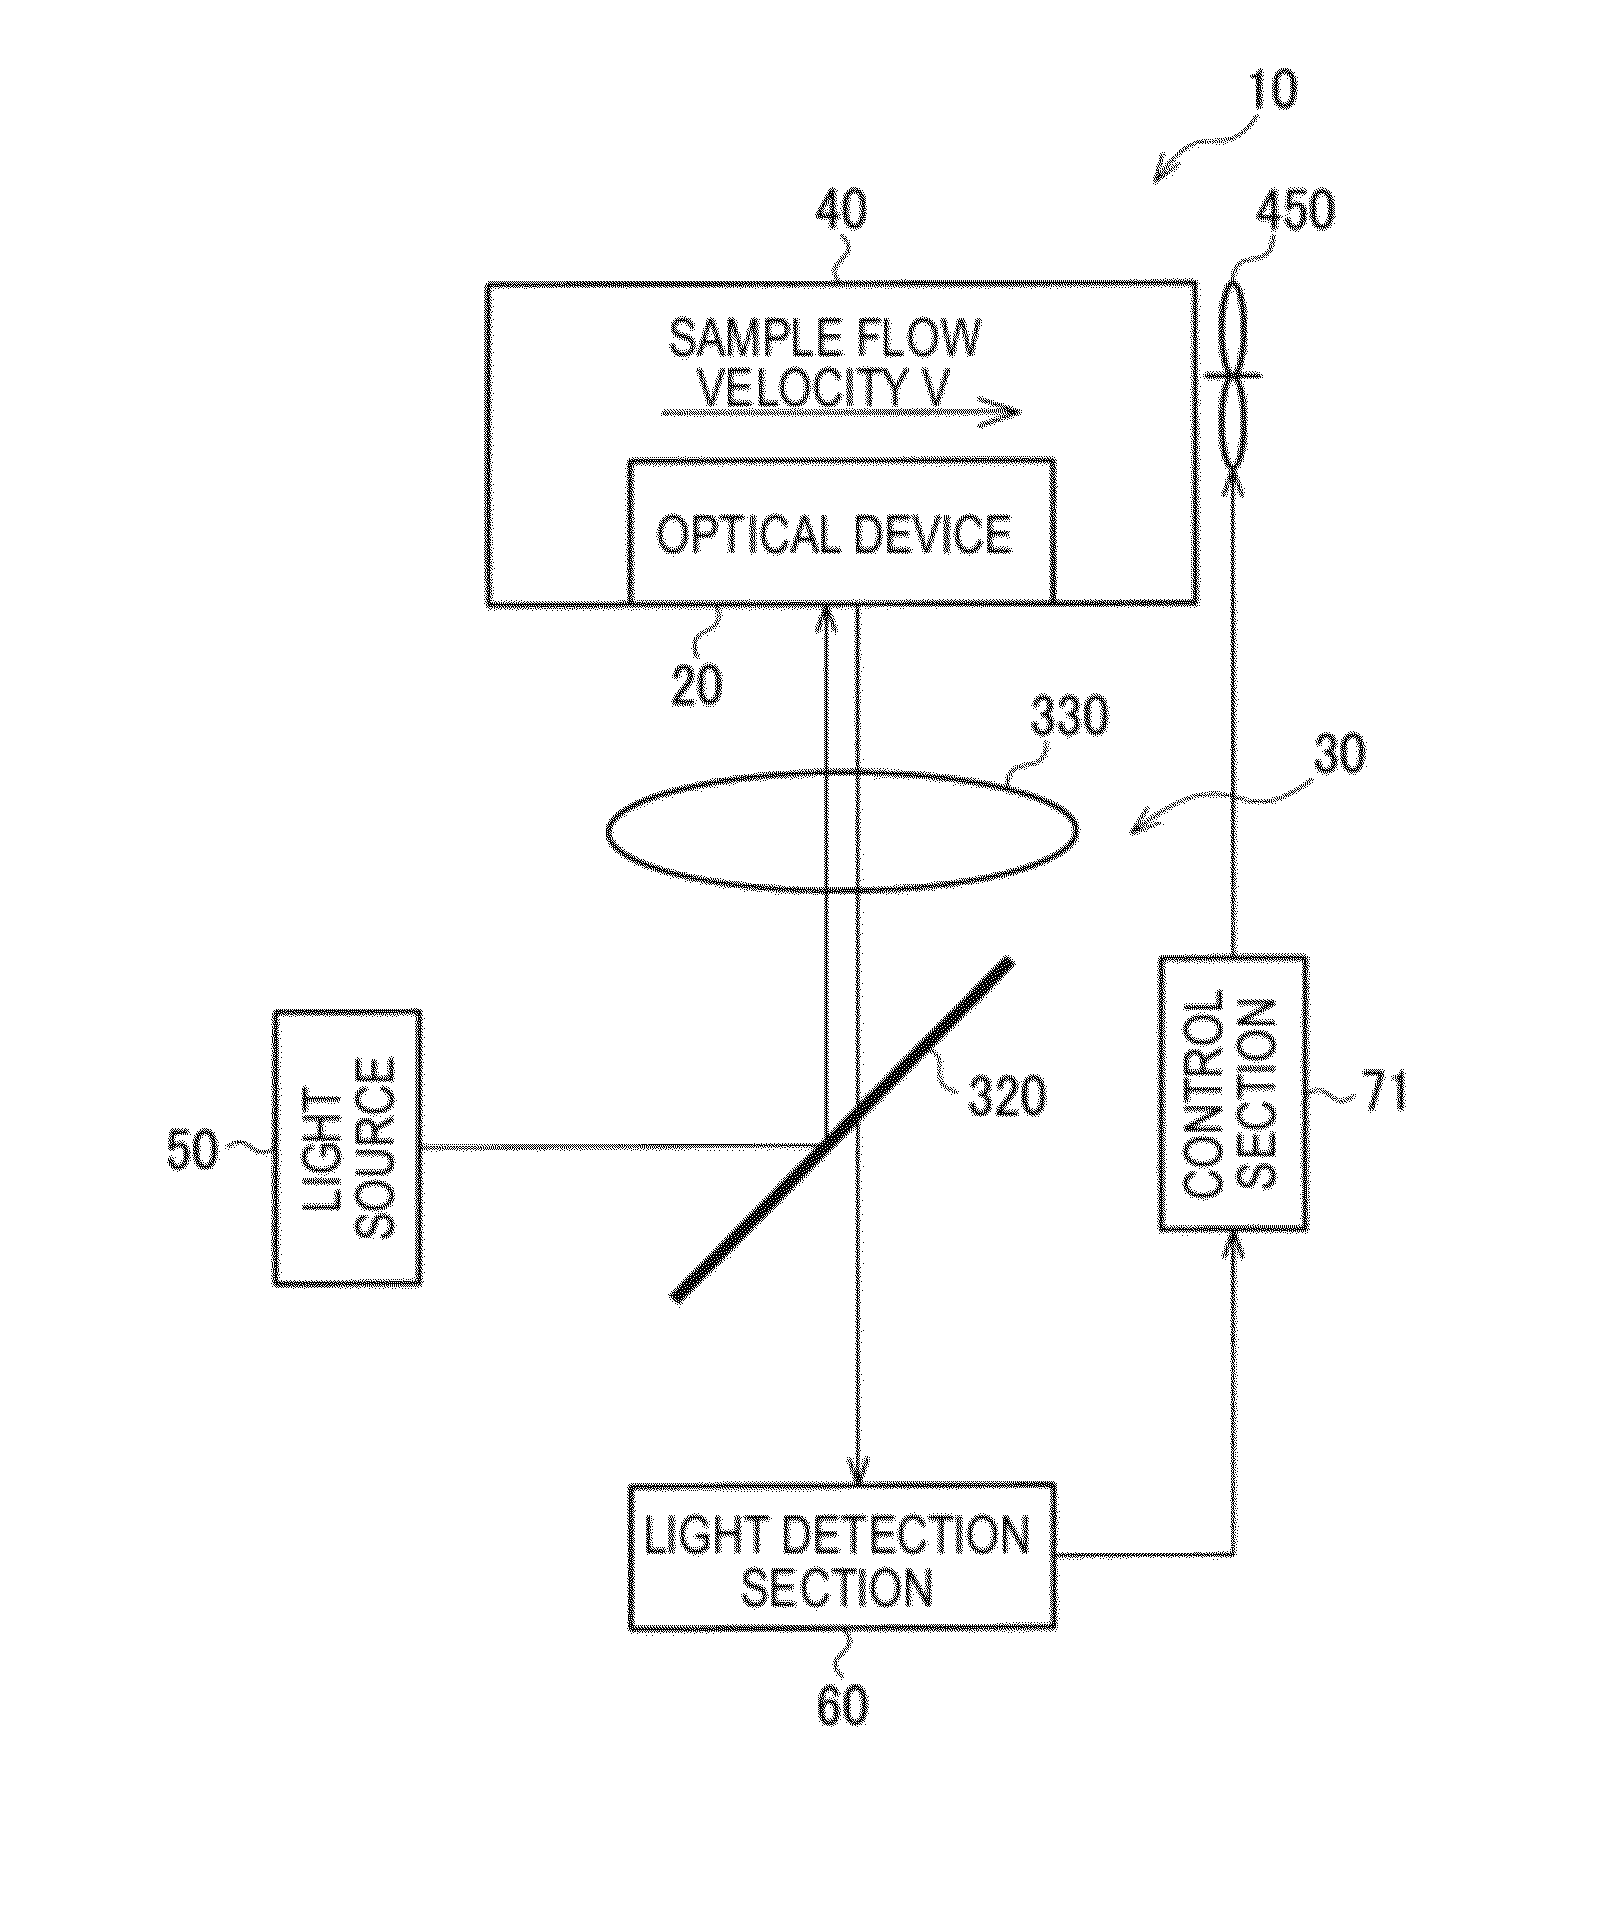
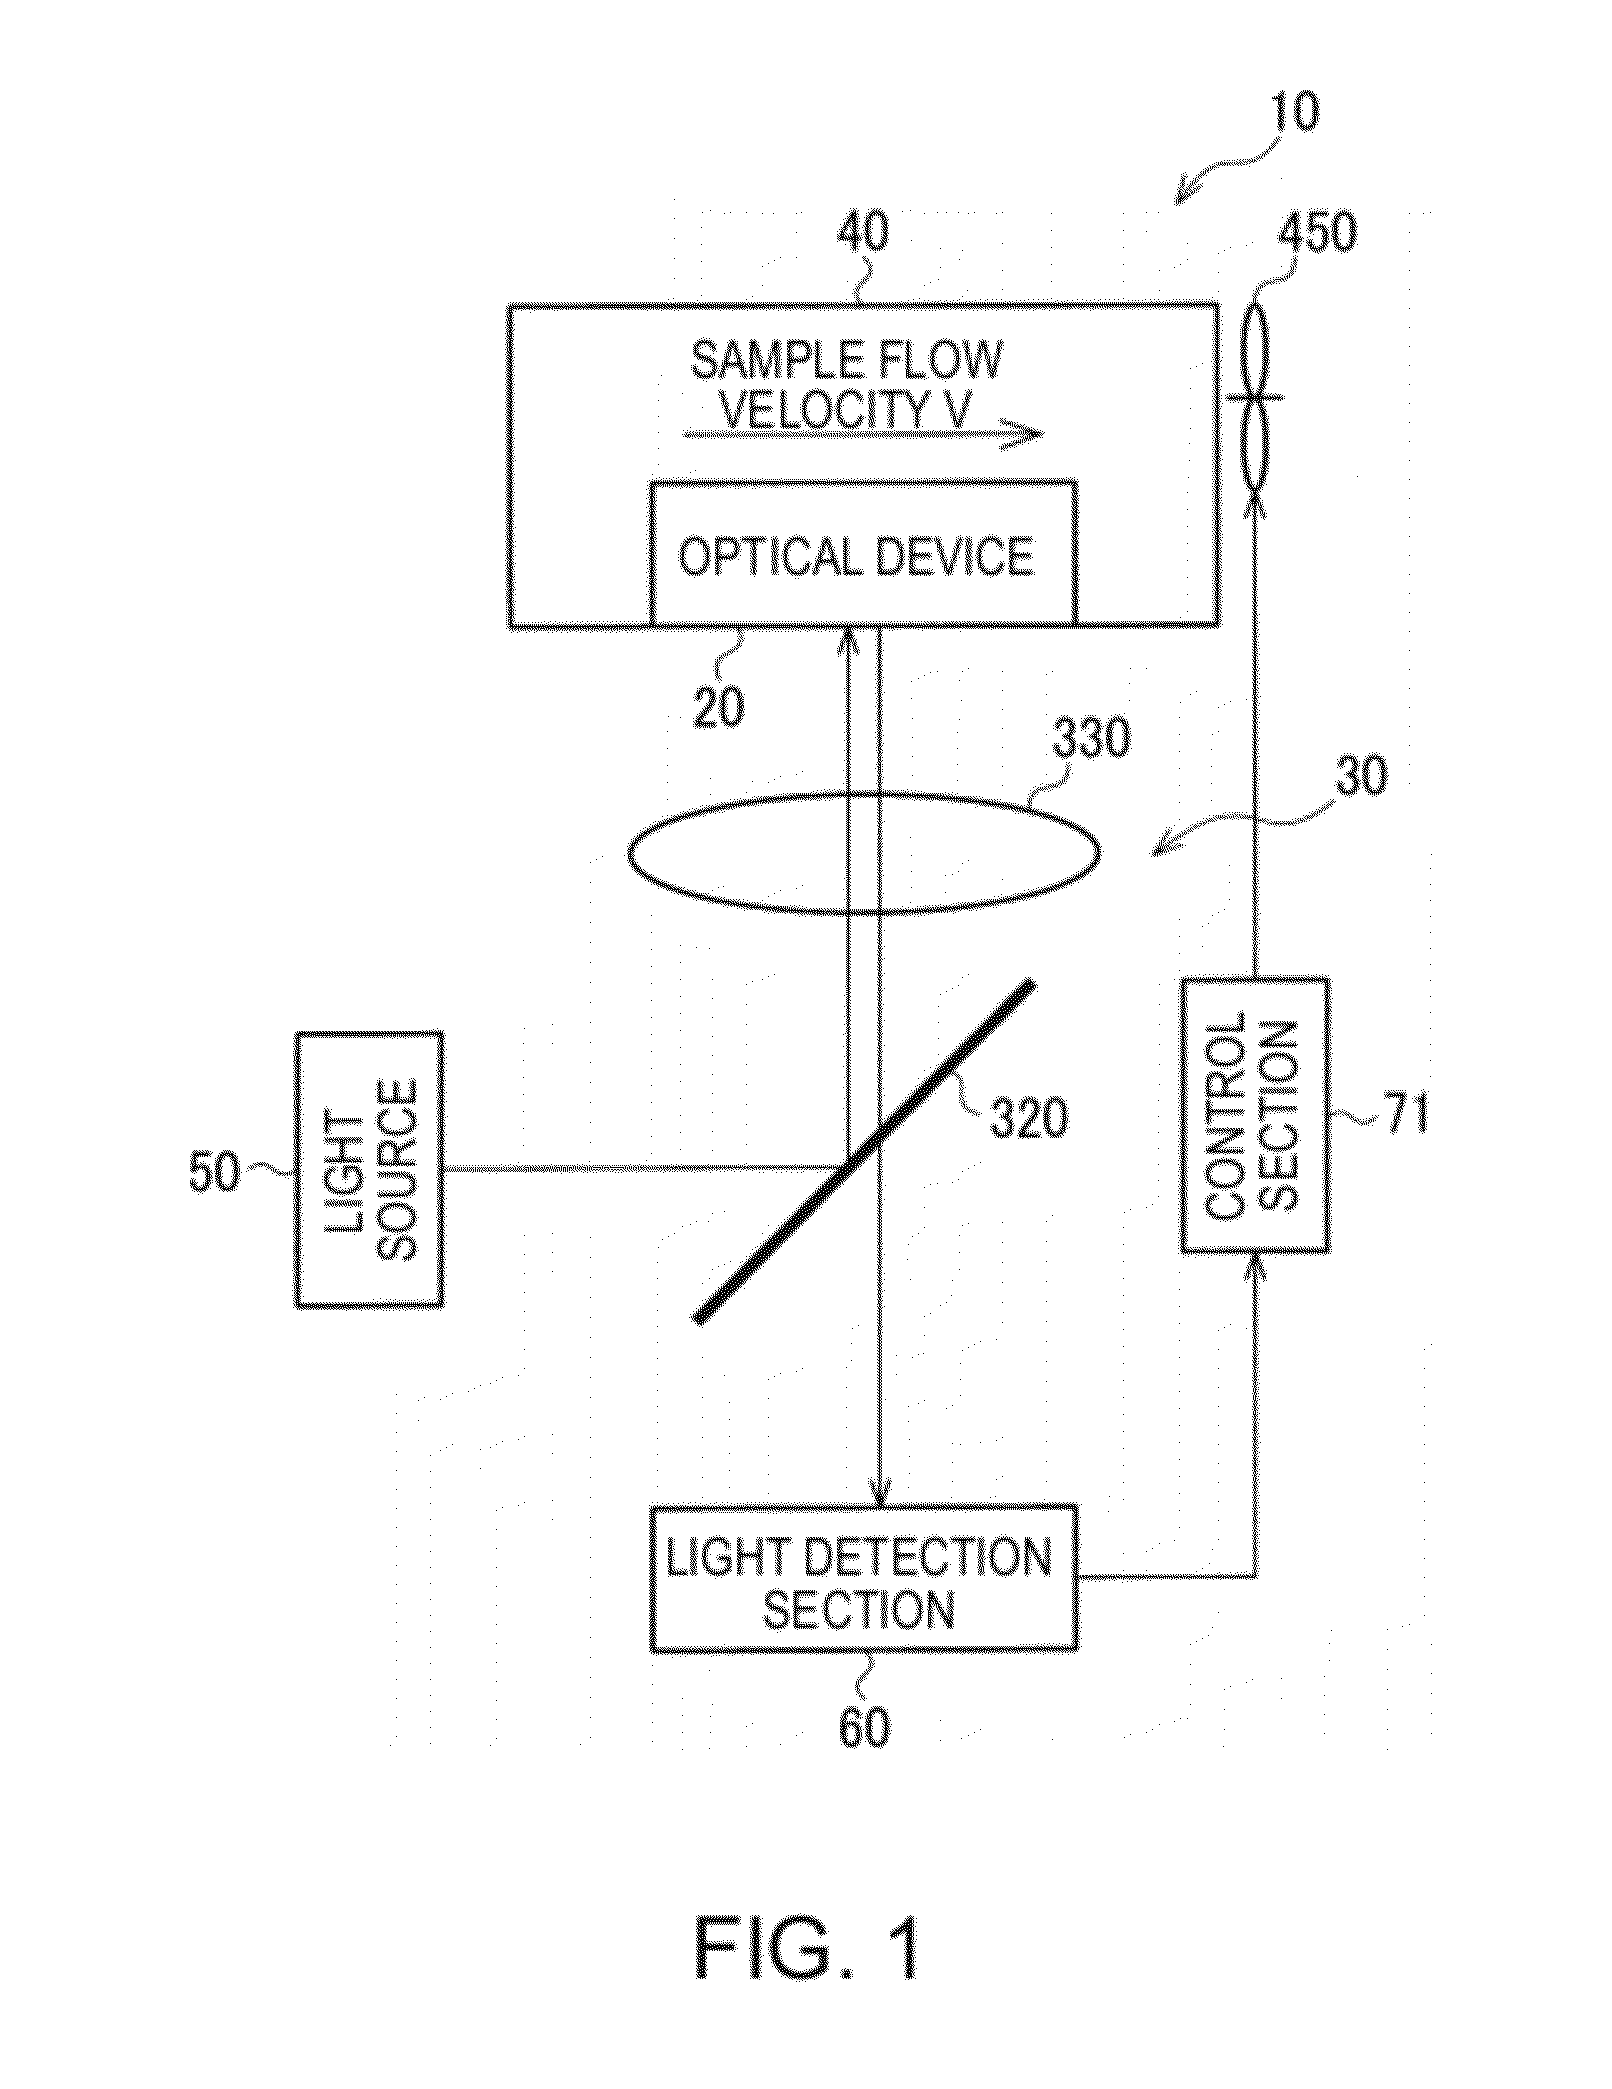
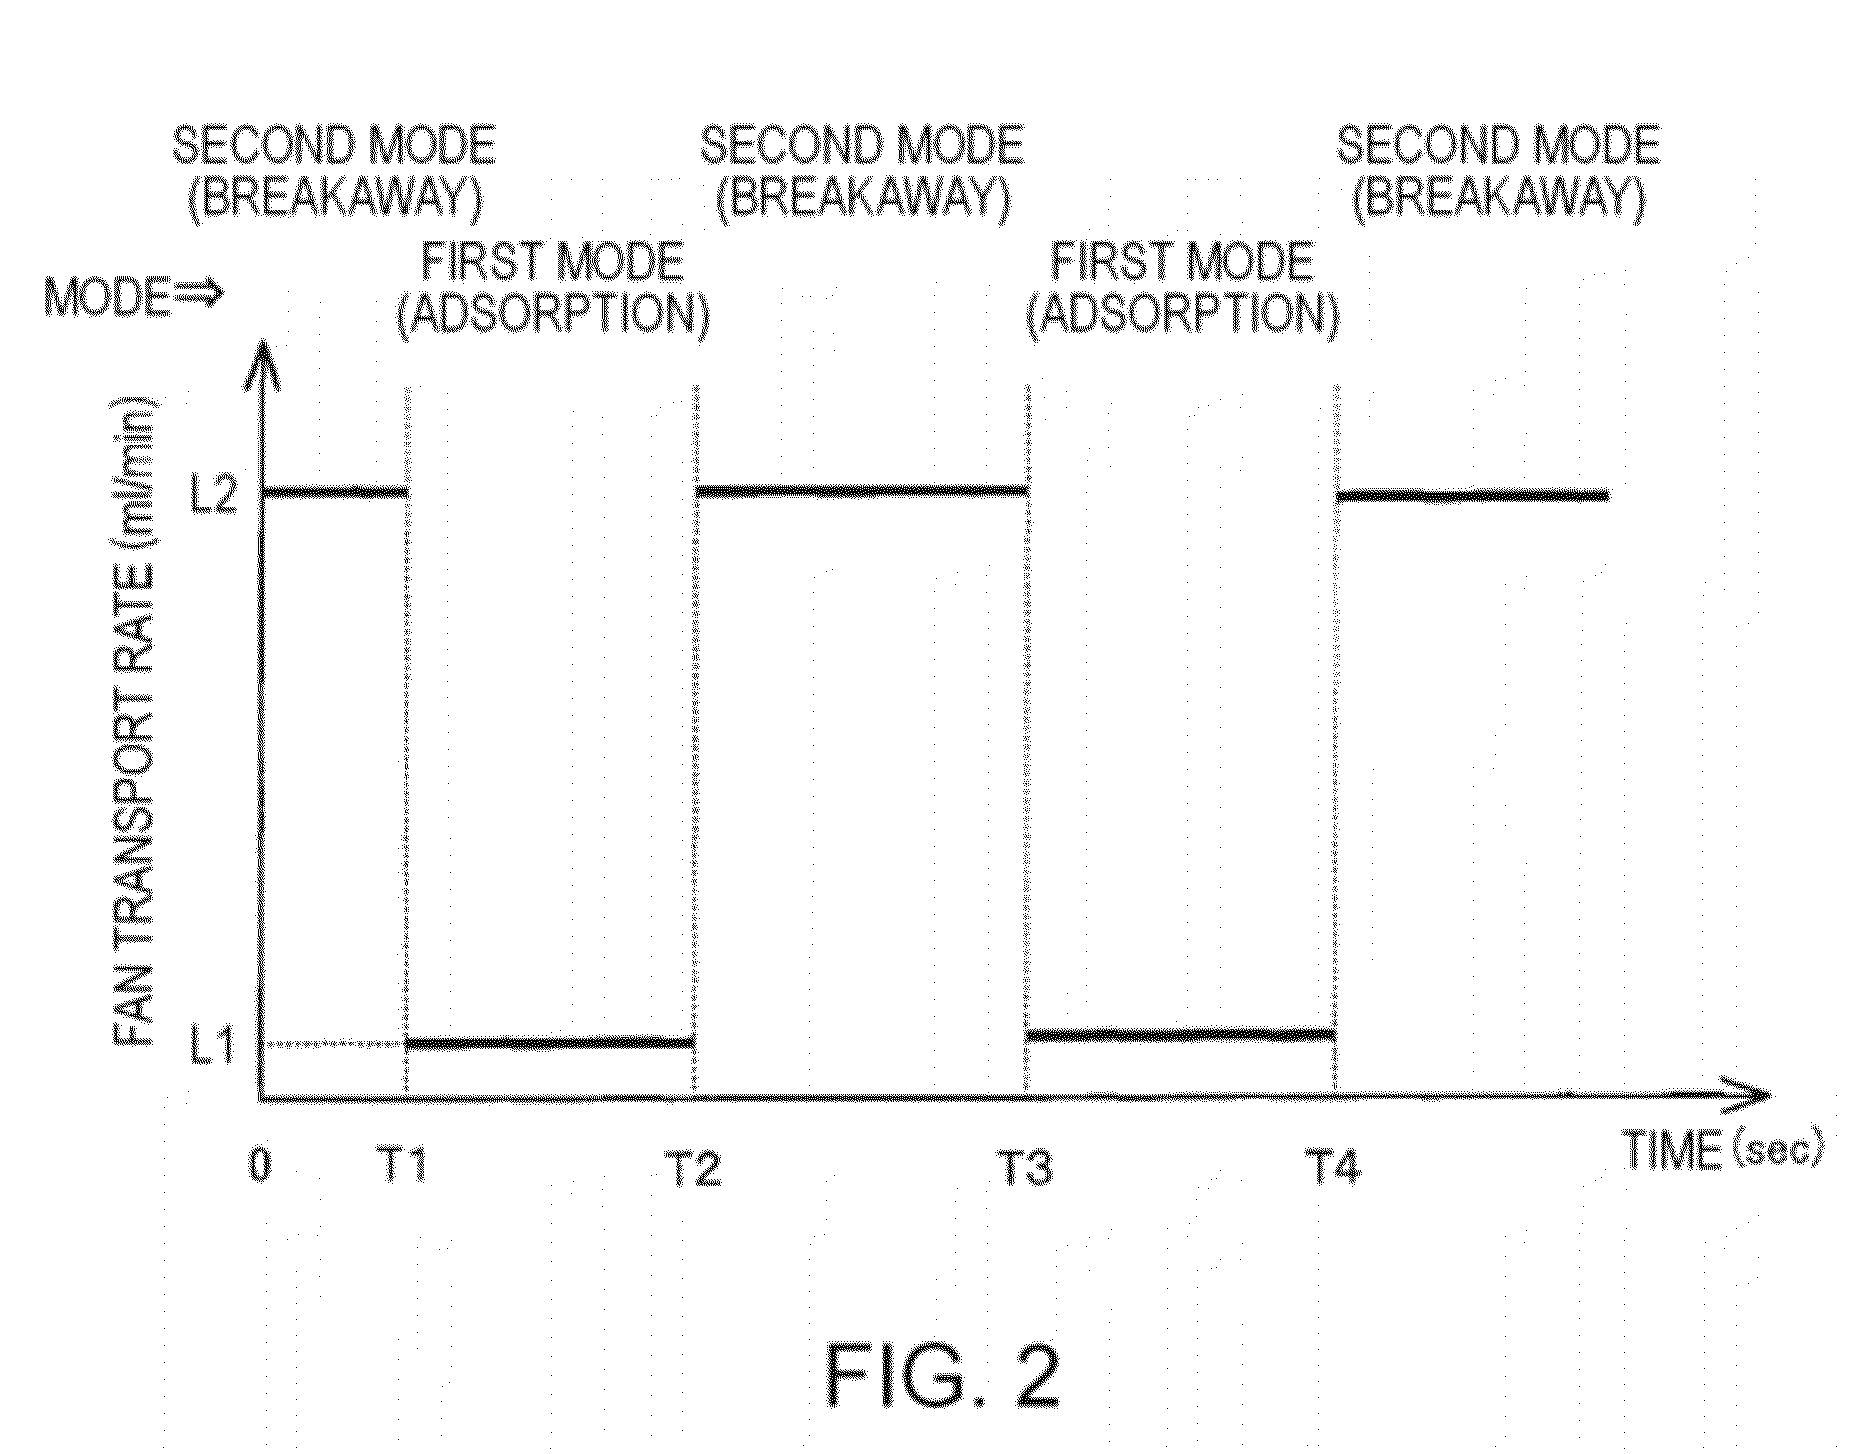
[0072]FIG. 9 shows a result of actual measurement using lactic acid gas molecules as the sample molecules 1 as the inspection target material performed in accordance with the time chart of the first mode (the adsorption mode) and the second mode (the breakaway mode) shown in FIG. 8. As the light source 50 shown in FIG. 6, a He—Ne laser with an excitation wavelength of 632.8 nm and intensity of 0.2 mW is used. The measurement exposure time in the light detection section 60 shown in FIG. 6 is set to 5 seconds, and the material of the optical device 20 shown in FIG. 6 is Ag. The fluid transport rate L1 of the fan 450 in the first mode (the adsorption mode) is set to 20 ml / min, and the fluid transport rate L2 of the fan 450 in the second mode (the breakaway mode) is set to 200 ml / min.
[0073]As shown in FIG. 8, the experiment starts with the breakaway mode for 30 seconds. The mode is switched to the adsorption mode of L1: 20 ml / min, 30 seconds later. FIG. 9 ...
second experimental example
4.2. Second Experimental Example
[0077]In the same device as in the first experimental example, isopropyl alcohol (IPA) molecules are used as the sample molecules 1 as the inspection target material, and the measurement is performed setting the measurement exposure time to 10 seconds. In the second experimental example, as shown in FIG. 10, the fluid transport rate L1 of the fan 450 in the first mode (the adsorption mode) is set to 0 ml / min, and the fluid transport rate L2 of the fan 450 in the second mode (the breakaway mode) is set to 20 ml / min. The fluid transport rates L1, L2 in the second experimental example are set lower than the respective fluid transport rates L1, L2 in the first experimental example.
[0078]The reason therefor is as follows. The IPA molecules have weak adsorption force to the optical device 20 than that of the lactic acid molecules. The molecules with weak adsorption force such as the IPA molecules often fail to be detected since the breakaway is promoted eve...
third experimental example
5.2. Third Experimental Example
[0087]FIG. 17 shows a result of an actual measurement using pyridine molecules as the reference molecules performed in accordance with the time chart of the first mode (the adsorption mode) and the second mode (the breakaway mode) shown in FIG. 16. It should be noted that the sample molecules are not particularly assumed in the third experimental example. As the light source 50 shown in FIG. 6, a He—Ne laser with an excitation wavelength of 632.8 nm and intensity of 2 mW is used. The measurement exposure time in the light detection section 60 shown in FIG. 6 is set to 10 seconds, and the material of the optical device 20 shown in FIG. 6 is Ag. The fluid transport rate L1 of the fan 450 in the first mode (the adsorption mode) is set to 20 ml / min, and the fluid transport rate L2 of the fan 450 in the second mode (the breakaway mode) is set to 2000 ml / min.
[0088]As shown in FIG. 16, the experiment starts with the breakaway mode for 30 seconds. The mode is ...
PUM
| Property | Measurement | Unit |
|---|---|---|
| size | aaaaa | aaaaa |
| wavelength | aaaaa | aaaaa |
| excitation wavelength | aaaaa | aaaaa |
Abstract
Description
Claims
Application Information
 - R&D
- Intellectual Property
- Life Sciences
- Materials
- Tech Scout
- Unparalleled Data Quality
- Higher Quality Content
- 60% Fewer Hallucinations
Browse by: Latest US Patents, China's latest patents, Technical Efficacy Thesaurus, Application Domain, Technology Topic, Popular Technical Reports.
© 2025 PatSnap. All rights reserved.Legal|Privacy policy|Modern Slavery Act Transparency Statement|Sitemap|About US| Contact US: help@patsnap.com