Furnace cooling panel monitoring system

a technology for monitoring systems and cooling panels, applied in the direction of manufacturing converters, furnaces, recovering materials, etc., can solve the problems of maintenance and/or performance issues of flow rate sensors, and achieve the effects of high heat energy dissipation flux rate, high change rate, and quick increase in heat energy dissipation ra

Active Publication Date: 2017-07-04
CIX INC
View PDF9 Cites 1 Cited by
  • Summary
  • Abstract
  • Description
  • Claims
  • Application Information

AI Technical Summary

Benefits of technology

[0010]The furnace cooling panel monitoring system, as described herein, is configured to provide real time data of heat energy dissipation rates of individual cooling panels. After an operator has designed the cooling panel array and input the K-values of the individual panels, the computer implemented monitoring program will calculate the amount of cooling fluid flow through each individual panel as a function of the inlet flow rate to the system. The temperature change from the inlet to the outlet of each cooling panel is then received to calculate the heat energy dissipation rate for each panel. This rate may be displayed in a chart or graphically on a display screen. In an exemplary embodiment, the heat energy dissipation rate is normalized for exposure surface area of an individual panel, thereby providing a specific heat energy dissipation rate. The exposure surface area is the relative amount of furnace wall that an individual panel is exposed to or responsible for dissipating heat therefrom. The exposure surface area may also be provided with a cooling panel from the manufacturer. A specific heat energy dissipation rate is the heat energy dissipation rate divided by the exposure surface area. A user may choose to display the heat energy dissipation rates or the specific heat energy dissipation rates. In an exemplary embodiment, a heat map display diagram is provided that shows a representation of the cooling panels configured around the furnace wherein each panel is a specific color or hue that represents a heat energy dissipation rate. A heat map display diagram may quickly alert an operator if a panel is much hotter than the other panels, or if there is a region of the furnace that is much hotter. An operator may change furnace parameters to moderate any temperature spikes within the furnace and thereby prevent explosions and damaging conditions to the furnace. Keeping the furnace walls within certain temperature limits can greatly extend the life of furnace components and provide a more cost efficient system.
[0013]The display graphs, charts and heat maps may be configured to display the heat energy dissipation rates or the rate of change of heat energy dissipation rates. If a panel is exposed to too much heat, it will have a very quick increase in heat energy dissipation rate and this high rate of change or heat dissipation flux rate may indicate a problem that needs to be addressed quickly. A threshold heat dissipation flux rate may be input into the computer implemented monitoring program by a user or may be provided by the manufacturer. A very high heat energy dissipation flux rate may subject a cooling panel to high stress as the materials of construction may be heating up too quickly. The sampling rate of the input variables, including cooling fluid temperature inputs, and cooling fluid flow rates, into the furnace cooling panel monitoring system may be any suitable rate including, but not limited to, more than about 60 Hz, more than about 30 Hz, more than about 1 Hz, no less than every 2 seconds, no less than every 10 seconds, and any range between and including the sampling rates provided. A high sampling rate may provide better resolution of display and more reliably and accurately alert a user of an alarm condition. Every second may be critical when an alarm condition is identified.

Problems solved by technology

This however, is expensive and the flow rate sensors may have maintenance and / or performance issues due to the extreme environments.

Method used


Image

  • Furnace cooling panel monitoring system
  • Furnace cooling panel monitoring system
  • Furnace cooling panel monitoring system

Examples


Embodiment Construction

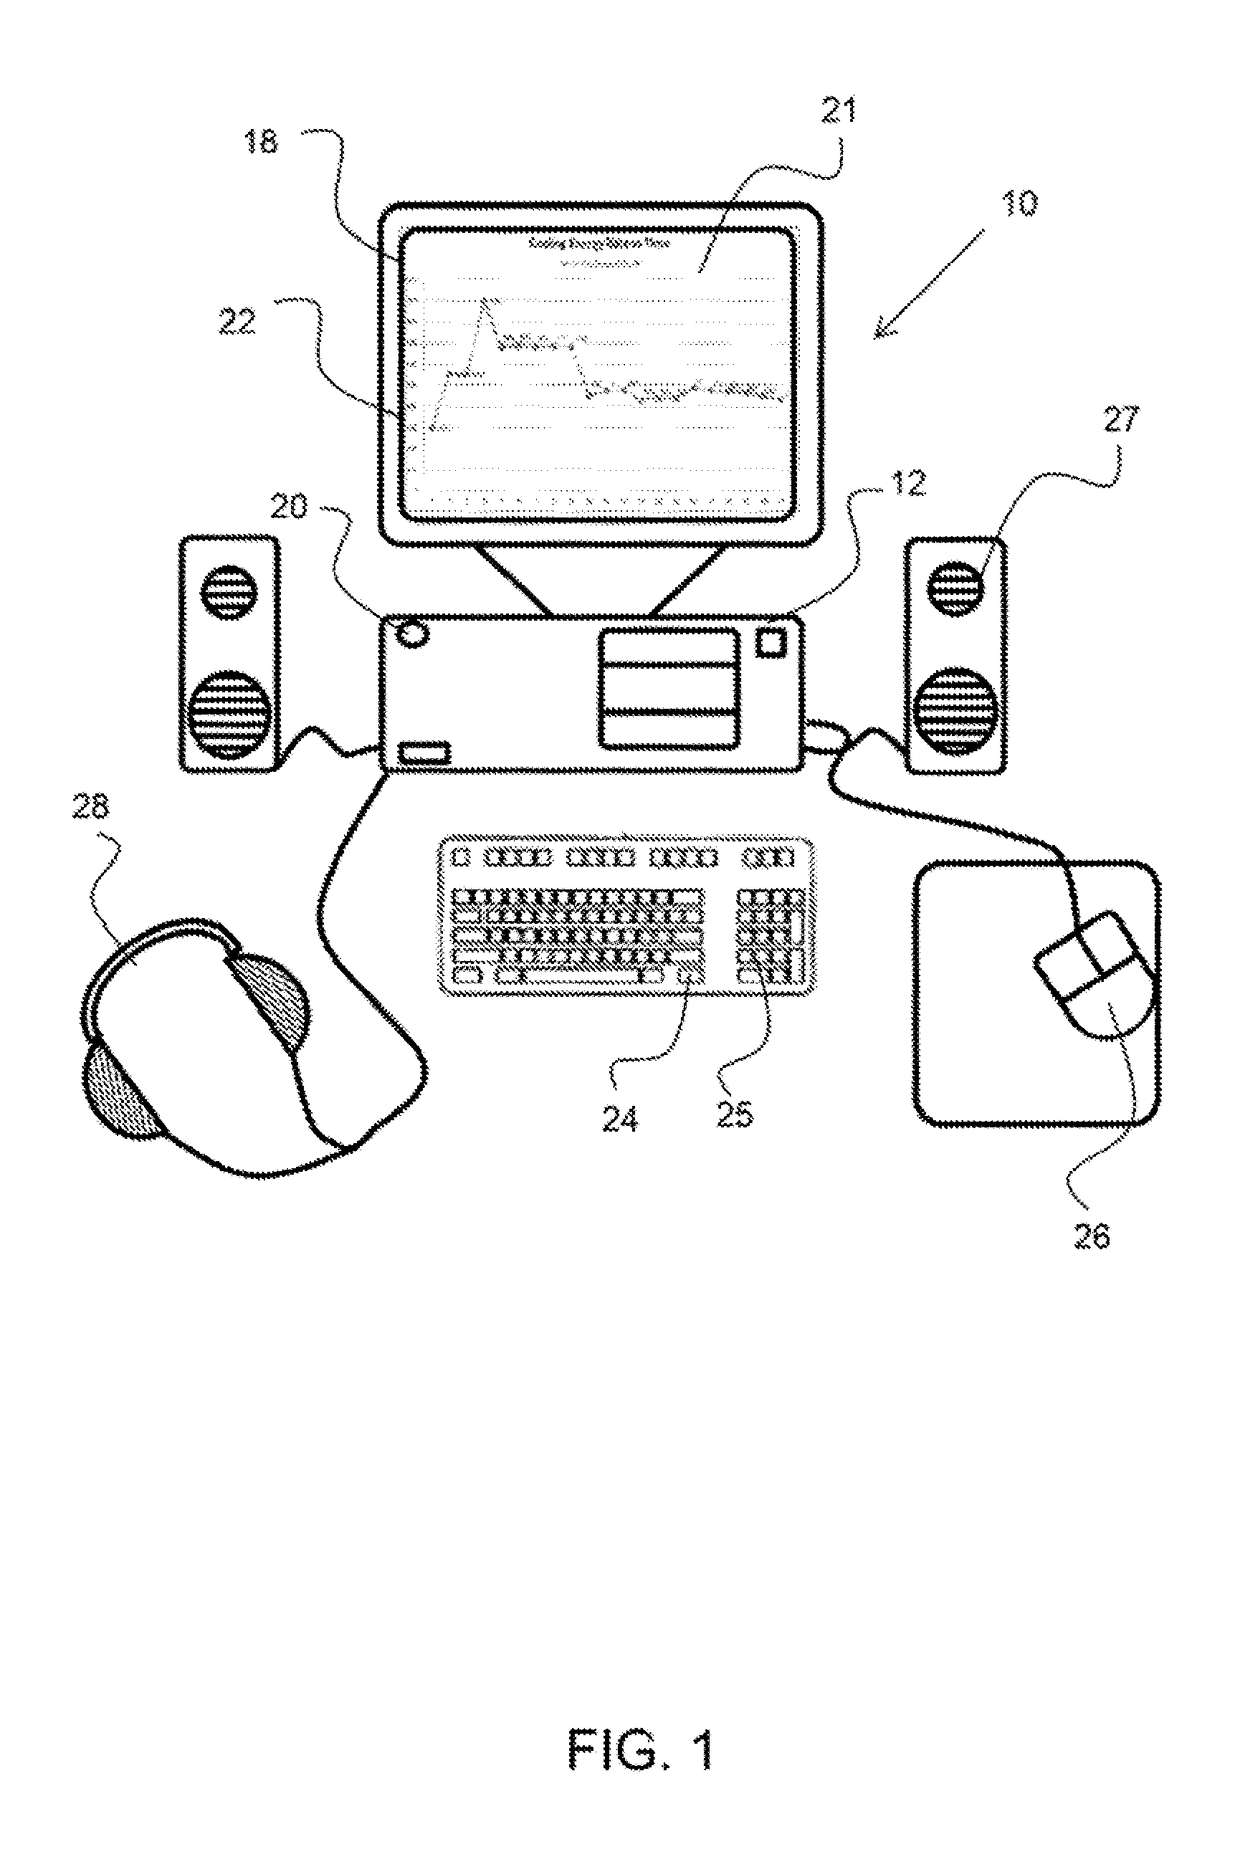
[0022]FIG. 1 shows an exemplary monitoring station for a furnace cooling panel monitoring system, as described herein.

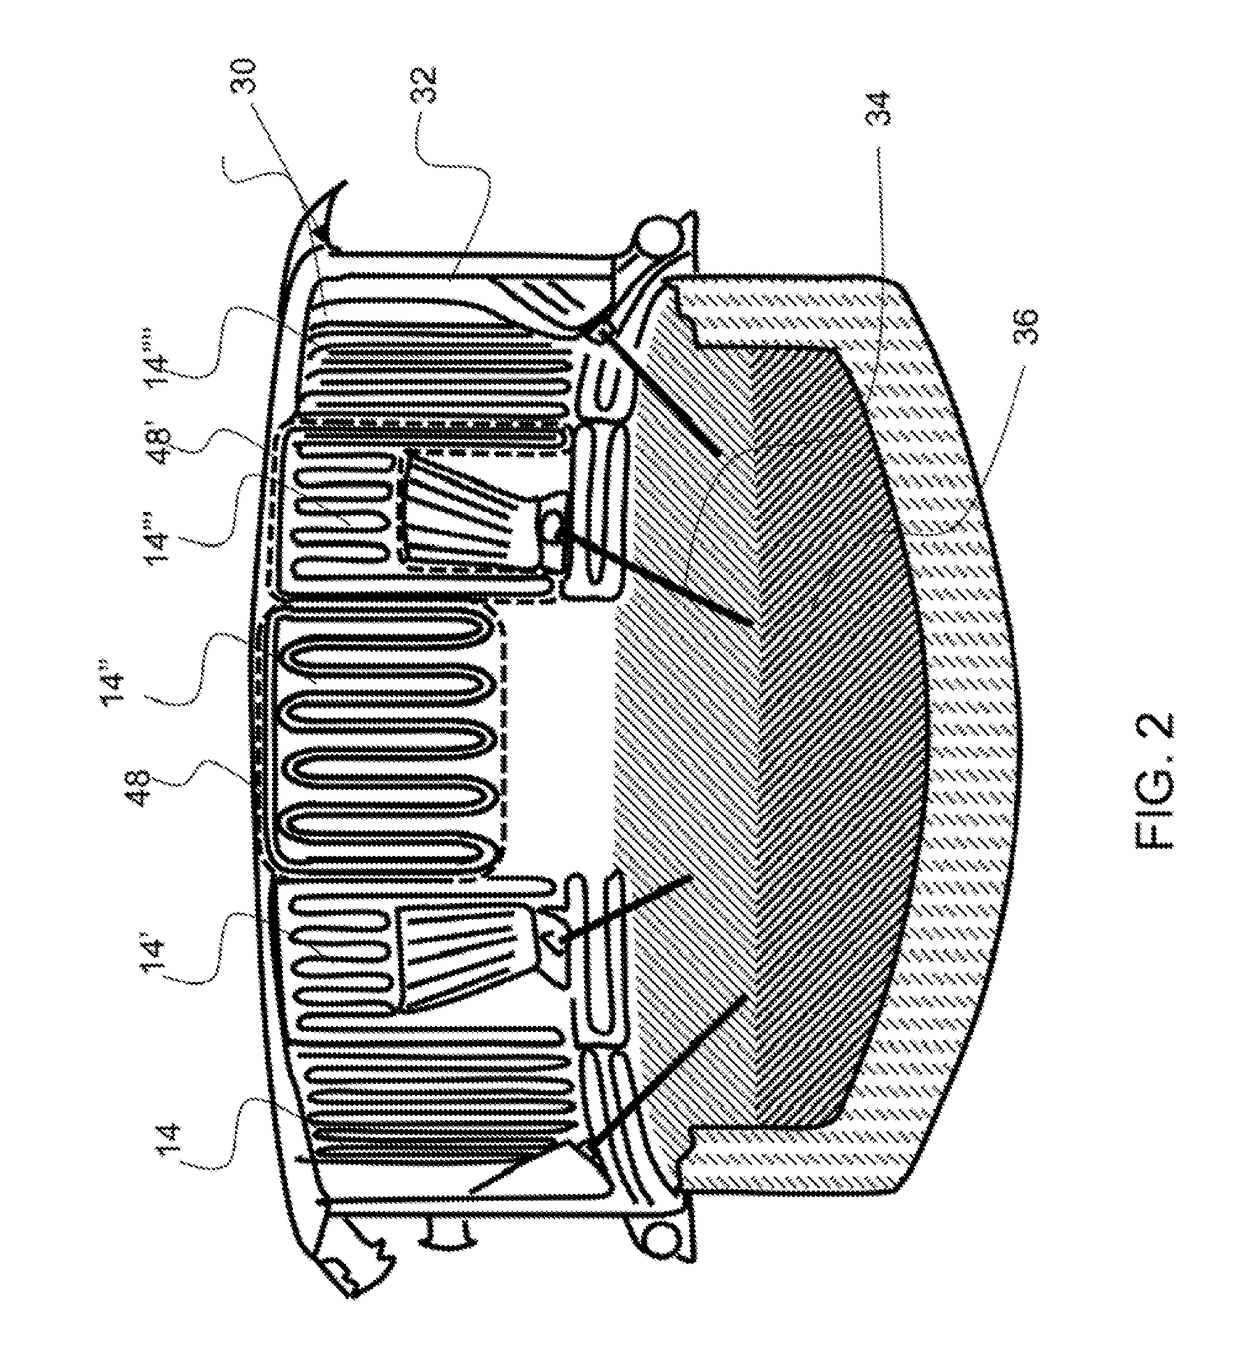
[0023]FIG. 2 shows an exemplary electric arc furnace having a plurality of cooling panels.

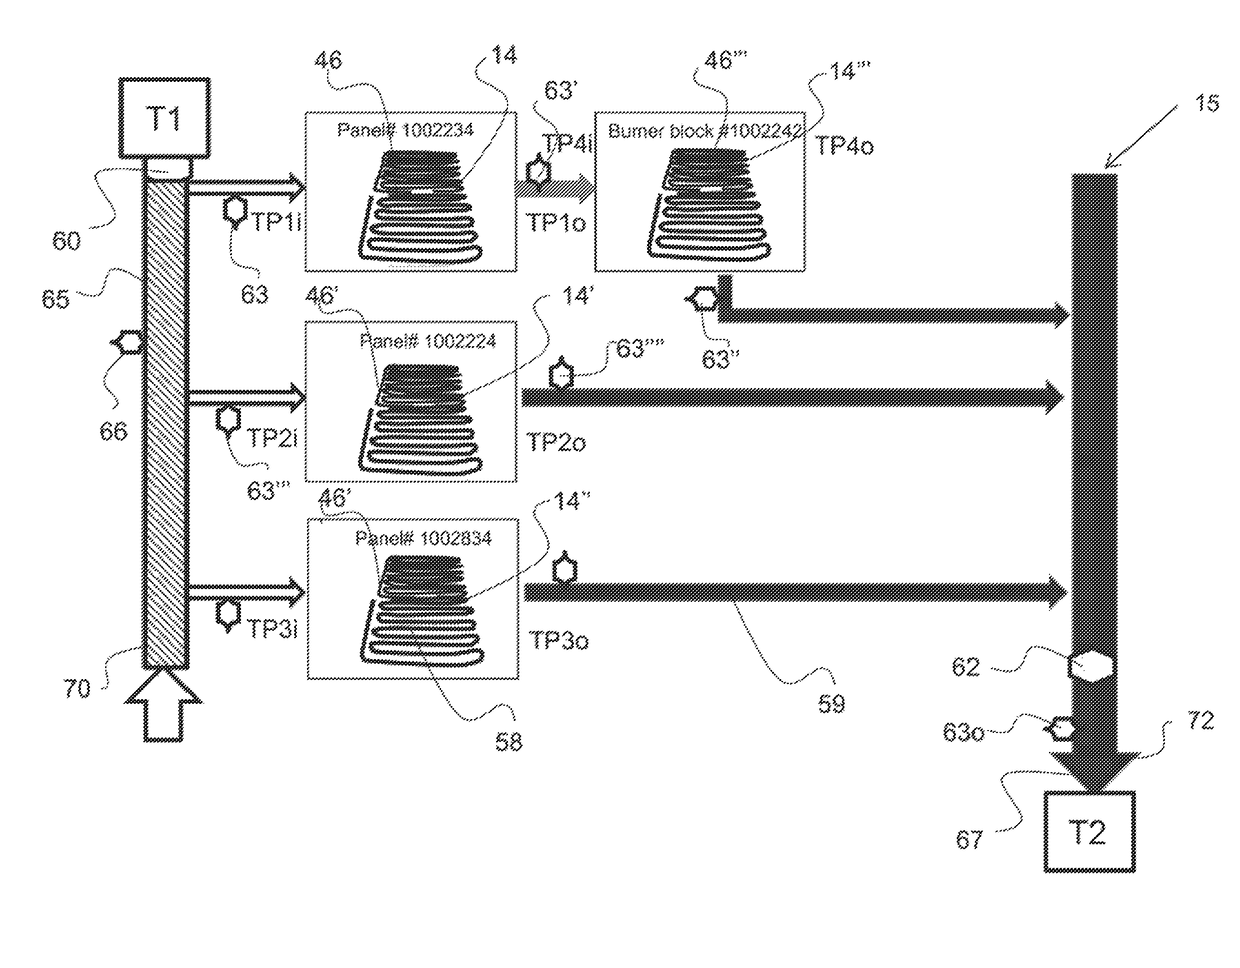
[0024]FIG. 3 shows a diagram of a cooling panel array comprising a plurality of individual cooling panels configured between an array cooling fluid inlet and an array cooling fluid outlet.

[0025]FIG. 4 shows a graph of pressure drop versus flow rate for an exemplary panel and an associated K value.

[0026]FIG. 5 shows an exemplary display chart of panel heat energy dissipation rates as a function of time.

[0027]FIG. 6 shows an exemplary display graph of heat energy dissipation rates as a function of time with a threshold value that is being surpassed by one of the cooling panels.

[0028]FIG. 7 shows an exemplary display graph of heat energy dissipation rate as a function of time.

[0029]FIG. 8 shows an exemplary heat map display diagram of cooling panels configured around a furnace.

[003...


PUM

PropertyMeasurementUnit
specific heataaaaaaaaaa
heat energy dissipation rateaaaaaaaaaa
flow rate resistanceaaaaaaaaaa

Abstract

A furnace cooling panel monitoring system utilizes individual cooling panel data to produce critical monitoring data. An exemplary cooling panel monitoring system utilizes the input from a plurality of temperature sensors configured to accurately measure the temperature change of cooling fluid flowing through each individual panel. The change in temperature from the inlet to the outlet of a cooling panel along with the flow rate of the cooling fluid through the panel can be used to calculate the a heat energy dissipation rate of the cooling panel, or heat flux. The flow rate through individual panels is determined by K-values or resistance to flow constants for a given cooling panel. The heat energy dissipation rate for individual panels can be provided to a user through a computer implemented monitoring program in real time. Alerts may be initiated by the computer implemented monitoring program when a threshold value has been exceeded.

Description

CROSS REFERENCE TO RELATED APPLICATIONS[0001]The application claims the benefit and priority to U.S. provisional patent application No. 62 / 025,036, filed on Jul. 16, 2014, entitled Furnace Cooling Panel Monitoring System; the entirety of which is incorporated by reference herein.BACKGROUND OF THE INVENTION[0002]Field of the Invention[0003]The present invention relates to furnace cooling panel monitoring systems and particularly those for electric arc furnaces and basic oxygen furnaces.[0004]Background[0005]High temperature reactors, such as electric arc furnaces, that operate at very high temperatures require cooling of the furnace walls to protect the furnace wall and other components of the furnace from the molten metal, slag and hot process gas. Cooling panels are configured around the furnace and cooling liquid, water in most cases, is pumped through cooling panel conduits to dissipate the heat. Monitoring the temperature of a furnace can be difficult because of the excessive he...

Claims


Application Information

Patent Timeline
Patent Type & Authority Patents(United States)
IPC IPC(8): F27D1/12F27B3/24F27D11/08F27B14/20C21C5/46F27D21/04F27B3/28F27D21/00F27D1/00F27D19/00C21C5/52F27B14/08F27D9/00
CPCF27D21/0014C21C5/4673F27B3/24F27B3/28F27B14/20F27D11/08F27D21/04C21C2005/5288F27B2014/0837F27D2009/0013F27D2019/0025Y02P10/216Y02P10/20
Inventor TRAPP, MARK EDWARD
Owner CIX INC
Why Eureka
Try Eureka